
Asia Pacific Artificial Intelligence(AI) in Chemicals Market (2024-2029)

The Asia Pacific Artificial Intelligence(AI) in Chemicals Market was valued at $176.2 Million in 2024 and projected to reach to $1028.8 Million by 2029, representing a compound annual growth rate of CAGR 42.3%. Asia Pacific's AI in chemicals market is poised for exceptional growth, driven by accelerating digital transformation initiatives among regional chemical manufacturers and increasing government support for Industry 4.0 adoption.


| Market Size in | USD 26.32 MN |
| Market Forecast in | |
| CAGR | |
| Forecast Period | |
| Units Considered | Value (USD MN) |
Asia Pacific Artificial Intelligence(AI) in Chemicals Market Trends and Insights
- The region is experiencing accelerated digital transformation as chemical manufacturers across Asia Pacific leverage AI technologies for process optimization, predictive maintenance, and supply chain enhancement.
- Asia Pacific's market is projected to expand dramatically to $1,028.8 million by 2029, reflecting a compound annual growth rate of 42.3%. The rapid expansion in Asia Pacific is driven by increasing investments in automation, rising demand for operational efficiency, and supportive government initiatives promoting Industry 4.0 adoption.
- Asia Pacific's chemical industry is increasingly integrating machine learning algorithms and AI-powered analytics to improve product quality and reduce production costs.
- The region's competitive advantage stems from its large manufacturing base, skilled workforce, and growing venture capital funding dedicated to AI-driven chemical innovations. Asia Pacific's market trajectory underscores the region's pivotal role in reshaping global chemical manufacturing through intelligent automation and data-driven decision-making.
- By 2029, Asia Pacific is expected to account for a substantial share of global AI adoption in chemicals, positioning the region as a leader in next-generation chemical production technologies..
Key Market Statistics
- CAGR (2024-2029) CAGR 42.3%
- Market Size, 2024 ~USD 176.2 Million
- Forecast, 2029 ~USD 1028.8 Million
- Geography Asia Pacific
Asia Pacific Artificial Intelligence(AI) in Chemicals Market Overview
Rapid Market Expansion :
Asia Pacific's AI in chemicals market is projected to grow from $176.2 million in 2024 to $1,028.8 million by 2029, representing a robust 42.3% CAGR, outpacing the global average of 39.2%.
Digital Transformation Leadership :
Chemical manufacturers across Asia Pacific are increasingly adopting AI for process optimization, predictive maintenance, and real-time quality control, driving competitive advantages in production efficiency.
Supply Chain Innovation :
AI-powered supply chain enhancement is becoming critical for Asia Pacific chemical companies, enabling demand forecasting, inventory optimization, and logistics cost reduction across the region.
Emerging Hub Status :
Asia Pacific is establishing itself as a critical hub for AI adoption in chemicals, with strong investments from both regional manufacturers and global technology providers entering the market.
Asia Pacific Artificial Intelligence(AI) in Chemicals Market Dynamics
- The region's competitive manufacturing landscape and rising labor costs are compelling companies to invest in AI-driven automation and optimization technologies.
- Major economies including China, India, Japan, and South Korea are leading adoption, with significant investments in R&D and smart manufacturing infrastructure. The forecast period through 2029 will witness expanded AI applications across process control, predictive analytics, and supply chain management.
- Growing environmental regulations and sustainability pressures are further incentivizing AI adoption for emissions monitoring and resource optimization.
- Strategic partnerships between regional chemical producers and global AI technology providers will accelerate market penetration, while emerging economies in Southeast Asia present untapped growth opportunities for market expansion..
Market Ecosystem
Related Ecosystem
Analytics
- Natural Language Processing (NLP)
- Machine Learning
- Supply Chain Management
- Predictive Analytics
- Image Sensors
- International Business Machines Corporation
- MICROSOFT CORPORATION
- Oracle Corporation
- SAP SE
Software And Services
- Natural Language Processing (NLP)
- Machine Learning
- Supply Chain Management
- Predictive Analytics
- Image Sensors
- International Business Machines Corporation
- MICROSOFT CORPORATION
- Oracle Corporation
- SAP SE
- Amazon.com, Inc.
Industrial Automation
- Sensors
- Image Sensors
- Manufacturing Execution System (MES)
- Actuators
- Flow Sensors
- Siemens ag
- ABB India Limited
- Emerson Electric Co.
- HONEYWELL INTERNATIONAL INC.
- SCHNEIDER ELECTRIC SE
Key Takeaways
- Asia Pacific's AI in Chemicals market is valued at $176.2 million in 2024 and is forecast to reach $1,028.8 million by 2029, representing a 42.3% CAGR.
- Asia Pacific is experiencing rapid digital transformation driven by automation investments, Industry 4.0 initiatives, and government support for intelligent manufacturing.
- Asia Pacific's chemical manufacturers are deploying AI for predictive maintenance, process optimization, and supply chain visibility to enhance operational efficiency.
- Asia Pacific's large manufacturing base, skilled workforce, and growing venture capital ecosystem position the region as a global leader in AI-driven chemical innovation.
Artificial Intelligence(AI) in Chemicals Market Report Scope
| Report Metric | Details |
|---|---|
| Base Year | 2024 |
| Fastest Growing Segment | MANAGED SERVICES (Service) |
| Forecast Period | 2024-2029 |
| Growth Rate | CAGR of 39.2% from 2024 to 2029 |
| Largest Segment | SOFTWARE (Offering) |
| Market Size Base Year (Billions) | ~USD 0.73 (2024) |
| Revenue Forecast (Billions) | ~USD 3.8 (2029) |
| Segments Covered | Component, Hardware, Software Type, Technology, Deployment Mode, Service, Professional Service, Business Application, End User, Offering, Business Function, Vertical |
Asia Pacific Artificial Intelligence(AI) in Chemicals Market Report Segmentation
12 segment dimensions are covered across the global market.
By Component
- Hardware
- Services
- Software
By Hardware
- Accelerators
- Memory
- Network
- Processors
By Software Type
- Chemical Modeling Software
- Chemical Property Prediction Tools
- Dashboard & Analytics Tools
- Laboratory Management Software
- Process Simulation Software
- Virtual Screening Tools
By Technology
- Advanced Analytics
- Computer Vision
- Context Awareness
- Deep Learning
- Generative AI
- Machine Learning
- ML
- Natural Language Processing
- Nlp
By Deployment Mode
- Cloud
- On-Premises
By Service
- Managed Services
- Professional Services
By Professional Service
- Consulting Services
- Deployment & Integration Services
- Support & Maintenance Services
By Business Application
- Production
- R&D
- Strategy Management
- Supply Chain Management
By End User
- Active Ingredients
- Adhesive & Sealants
- Adhesives & Sealants
- Advance Materials
- Advanced Materials
- Basic & Chemicals
- Basic Chemicals
- Green & Biochemicals
- Other End Users
- Paints & Coatings
- Water Treatment & Services
By Offering
- Hardware
- Services
- Software
By Business Function
- Finance
- Human Resource
- Law
- Marketing & Sales
- Operations
- Security
- Supply Chain Management
By Vertical
- Agriculture
- Automotive, Transportation, And Logistics
- Bfsi
- Construction And Real Estate
- Energy & Utilities
- Energy And Utilities
- Energy And Utilties
- Government & Defense
- Government And Defense
- Healthcare & Life Sciences
- It & Ites
- It/Ites
- Manufacturing
- Media & Entertainment
- Other Verticals
- Retail & Ecommerce
- Telecom
- Transportation & Logistics
Target Audience
- Chemical Manufacturers : Regional and multinational chemical producers need Asia Pacific market intelligence to prioritize AI investments, optimize operations, and maintain competitive positioning in the region's high-growth market.
- AI & Software Technology Providers : Technology companies targeting the chemicals sector require detailed Asia Pacific market data to identify customer segments, forecast revenue potential, and develop region-specific solutions.
- Private Equity & Investors : Investment firms evaluating opportunities in Asia Pacific chemicals need comprehensive market forecasts and growth drivers to assess portfolio companies and identify acquisition targets.
- Consulting & Strategy Firms : Management consultants advising chemical clients on digital transformation require Asia Pacific-specific market insights and trend analysis to develop credible, region-focused strategies.
- Government & Policy Bodies : Regional government agencies and industry associations need market data to inform industrial policy, R&D funding decisions, and support programs for chemical sector digitalization.
Countries within Asia Pacific - compare and drill down
| Country | 2025 size (native) |
|---|---|
| China | USD 252.6 Million |
| India | USD 203.7 Million |
| Japan | USD 214 Million |
| South Korea | USD 192.9 Million |
| Rest Of Asia Pacific | USD 165.6 Million |
Country market size visualization
Reasons to Buy this Report
- Regional Market Sizing & Forecasts : Obtain precise market valuations for Asia Pacific and individual country-level data, enabling accurate budget allocation and investment planning specific to regional opportunities.
- Competitive Landscape Intelligence : Understand key players, market share dynamics, and competitive positioning within Asia Pacific's rapidly evolving AI-chemicals sector to inform strategic decision-making.
- Growth Opportunity Identification : Identify high-growth segments and emerging applications of AI in chemicals across Asia Pacific, from predictive maintenance to supply chain optimization, for targeted expansion.
- Regional Trend Analysis : Access insights into Asia Pacific-specific adoption drivers, regulatory environments, and technology preferences that differ from global markets.
- Investment & Partnership Strategy : Leverage detailed forecasts and market dynamics to guide M&A decisions, joint ventures, and technology partnerships within the Asia Pacific chemical industry.
Frequently asked questions
What is the current market size of AI in Chemicals in Asia Pacific?
Asia Pacific's AI in Chemicals market was valued at $176.2 million in 2024 and is projected to grow to $1,028.8 million by 2029.
What is the expected growth rate for AI in Chemicals in Asia Pacific?
Asia Pacific's AI in Chemicals market is expected to grow at a compound annual growth rate (CAGR) of 42.3% from 2024 to 2029.
Which countries in Asia Pacific are leading AI adoption in chemicals?
Asia Pacific's major chemical manufacturing hubs including China, India, Japan, and South Korea are driving significant AI adoption and investment in the region.
What are the primary applications of AI in Asia Pacific's chemical industry?
Asia Pacific's chemical manufacturers are utilizing AI for predictive maintenance, process optimization, quality control, supply chain management, and product development.
What factors are driving AI adoption in Asia Pacific's chemicals market?
Asia Pacific's growth is driven by increasing automation investments, Industry 4.0 initiatives, government support, cost reduction pressures, and the need for improved operational efficiency.
RESEARCH METHODOLOGY
The research study for the AI in chemicals market involved extensive secondary sources, directories, International Journal of Innovation and Technology Management and paid databases. Primary sources were mainly industry experts from the core and related industries, preferred AI in chemicals market providers, third-party service providers, consulting service providers, end users, and other commercial enterprises. In-depth interviews were conducted with various primary respondents, including key industry participants and subject matter experts, to obtain and verify critical qualitative and quantitative information, and assess the market’s prospects.
Secondary Research
The market size of companies offering AI in chemicals hardware, software and services was arrived at hardware, software, and services was determined based on secondary data available through paid and unpaid sources. It was also arrived at by analyzing the product portfolios of major companies and rating the companies based on their performance and quality.
In the secondary research process, various sources were referred to, for identifying and collecting identify and collect information for this study. Secondary sources included annual reports, press releases, and investor presentations of companies; white papers, journals, and certified publications; and articles from recognized authors, directories, and databases. The data was also collected from other secondary sources, such as journals, government websites, blogs, and vendors' websites. Additionally, AI in chemicals spending of spending in various countries was extracted from the respective sources. Secondary research was mainly used to obtain key information related to the industry’s value chain and supply chain to identify key players based on hardware, software, services, market classification, and segmentation according to offerings of major players, industry trends related to components, business applications, end users, and regions, and key developments from both market- and technology-oriented perspectives.
Primary Research
In the primary research process, various primary sources from both the supply and demand sides were interviewed to obtain qualitative and quantitative information on the market. The primary sources from the supply side included various industry experts, including Chief Experience Officers (CXOs); Vice Presidents (VPs); directors from business development, marketing, and AI in chemicals expertise; related key executives from AI in chemicals solution vendors, System Integrators (SIs), professional service providers, and industry associations; and key opinion leaders.
Primary interviews were conducted to gather insights, such as market statistics, revenue data collected from hardware, software, and services, market breakups, market size estimations, market forecasts, and data triangulation. Primary research also helped in understandingunderstand various trends related to technologies, applications, deployments, and regions. Stakeholders from the demand side, such as Chief Information Officers (CIOs), Chief Technology Officers (CTOs), Chief Strategy Officers (CSOs), and end users using AI in chemicals hardware, software, and services, were interviewed to understand the buyer’s perspective on suppliers, products, service providers, and their current usage of AI in chemicals hardware, software, and services and services, which would impact the overall AI in chemicals market.
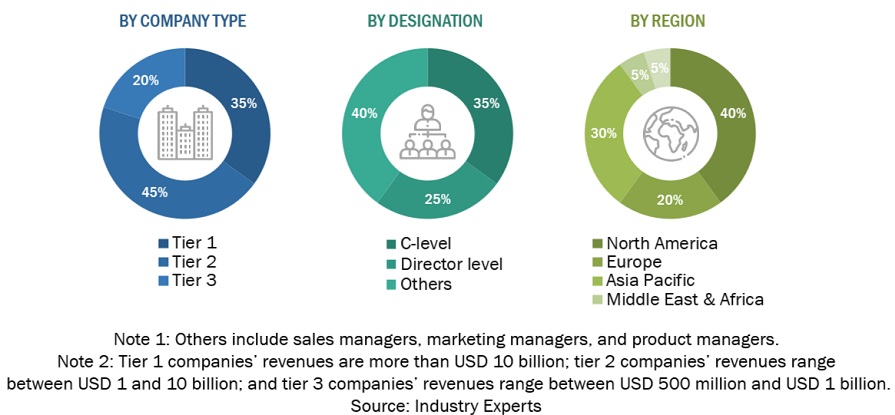
The following is the breakup of primary profiles:
To know about the assumptions considered for the study, download the pdf brochure
Market Size Estimation
Multiple approaches were adopted for estimating and forecasting the AI in chemicals market. The first approach involves estimating the market size by summation of companies’ revenue generated through the sale of hardware, software and services.
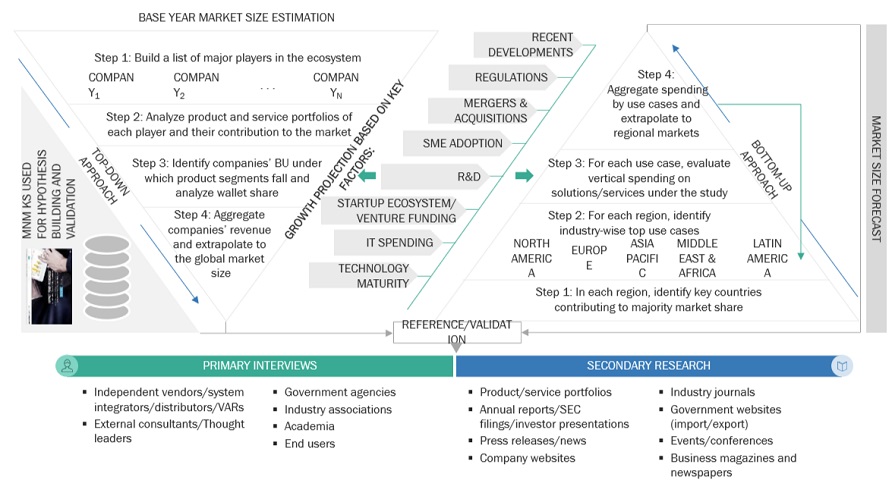
Market Size Estimation Methodology-Top-down approach
In the top-down approach, an exhaustive list of all the vendors offering hardware, software and services in the AI in chemicals market was prepared. The revenue contribution of the market vendors was estimated through annual reports, press releases, funding, investor presentations, paid databases, and primary interviews. Each vendor’s offerings were evaluated based on the breadth of hardware, solutions, solution by component, business application, end user and regions. The aggregate of all the companies’ revenue was extrapolated to reach the overall market size. Each subsegment was studied and analyzed for its global market size and regional penetration. The markets were triangulated through both primary and secondary research. The primary procedure included extensive interviews for key insights from industry leaders, such as CIOs, CEOs, VPs, directors, and marketing executives. The market numbers were further triangulated with the existing MarketsandMarkets repository for validation.
Market Size Estimation Methodology-Bottom-up approach
In the bottom-up approach, the adoption rate of AI in chemicals hardware, software and services among different end users in key countries with respect to their regions contributing the most to the market share was identified. For cross-validation, the adoption of AI in chemicals hardware, software and services among industries, along with different use cases with respect to their regions, was identified and extrapolated. Weightage was given to use cases identified in different regions for the market size calculation.
Based on the market numbers, the regional split was determined by primary and secondary sources. The procedure included the analysis of the AI in chemicals market’s regional penetration. Based on secondary research, the regional spending on Information and Communications Technology (ICT), socio-economic analysis of each country, strategic vendor analysis of major AI in chemicals hardware, software and services providers, and organic and inorganic business development activities of regional and global players were estimated. With the data triangulation procedure and data validation through primaries, the exact values of the overall AI in chemicals hardware, software and services market size and segments’ size were determined and confirmed using the study.
Top-down and Bottom-up approaches
To know about the assumptions considered for the study, Request for Free Sample Report
Data Triangulation
After arriving at the overall market size using the market size estimation processes as explained above, the market was split into several segments and subsegments. To complete the overall market engineering process and arrive at the exact statistics of each market segment and subsegment, data triangulation and market breakup procedures were employed, wherever applicable. The overall market size was then used in the top-down procedure to estimate the size of other individual markets via percentage splits of the market segmentation.
Market Definition
According to Nexocode, Artificial Intelligence (AI) is a powerful tool that can help chemical companies work smarter and faster. The technology enables more productive processes by automating tasks, providing insights into how chemicals react, or improving manufacturing environments.
AI in chemicals refers to the application of AI technologies and techniques within the chemical industry to enhance processes, improve decision-making, and drive innovation. It uses advanced algorithms, machine learning models, and data analytics to optimize various aspects of chemical production, research and development, supply chain management, and environmental sustainability. AI in chemicals enables companies to streamline operations, develop new materials and products more efficiently, and respond effectively to market dynamics, ultimately leading to improved productivity, cost savings, and competitive advantage.
Stakeholders
- AI in Chemicals Sofware Providers
- AI Technology Providers
- Professional and Managed Service Providers
- Industry Associations
- Research Institutions
- System Integrators
- Technology Consultants
- Independent Software Vendors (ISVs)
- Consulting Firms
- Value-Added Resellers (VARs)
- Government Agencies
Report Objectives
- To define, describe, and predict the AI in chemicals market by component (hardware, software, and services), business application, and end users.
- To provide detailed information related to major factors (drivers, restraints, opportunities, and industry-specific challenges) influencing the market growth
- To forecast the market size of segments with respect to five main regions: North America, Europe, Asia Pacific, Middle East & Africa, and Latin America
- To strategically analyze micromarkets with respect to individual growth trends, prospects, and contributions to the overall AI in chemicals market
- To analyze opportunities in the market and provide details of the competitive landscape for stakeholders and market leaders
- To analyze competitive developments, such as partnerships, mergers and acquisitions, and product developments, in the AI in chemicals market
- To analyze the impact of the recession across all the regions in the AI in chemicals market
Available Customizations
With the given market data, MarketsandMarkets offers customizations as per the company’s specific needs. The following customization options are available for the report:
Product Analysis
- The product matrix provides a detailed comparison of the product portfolio of each company.
Geographic Analysis as per Feasibility
- Further breakup of the North American AI in chemicals Market
- Further breakup of the European Market
- Further breakup of the Asia Pacific Market
- Further breakup of the Middle East & Africa Market
- Further breakup of the Latin American AI in chemicals Market
Company Information
- Detailed analysis and profiling of additional market players (up to five)
Get the Full Artificial Intelligence(AI) in Chemicals Market Report
Full forecast, segment splits, and company analysis for all Artificial Intelligence(AI) in Chemicals Market.
- France Artificial Intelligence(AI) in Chemicals Market
- Italy Artificial Intelligence(AI) in Chemicals Market
- Rest Of Europe Artificial Intelligence(AI) in Chemicals Market
- Spain Artificial Intelligence(AI) in Chemicals Market
- UK Artificial Intelligence(AI) in Chemicals Market
- India Artificial Intelligence(AI) in Chemicals Market
- Japan Artificial Intelligence(AI) in Chemicals Market
- Rest Of Asia Pacific Artificial Intelligence(AI) in Chemicals Market
- South Korea Artificial Intelligence(AI) in Chemicals Market
- Argentina Artificial Intelligence(AI) in Chemicals Market
- Brazil Artificial Intelligence(AI) in Chemicals Market
- Mexico Artificial Intelligence(AI) in Chemicals Market
- Rest Of Latin America Artificial Intelligence(AI) in Chemicals Market
- Saudi Arabia Artificial Intelligence(AI) in Chemicals Market
- South Africa Artificial Intelligence(AI) in Chemicals Market
- UAE Artificial Intelligence(AI) in Chemicals Market
- Canada Artificial Intelligence(AI) in Chemicals Market
- US Artificial Intelligence(AI) in Chemicals Market
- Germany Artificial Intelligence(AI) in Chemicals Market
- China Artificial Intelligence(AI) in Chemicals Market
Need a Tailored Report?
Customize this report to your needs
Get 10% FREE Customization
Customize This Report
