
Asia Pacific Automated Border Control Market (2025-2030)

The Asia Pacific Automated Border Control Market was valued at $610.3 Million in 2025 and projected to reach to $1270.2 Million by 2030, representing a compound annual growth rate of 15.8%. Asia Pacific's automated border control market is positioned for exceptional growth, driven by unprecedented passenger volumes and government commitments to modernizing immigration infrastructure.


| Market Size in | USD 26.32 MN |
| Market Forecast in | |
| CAGR | |
| Forecast Period | |
| Units Considered | Value (USD MN) |
Asia Pacific Automated Border Control Market Trends and Insights
- Asia Pacific's growth trajectory reflects accelerating digital transformation across border security infrastructure, driven by rising passenger volumes and government investments in smart immigration systems.
- The region's 15.8% compound annual growth rate significantly outpaces global trends, positioning Asia Pacific as a critical hub for biometric and e-gate technology adoption. Asia Pacific's market expansion is underpinned by increasing cross-border mobility, urbanization, and regulatory mandates for enhanced security protocols.
- Major economies within Asia Pacific are modernizing airport and port facilities with automated passenger processing systems, including facial recognition and iris scanning technologies.
- Between 2025 and 2030, Asia Pacific is expected to capture substantial market share as nations prioritize seamless traveler experiences alongside stringent border security requirements. The competitive landscape in Asia Pacific reflects both established semiconductor players and emerging regional technology providers.
- Asia Pacific's strategic geographic position, coupled with high-volume international travel corridors, creates sustained demand for scalable automated border control solutions across the forecast period..
Key Market Statistics
- CAGR (2025-2030) 15.8% CAGR
- Market Size, 2025 ~USD 610.3 Million
- Forecast, 2030 ~USD 1270.2 Million
- Geography Asia Pacific
Asia Pacific Automated Border Control Market Overview
Market Valuation & Growth :
Asia Pacific's automated border control market is valued at $610.3 million in 2025, with a robust 15.8% CAGR projected through 2030, reaching $1,270.2 million and outpacing the global growth rate of 14.4%.
Digital Transformation Leadership :
The region is spearheading digital transformation in border security infrastructure, with governments across Asia Pacific investing heavily in smart immigration systems and biometric technologies to modernize airport and port operations.
Rising Passenger Volumes :
Accelerating international travel and cross-border mobility in Asia Pacific are driving demand for automated border control solutions, with major hubs in China, Japan, and India leading infrastructure modernization initiatives.
Government Investment Surge :
Strategic government funding for smart border infrastructure, coupled with increasing security concerns and visa processing efficiency demands, is catalyzing rapid adoption of automated control systems across the region.
Asia Pacific Automated Border Control Market Dynamics
- Countries including China, Japan, India, and Australia are deploying advanced biometric and AI-powered systems to enhance border security while reducing processing times.
- The region's digital transformation agenda, combined with rising international travel, creates sustained demand for innovative border control solutions. Looking ahead to 2030, Asia Pacific will consolidate its position as a global leader in border automation adoption.
- Emerging economies are rapidly catching up with developed markets, while established players expand their technological capabilities.
- Government initiatives, private sector investments, and cross-border collaboration frameworks will continue to fuel market expansion, making Asia Pacific the fastest-growing region for automated border control technologies..
Market Ecosystem
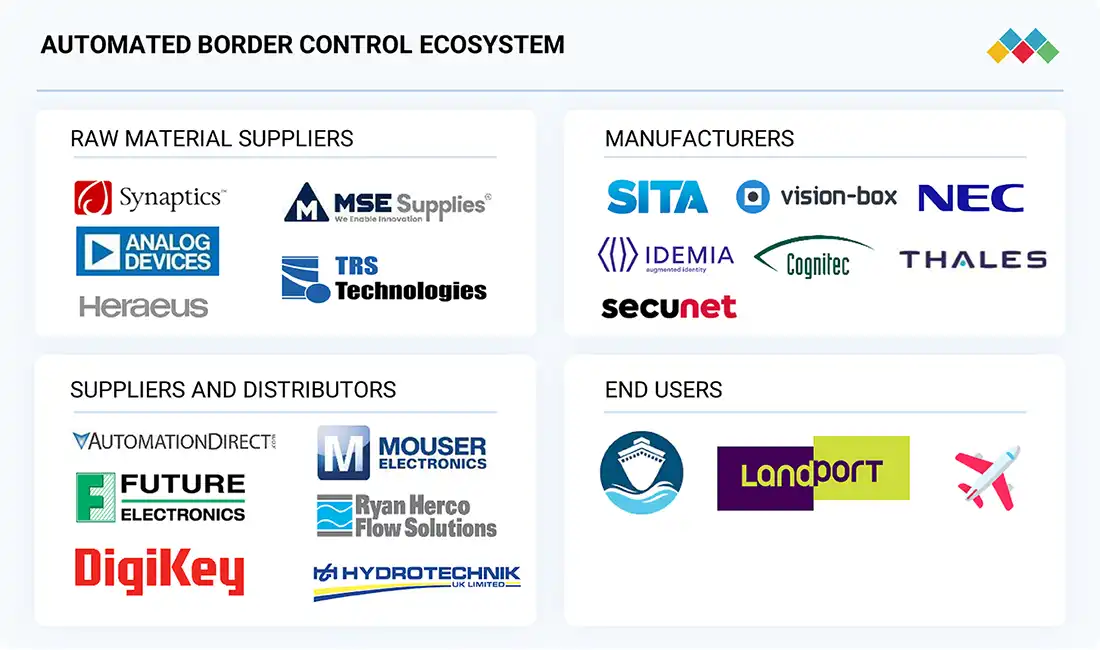
Automated Border Control Market: COMMERCIAL USE CASES ACROSS INDUSTRIES
| COMPANY | USE CASE DESCRIPTION | BENEFITS |
|---|---|---|
 |
ABC eGates and integrated border/visa management that connect to national border systems and perform on-the-fly biometric verification | Faster throughput, lower queue times as well as scalable/modular hardware footprint for constrained spaces |
 |
ABC eGate and kiosk portfolio for automated passport/border checks (sensor-rich eGates used in German/European airports) | Proven high security (anti-tailgating, robust sensors) and high throughput |
 |
Multi-modal ABC gates (face/fingerprint), centralized supervisor for kiosks/gates and entry/exit authorization with proven roll-outs | Multi-biometric verification, centralized monitoring, stronger identity assurance and exception handling |
 |
Biometric identity hub and self-service gates/kiosks plus mobile enrolment (face = boarding pass) to automate check-in → security → border → boarding flows | End-to-end passenger journey automation and mobile enrolment that reduces on-site friction and contact points |
 |
Biometric walkthrough gates and ABC solutions (high-accuracy face recognition, large-scale walkthrough deployments — integration partnerships, e.g., with SITA). Recent deployments in major Japanese airports | Very fast passenger processing, mature face recognition, and flexible integration |
Logos and trademarks shown above are the property of their respective owners. Their use here is for informational and illustrative purposes only.
Related Ecosystem
Airport Systems
- Antennas
- Sensors
- Aeronautical Information Management (AIM)
- Digital Signage
- Face Recognition
- SYSTRA LTD.
- Thales group
- Idaho Strategic Resources, Inc.
- HONEYWELL INTERNATIONAL INC.
- Leidos Holdings, Inc.
Application Security
- Cloud Security
- Security Analytics
- Network Testing
- Biometric Security and Authentication System
- Cloud Encryption
- International Business Machines Corporation
- MICROSOFT CORPORATION
- Cisco Systems, Inc.
- PALO ALTO NETWORKS, INC
- Fortinet, Inc.
Security And Surveillance
- Face Recognition
- Video Surveillance as A Service (VSaaS)
- Voice Recognition
- Fingerprint Recognition
- IRIS Recognition
- HONEYWELL INTERNATIONAL INC.
- Thales group
- HID-GLOBAL
- Lenovo
- AXIS COMMUNICATIONS
Key Takeaways
- Asia Pacific's automated border control market will more than double from $610.3M (2025) to $1,270.2M (2030), driven by regional digital transformation initiatives.
- Asia Pacific's 15.8% CAGR outpaces the global average, reflecting accelerated adoption of biometric and e-gate technologies across major travel hubs.
- Government investments in smart immigration infrastructure and rising international passenger volumes are primary growth catalysts for Asia Pacific.
- Asia Pacific's competitive ecosystem combines multinational semiconductor leaders with regional technology providers, intensifying innovation in automated border solutions.
Automated Border Control Market Report Scope
| Report Metric | Details |
|---|---|
| Base Year | 2025 |
| Fastest Growing Segment | BIOMETRIC VERIFICATION SYSTEM (Hardware Type) |
| Forecast Period | 2025-2030 |
| Growth Rate | CAGR of 14.4% from 2025 to 2030 |
| Largest Segment | ABC E-GATES (Solution Type) |
| Market Size Base Year (Billions) | ~USD 2.57 (2025) |
| Revenue Forecast (Billions) | ~USD 5.03 (2030) |
| Segments Covered | Solution Type, Application, Offering, Hardware Type, Biometric Verification System Type, Service Type, Solution |
Asia Pacific Automated Border Control Market Report Segmentation
7 segment dimensions are covered across the global market.
By Solution Type
- Abc E-Gates
- Abc Kiosks
By Application
- Airports
- Land Ports
- Seaports
By Offering
- Hardware
- Services
- Software
By Hardware Type
- Baggage Scanner
- Biometric Verification System
- Digital Id Verification System
- Document Authentication System
By Biometric Verification System Type
- Face Recognition System
- Fingerprint Recognition System
- Iris Recognition System
- Other Biometric Verification Systems
By Service Type
- Installation
- Maintenance
By Solution
- Abc E-Gates
- Abc Kiosks
Target Audience
- Border Control Technology Vendors : Manufacturers and solution providers need Asia Pacific market data to identify expansion opportunities, assess competitive intensity, and develop region-specific product roadmaps for automated border systems.
- Government & Immigration Authorities : Border agencies and immigration departments require market intelligence to benchmark infrastructure investments, evaluate technology solutions, and plan modernization budgets aligned with regional growth trends.
- Private Equity & Investment Firms : Investors targeting the border security and smart infrastructure sectors need Asia Pacific market analysis to identify acquisition targets, assess growth potential, and evaluate portfolio companies' regional positioning.
- System Integrators & Consultants : Integration firms and consulting companies need detailed Asia Pacific insights to advise clients on technology selection, implementation strategies, and market entry approaches for border automation projects.
- Airport & Port Operators : Transportation hub operators require market data to justify capital investments in automated border control systems, benchmark against peer facilities, and plan technology upgrades to enhance passenger experience.
Countries within Asia Pacific - compare and drill down
| Country | 2025 size (native) |
|---|---|
| China | USD 535.7 Million |
| Japan | USD 221.7 Million |
| India | USD 211.5 Million |
| South Korea | USD 104.7 Million |
| Australia | USD 83.4 Million |
| Indonesia | USD 52.4 Million |
| Malaysia | USD 32.6 Million |
| Thailand | USD 14.1 Million |
| Vietnam | USD 8.3 Million |
| Rest Of Asia Pacific | USD 5.6 Million |
Country market size visualization
Reasons to Buy this Report
- Regional Market Intelligence : Gain comprehensive insights into Asia Pacific's $610.3 million market with country-level breakdowns, competitive dynamics, and growth drivers specific to the region's unique border control landscape.
- Investment Opportunity Assessment : Identify high-growth markets within Asia Pacific with 15.8% CAGR potential. Evaluate emerging economies and established hubs to prioritize capital allocation and expansion strategies.
- Government Policy & Regulatory Trends : Understand Asia Pacific government initiatives driving border automation investments, including smart city programs, visa processing modernization, and security infrastructure upgrades across major economies.
- Competitive Positioning Strategy : Benchmark against regional competitors and identify market gaps in China, Japan, India, and Southeast Asia. Develop targeted go-to-market strategies for specific country segments.
- Technology Adoption Forecasts : Access detailed projections on biometric systems, AI integration, and e-gate deployment across Asia Pacific through 2030, enabling product development and partnership planning aligned with regional demand.
Frequently asked questions
What is the projected market size for automated border control in Asia Pacific by 2030?
Asia Pacific's automated border control market is projected to reach $1,270.2 million by 2030, up from $610.3 million in 2025, representing a 15.8% CAGR.
What are the primary drivers of growth in Asia Pacific's automated border control market?
Asia Pacific's growth is driven by increasing cross-border mobility, government investments in smart immigration systems, biometric technology adoption, and modernization of airport and port infrastructure.
How does Asia Pacific's growth rate compare to the global automated border control market?
Asia Pacific's 15.8% CAGR exceeds the global average of 14.4%, indicating the region is a faster-growing market segment within the automated border control industry.
Which technologies are most prevalent in Asia Pacific's automated border control deployments?
Facial recognition, iris scanning, e-gate systems, and biometric passenger processing technologies are the most widely deployed solutions across Asia Pacific's border control infrastructure.
What role do semiconductor companies play in Asia Pacific's automated border control market?
Semiconductor and electronics manufacturers provide critical components for biometric sensors, processing units, and integrated systems that power Asia Pacific's automated border control solutions.
RESEARCH METHODOLOGY
The research process for this study included systematic gathering, recording, and analysis of data about customers and companies operating in the automated border control market. This process involved the extensive use of secondary sources, directories, and databases (Factiva and Oanda) to identify and collect valuable information for the comprehensive, technical, market-oriented, and commercial study of the automated border control market.
In-depth interviews were conducted with primary respondents, including experts from core and related industries and preferred manufacturers, to obtain and verify critical qualitative and quantitative information and assess growth prospects. Key players in the automated border control market were identified through secondary research, and their market rankings were determined through primary and secondary research. This research included studying annual reports of top players and interviewing key industry experts, such as CEOs, directors, and marketing executives.
Secondary Research
Various sources were used in the secondary research process to identify and collect information important for this study. These include company annual reports, press releases, investor presentations, white papers, technology journals, certified publications, articles by recognized authors, directories, and databases.
Secondary research was mainly used to obtain key information about the industry’s value chain, the total pool of market players, the market classification according to industry trends to the bottom-most level, regional markets, and key developments from market and technology-oriented perspectives.
Primary Research
Primary research was also conducted to identify the segmentation types, key players, competitive landscape, and key market dynamics, such as drivers, restraints, opportunities, challenges, and industry trends, along with key strategies adopted by players operating in the automated border control market. Extensive qualitative and quantitative analyses were performed on the complete market engineering process to list key information and insights throughout the report.
Extensive primary research has been conducted after acquiring knowledge about the automated border control market scenarios through secondary research. Several primary interviews have been conducted with experts from the demand (application and region) and supply side (solution type) across four major geographic regions: North America, Europe, Asia Pacific, and RoW. Approximately 60% and 40% of the primary interviews were conducted from the supply and demand sides. These primary data have been collected through questionnaires, emails, and telephonic interviews.
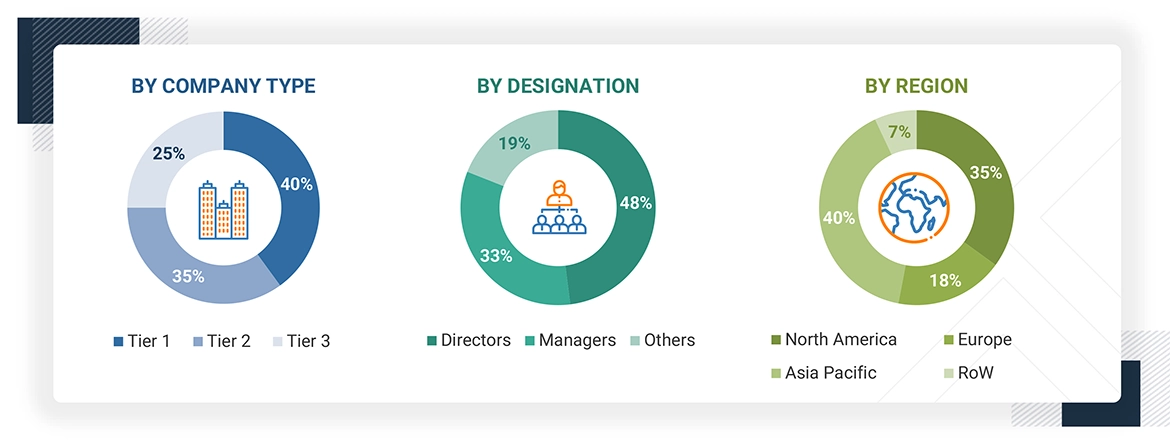
Note: The three tiers of the companies have been defined based on their total/segmental revenue as of 2024: Tier 1 = >USD 1 billion, Tier 2 = USD 1 billion–USD 500 million, and Tier 3 = USD 500 million. ‘Others’ include sales, marketing, and product managers.
To know about the assumptions considered for the study, download the pdf brochure
Market Size Estimation
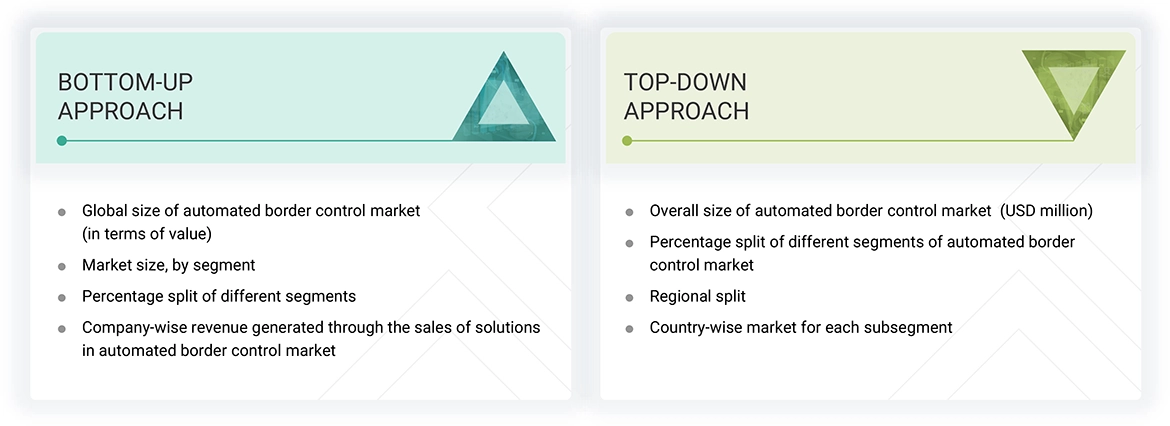
In the complete market engineering process, the top-down and bottom-up approaches and several data triangulation methods were implemented to estimate and validate the size of the automated border control market and various other dependent submarkets. Key players in the market were identified through secondary research, and their market share in the respective regions was determined through primary and secondary research. This entire research methodology included the study of annual and financial reports of the top players and interviews with experts (CEOs, VPs, directors, and marketing executives) for key insights (quantitative and qualitative).
All percentage shares, splits, and breakdowns were determined using secondary sources and verified through primary sources. All the possible parameters that affect the markets covered in this research study were accounted for, viewed in detail, verified through primary research, and analyzed to obtain the final quantitative and qualitative data. This data was consolidated and supplemented with detailed inputs and analysis from MarketsandMarkets and presented in this report.
Automated Border Control Market : Top-Down and Bottom-Up Approach
Data Triangulation
After arriving at the overall market size from the market size estimation process, as explained above, the total market has been split into several segments and subsegments. To complete the overall market engineering process and arrive at the exact statistics for all segments and subsegments, market breakdown and data triangulation procedures have been employed, wherever applicable. The data have been triangulated by studying various factors and trends from the demand and supply sides. Along with this, the market has been validated using top-down and bottom-up approaches.
Market Definition
The automated border control refers to the industry segment focused on deploying automated systems—eGates, biometric kiosks, facial recognition cameras, and document readers—to streamline and secure border crossing processes at airports, seaports, and land borders. These solutions verify traveler identities and authenticate documents with minimal human intervention, enhancing efficiency, reducing wait times, and strengthening security. The market includes hardware, software, and related services, such as installation and maintenance. Growing international travel, rising security concerns, and the push for contactless processing are key drivers of market expansion. Adoption is supported by government agencies and airport authorities worldwide, with initiatives such as ICAO’s TRIP and IATA’s One ID promoting standardization and interoperability.
Key Stakeholders
- Raw material and manufacturing equipment suppliers
- Automated border control hardware and software manufacturers
- Card readers and biometrics original equipment manufacturers (OEMs)
- ODM and OEM technology solution providers
- Suppliers and distributors
- System integrators
- Middleware providers
- Assembly, testing, and packaging vendors
- Research institutes and organizations
- Technology standards organizations, forums, alliances, and associations
- Technology investors
- Governments, financial institutions, and regulatory bodies
Report Objectives
- To define, describe, and forecast the automated border control market, by solution type, application, and component in terms of value
- To forecast the size of the market segments for four major regions—North America, Europe, Asia Pacific, and the Rest of the World (RoW), in terms of value
- To define, describe, and forecast the automated border control market, by solution type, in terms of volume
- To provide detailed information regarding the major drivers, restraints, opportunities, and challenges influencing the growth of the market
- To strategically analyze micromarkets with respect to individual growth trends, prospects, and contributions to the total market
- To study the complete value chain and allied industry segments, and perform a value chain analysis of the market
- To strategically profile the key players and comprehensively analyze their market shares and core competencies
- To analyze the opportunities in the market for stakeholders and describe the competitive landscape of the market
- To analyze competitive developments, such as collaborations, agreements, contracts, partnerships, mergers & acquisitions, product developments, and research & development (R&D), in the market
- To analyze the macroeconomic outlook for regions in the report
- To understand the impact of the 2025 US tariff and AI/Gen AI on the market
Available customizations:
With the given market data, MarketsandMarkets offers customizations according to the company’s specific needs. The following customization options are available for the report:
Get the Full Automated Border Control Market Report
Full forecast, segment splits, and company analysis for all Automated Border Control Market.
- US Automated Border Control Market
- Canada Automated Border Control Market
- Mexico Automated Border Control Market
- Germany Automated Border Control Market
- UK Automated Border Control Market
- France Automated Border Control Market
- Italy Automated Border Control Market
- Spain Automated Border Control Market
- Poland Automated Border Control Market
- China Automated Border Control Market
- Japan Automated Border Control Market
- South Korea Automated Border Control Market
- India Automated Border Control Market
- Indonesia Automated Border Control Market
- Australia Automated Border Control Market
- Malaysia Automated Border Control Market
- Thailand Automated Border Control Market
- Vietnam Automated Border Control Market
- Nordics Automated Border Control Market
- Rest Of Europe Automated Border Control Market
- Rest Of Asia Pacific Automated Border Control Market
Need a Tailored Report?
Customize this report to your needs
Get 10% FREE Customization
Customize This Report
