
Asia Pacific Building Twin Market (2024-2029)

The Asia Pacific Building Twin Market was valued at $459.7 Million in 2024 and projected to reach to $2936.7 Million by 2029, representing a compound annual growth rate of 44.9%. Asia Pacific's Building Twin Market is poised for transformative growth through 2029, driven by the region's position as the world's semiconductor manufacturing epicenter and accelerating digital transformation initiatives.


| Market Size in | USD 26.32 MN |
| Market Forecast in | |
| CAGR | |
| Forecast Period | |
| Units Considered | Value (USD MN) |
Asia Pacific Building Twin Market Trends and Insights
- Asia Pacific represents a critical hub for digital twin adoption in the semiconductor and electronics sectors, driven by rapid industrialization, smart city initiatives, and increasing investment in Industry 4.0 technologies.
- The region's dominance in electronics manufacturing and semiconductor production positions Asia Pacific as a primary growth engine for building twin solutions. Asia Pacific's 44.9% compound annual growth rate significantly outpaces global trends, reflecting strong demand from major economies including China, Japan, South Korea, and India.
- Asia Pacific's construction and real estate sectors are increasingly leveraging digital twin technology to optimize building performance, reduce operational costs, and enhance sustainability.
- By 2029, Asia Pacific is expected to capture a substantial share of the global building twin market, driven by government support for smart infrastructure and the region's technological advancement capabilities..
Key Market Statistics
- CAGR (2024-2029) 44.9% CAGR
- Market Size, 2024 ~USD 459.7 Million
- Forecast, 2029 ~USD 2936.7 Million
- Geography Asia Pacific
Asia Pacific Building Twin Market Overview
Rapid Market Expansion :
Asia Pacific's Building Twin Market is projected to grow from $459.7 million in 2024 to $2,936.7 million by 2029, representing a 44.9% CAGR and establishing the region as a global growth leader in digital twin adoption.
Smart City & Industry 4.0 Drivers :
The region's growth is fueled by aggressive smart city initiatives, rapid industrialization, and substantial investments in Industry 4.0 technologies across manufacturing and infrastructure sectors.
China's Market Dominance :
China leads Asia Pacific with a market size of $1,175.8 million, followed by Japan ($867.3 million) and India ($288.5 million), reflecting the region's concentration of semiconductor and electronics manufacturing.
Strategic Regional Hub :
Asia Pacific serves as a critical hub for digital twin innovation in semiconductors and electronics, positioning the region as essential for global technology companies and local manufacturers seeking competitive advantages.
Asia Pacific Building Twin Market Dynamics
- Government support for smart cities, coupled with increasing adoption of IoT and AI technologies, creates substantial opportunities for building twin solutions across manufacturing facilities, data centers, and urban infrastructure projects. The region's competitive landscape is intensifying as local players and global technology leaders invest heavily in Asia Pacific capabilities.
- Key growth catalysts include rising labor costs driving automation adoption, regulatory mandates for energy efficiency, and the need for real-time facility optimization.
- Companies targeting this market must develop region-specific solutions addressing unique challenges in supply chain complexity, regulatory environments, and infrastructure modernization across diverse economies..
Market Ecosystem
Related Ecosystem
Industrial Automation
- Sensors
- Image Sensors
- Manufacturing Execution System (MES)
- Actuators
- Flow Sensors
- Siemens ag
- ABB India Limited
- Emerson Electric Co.
- HONEYWELL INTERNATIONAL INC.
- SCHNEIDER ELECTRIC SE
Information System And Analytics
- Machine Learning
- Natural Language Processing (NLP)
- Sensors
- Software as A Service (SaaS)
- Data Loss Prevention (DLP)
- International Business Machines Corporation
- MICROSOFT CORPORATION
- Amazon.com, Inc.
- Oracle Corporation
Power Infrastructure
- Geographical Information System (GIS)
- Cogeneration
- Battery Electric Vehicle (BEV)
- Cellular Network
- Fuel Cell
- ABB India Limited
- Siemens ag
- SCHNEIDER ELECTRIC SE
- General Electric Company
- Eaton Corporation plc
Key Takeaways
- Asia Pacific Building Twin Market valued at $459.7M in 2024, expanding to $2,936.7M by 2029 at 44.9% CAGR
- Asia Pacific's rapid industrialization and smart city initiatives are primary catalysts for digital twin adoption across the region
- Asia Pacific's semiconductor and electronics manufacturing dominance creates significant demand for building twin solutions
- Asia Pacific governments' support for Industry 4.0 and smart infrastructure is accelerating market growth through 2029
Building Twin Market Report Scope
| Report Metric | Details |
|---|---|
| Base Year | 2024 |
| Fastest Growing Segment | SMALL & MEDIUM ENTERPRISES (Enterprise) |
| Forecast Period | 2024-2029 |
| Growth Rate | CAGR of 44.7% from 2024 to 2029 |
| Largest Segment | LARGE ENTERPRISES (Enterprise) |
| Market Size Base Year (Billions) | ~USD 2.1 (2024) |
| Revenue Forecast (Billions) | ~USD 13.3 (2029) |
| Segments Covered | Offering, End User, Application, Enterprise |
Asia Pacific Building Twin Market Report Segmentation
4 segment dimensions are covered across the global market.
By Offering
- Services
- Software Solutions
By End User
- Airport & Transportation Hubs
- Commercial
- Educational Institutions
- Hospitality Industry
- Hospitals
- Industrial
- Office Buildings
- Retail Space
By Application
- Energy Management
- Facility Management
- Predictive Maintenance
- Safety & Security Management
By Enterprise
- Large Enterprises
- Small & Medium Enterprises
Target Audience
- Semiconductor & Electronics Manufacturers : Manufacturers need Asia Pacific market intelligence to optimize facility operations, implement digital twins for production efficiency, and maintain competitive advantage in the region's high-growth manufacturing ecosystem.
- Digital Twin Technology Providers : Software and platform vendors require detailed market sizing and regional demand forecasts to prioritize product development, sales strategies, and localization efforts across Asia Pacific's diverse markets.
- Real Estate & Facility Management Companies : Property developers and facility managers need insights into building twin adoption trends to offer next-generation smart building solutions and capture growth opportunities in Asia Pacific's infrastructure modernization.
- Investment & Private Equity Firms : Investors evaluating opportunities in digital twin, IoT, and smart city sectors require comprehensive Asia Pacific market data to assess portfolio companies, identify acquisition targets, and evaluate regional growth potential.
- Government & Urban Planning Agencies : Public sector organizations need market intelligence on building twin technologies and adoption rates to inform smart city policies, infrastructure investments, and digital transformation initiatives across Asia Pacific.
Countries within Asia Pacific - compare and drill down
| Country | 2025 size (native) |
|---|---|
| China | USD 1175.8 Million |
| Japan | USD 867.3 Million |
| India | USD 288.5 Million |
| South Korea | USD 252.2 Million |
| Rest Of Asia Pacific | USD 352.9 Million |
Country market size visualization
Reasons to Buy this Report
- Regional Market Sizing & Forecasts : Obtain precise market valuations for Asia Pacific and individual countries (China, Japan, India, South Korea) with detailed 5-year forecasts to support strategic planning and investment decisions.
- Competitive Landscape Intelligence : Understand market dynamics, key players, and competitive positioning specific to Asia Pacific's semiconductor and electronics sectors to identify partnership and acquisition opportunities.
- Growth Driver Analysis : Access in-depth insights into region-specific growth catalysts including smart city initiatives, Industry 4.0 adoption rates, and regulatory drivers shaping market expansion across Asia Pacific.
- Country-Level Market Breakdown : Leverage granular market data for China, Japan, India, South Korea, and Rest of Asia Pacific to tailor go-to-market strategies and prioritize resource allocation by geography.
- Investment & Expansion Strategy : Make informed decisions on market entry, facility location, and technology development priorities based on comprehensive Asia Pacific market analysis and growth projections through 2029.
Frequently asked questions
What is the current size of the Asia Pacific Building Twin Market?
The Asia Pacific Building Twin Market was valued at $459.7 million in 2024 and is projected to reach $2,936.7 million by 2029.
What is the growth rate for Asia Pacific Building Twin Market?
Asia Pacific Building Twin Market is expected to grow at a compound annual growth rate (CAGR) of 44.9% from 2024 to 2029.
Which countries drive the Asia Pacific Building Twin Market?
Major economies including China, Japan, South Korea, and India are the primary drivers of growth in the Asia Pacific Building Twin Market.
What factors are accelerating Asia Pacific Building Twin Market growth?
Rapid industrialization, smart city initiatives, Industry 4.0 investments, government support for smart infrastructure, and the region's semiconductor manufacturing dominance are key growth factors in Asia Pacific.
How does Asia Pacific Building Twin Market compare to global growth?
Asia Pacific's 44.9% CAGR outpaces the global Building Twin Market CAGR of 44.7%, positioning the region as a primary growth engine.
RESEARCH METHODOLOGY
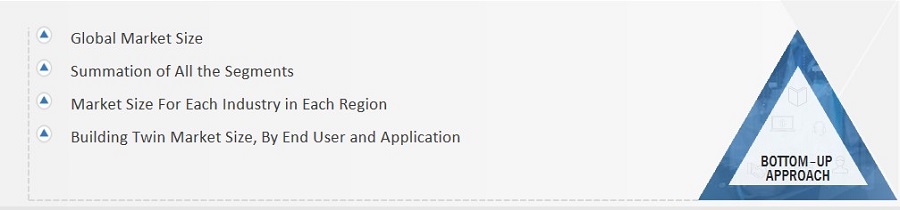
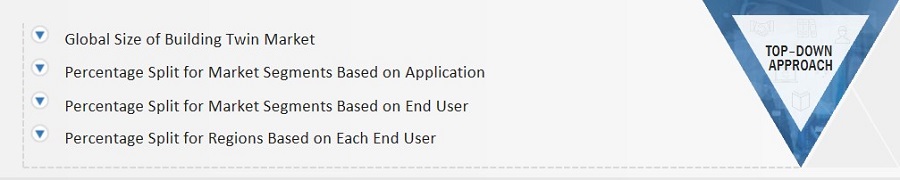
The study involves four major activities for estimating the size of the building twin market. Exhaustive secondary research has been conducted to collect information related to the market. The next step has been validating these findings, assumptions, and sizing with the industry experts across the value chain through primary research. Both top-down and bottom-up approaches have been employed to estimate the overall size of the building twin market. After that, market breakdown and data triangulation procedures have been used to determine the extent of different segments and subsegments of the market.
Secondary Research
Secondary sources in this research study include corporate filings (such as annual reports, investor presentations, and financial statements); trade, business, and professional associations; white papers, certified publications, articles from recognized authors; directories; and databases. The secondary data has been collected and analyzed to determine the overall market size estimations, further validated by primary research.
Primary Research
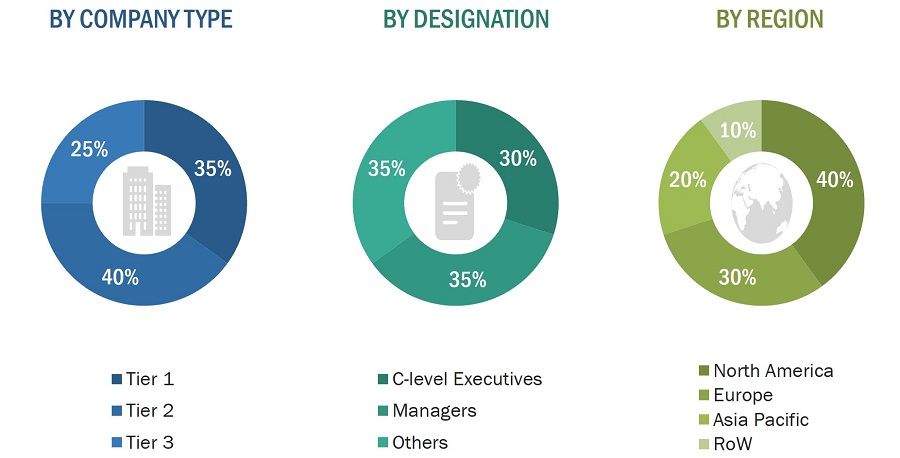
In the primary research process, several sources from both supply and demand sides were interviewed to obtain qualitative and quantitative information about this report. Several primary interviews have been conducted with market experts from both demand and supply sides across four major regions—North America, Europe, Asia Pacific, and the Rest of the World. This primary data has been collected through questionnaires, emails, and telephonic interviews. Approximately 60% of the primary interviews have been conducted with the demand side and 40% with the supply side. This primary data has been collected mainly through telephonic interviews, which accounted for 80% of the total primary interviews. Additionally, questionnaires and emails were used to collect the data.
To know about the assumptions considered for the study, download the pdf brochure
Market Size Estimation
In the complete market engineering process, both top-down and bottom-up approaches have been implemented, along with several data triangulation methods, to estimate and validate the size of the building twin market and other dependent submarkets listed in this report.
- The key players in the industry and markets have been identified through extensive secondary research.
- Both the supply chain of the industry and the market size, in terms of value, have been determined through primary and secondary research.
- All percentage shares, splits, and breakdowns have been determined using secondary sources and verified through primary sources.
Global Building Twin Market Size: Bottom-Up Approach
Global Building Twin Market Size: Top-Down Approach
Data Triangulation
After arriving at the overall market size, the total market has been split into several segments. To complete the overall market engineering process and arrive at exact statistics for all segments, the market breakdown and data triangulation procedures have been employed wherever applicable. The data has been triangulated by studying various factors and trends from both the demand and supply sides. The market has also been validated using both top-down and bottom-up approaches.
Market Definition
Building twin, or digital twin for buildings, is a virtual representation of a physical building or facility that integrates real-time data from sensors, IoT devices, and other sources. This digital replica enables comprehensive monitoring, analysis, and management of the building's operations and performance throughout its lifecycle. Building twin technology allows stakeholders such as facility managers, engineers, and designers to simulate scenarios, optimize energy usage, predict maintenance needs, and enhance operational efficiency. By leveraging advanced analytics and simulation capabilities, building twins support informed decision-making, improve sustainability efforts, and streamline building management practices effectively.
Key Stakeholders
- Government bodies and policymakers
- Industry organizations, forums, alliances, and associations
- Market research and consulting firms
- Raw material suppliers and distributors
- Research institutes and organizations
- Analysts and strategic business planners
- End users of building twins
Study Objectives:
- To define, describe, and forecast the building twin market size by offering, application, and end user, in terms of value
- To describe and forecast the size of the building twin market across four regions, namely, North America, Europe, Asia Pacific, and the Rest of the World, along with their respective country-level market sizes, in terms of value
- To provide detailed information regarding the drivers, restraints, opportunities, and challenges influencing the market growth
- To provide a detailed overview of the process flow of the building twin market
- To strategically analyze micromarkets1 for individual growth trends, prospects, and contributions to the overall market size
- To study the complete value chain of the building twin market
- To analyze opportunities for stakeholders by identifying high-growth segments of the building twin market
- To strategically profile the key players and comprehensively analyze their market positions in terms of their ranking and core competencies2
- To analyze competitive developments, such as product launches, deals (mergers, acquisitions, partnerships, collaborations, agreements, contracts, and investments), and others (expansions) in the building twin market
Available Customizations
With the given market data, MarketsandMarkets offers customizations according to the specific requirements of companies. The following customization options are available for the report:
Product Analysis
- Product matrix that gives a detailed comparison of the product portfolio of each company
Company Information
- Detailed analysis and profiling of 25 market players
Get the Full Building Twin Market Report
Full forecast, segment splits, and company analysis for all Building Twin Market.
- US Building Twin Market
- Canada Building Twin Market
- Mexico Building Twin Market
- Germany Building Twin Market
- UK Building Twin Market
- France Building Twin Market
- Rest Of Europe Building Twin Market
- China Building Twin Market
- Japan Building Twin Market
- India Building Twin Market
- South Korea Building Twin Market
- Rest Of Asia Pacific Building Twin Market
- GCC Building Twin Market
- Rest Of The Middle East Building Twin Market
Need a Tailored Report?
Customize this report to your needs
Get 10% FREE Customization
Customize This Report
