
North America Bus Duct Market (2024-2029)

The North America Bus Duct Market was valued at $2421.6 Million in 2024 and projected to reach to $3075.9 Million by 2029, representing a compound annual growth rate of 4.9%. North America's bus duct market is poised for steady growth through 2029, supported by ongoing modernization of electrical infrastructure across the region.


| Market Size in | USD 26.32 MN |
| Market Forecast in | |
| CAGR | |
| Forecast Period | |
| Units Considered | Value (USD MN) |
North America Bus Duct Market Trends and Insights
- North America's bus duct sector is driven by modernization of electrical infrastructure, increased demand for energy-efficient power distribution systems, and expansion of data centers across the region.
- The market in North America reflects strong industrial activity and stringent electrical safety standards that favor advanced bus duct solutions over traditional cable systems. Growth in North America is supported by rising investments in renewable energy integration, smart grid initiatives, and commercial construction projects requiring reliable power distribution.
- North America's manufacturing and commercial sectors continue to adopt bus duct technology for its space-saving benefits and superior thermal performance.
- Between 2024 and 2029, North America is expected to see sustained demand from utilities, industrial facilities, and emerging technology hubs seeking cost-effective and sustainable electrical infrastructure solutions..
Key Market Statistics
- CAGR (2024-2029) 4.9% CAGR
- Market Size, 2024 ~USD 2421.6 Million
- Forecast, 2029 ~USD 3075.9 Million
- Geography North America
North America Bus Duct Market Overview
Infrastructure Modernization Drive :
North America is experiencing significant electrical infrastructure upgrades, with utilities and industrial facilities investing in modern bus duct systems to replace aging power distribution networks and improve system reliability.
Data Center Expansion Boom :
Rapid growth of data centers across the US, Canada, and Mexico is driving substantial demand for efficient power distribution solutions, with bus ducts becoming essential for managing high-density electrical loads in these facilities.
Energy Efficiency Regulations :
Stringent energy efficiency standards and building codes in North America are compelling commercial and industrial sectors to adopt advanced bus duct systems that reduce energy losses and operational costs.
Steady Regional Growth :
The North America bus duct market is projected to grow from $2,421.6 million in 2024 to $3,075.9 million by 2029, representing a 4.9% CAGR, driven by sustained infrastructure investment and industrial expansion.
North America Bus Duct Market Dynamics
- The US dominates the market with the largest share, while Canada and Mexico contribute significantly to regional expansion.
- Key drivers include the proliferation of data centers, renewable energy integration projects, and compliance with evolving energy efficiency standards. The market will benefit from increased capital expenditure in industrial facilities, commercial real estate development, and smart grid initiatives.
- North American manufacturers are focusing on innovation in compact, modular bus duct designs to meet evolving customer requirements.
- Strategic investments in manufacturing capabilities and supply chain resilience will be critical for market participants to capitalize on the projected growth trajectory through 2029..
Market Ecosystem
BUS DUCT MARKET: COMMERCIAL USE CASES ACROSS INDUSTRIES
| COMPANY | USE CASE DESCRIPTION | BENEFITS |
|---|---|---|
 |
ABB supplied busway connections to interconnect four indoor power skids at a hyperscale data center, integrating switchboards, UPS modules, automatic transfer switches, and battery cabinets to support modular power distribution. | Enabled the integration of prefabricated power skids and their electrical equipment, supporting modular installation and scalable power distribution for data center operations |
 |
AP Sensing and STS Group retrofitted continuous fiber-optic temperature monitoring onto an existing 2,000 A Schneider Electric busway system at a major US-based cloud computing provider's data center in Frankfurt, Germany, to detect potential overheating across connections between switch rooms and the data hall. | Enabled 24/7 temperature monitoring, hotspot localization to within approximately one meter, and automatic alarms to the facility monitoring system. This improved early fault detection and supported proactive maintenance without relying solely on periodic thermal inspections |
Logos and trademarks shown above are the property of their respective owners. Their use here is for informational and illustrative purposes only.
Related Ecosystem
Power Infrastructure
- Geographical Information System (GIS)
- Cogeneration
- Battery Electric Vehicle (BEV)
- Cellular Network
- Fuel Cell
- Siemens ag
- ABB India Limited
- SCHNEIDER ELECTRIC SE
- General Electric Company
- Eaton Corporation plc
Key Takeaways
- North America's bus duct market is valued at $2,421.6 million in 2024 and will reach $3,075.9 million by 2029 at a 4.9% CAGR.
- North America's market growth is driven by infrastructure modernization, data center expansion, and renewable energy integration initiatives.
- North America benefits from strict electrical safety regulations that encourage adoption of advanced bus duct systems over traditional alternatives.
- North America's industrial and commercial sectors are increasingly investing in energy-efficient power distribution solutions through 2029.
Bus Duct Market Report Scope
| Report Metric | Details |
|---|---|
| Base Year | 2024 |
| Fastest Growing Segment | DATA CENTERS (End User) |
| Forecast Period | 2024–2029 |
| Growth Rate | CAGR of 5.2% from 2024 to 2029 |
| Largest Segment | COPPER (Material) |
| Market Size Base Year (Billions) | ~USD 12.88 (2024) |
| Revenue Forecast (Billions) | ~USD 16.6 (2029) |
| Segments Covered | Voltage, Material, Type, End User |
North America Bus Duct Market Report Segmentation
4 segment dimensions are covered across the global market.
By Voltage
- High
- High (Above 35 Kv)
- Low
- Low (Up To 1 Kv)
- Medium
- Medium (1–35 Kv)
- Medium (1-35 Kv)
By Material
- Aluminum
- Copper
By Type
- Isolated
- Isolated Bus Ducts
- Non-Segregated
- Non-Segregated Bus Ducts
- Segregated
- Segregated Bus Ducts
By End User
- Commercial
- Data Centers
- Industrial
- Other End Users
- Renewables
- Utilities
Target Audience
- Electrical Equipment Manufacturers : Manufacturers need North America-specific market data to optimize production capacity, develop region-tailored products, and identify partnership opportunities with utilities and industrial customers.
- Infrastructure & Utility Companies : Utilities and grid operators require detailed market insights to plan capital expenditures for infrastructure modernization, evaluate supplier options, and align investments with regional growth trends.
- Data Center Operators & Developers : Data center companies need market intelligence on power distribution solutions to ensure reliable, efficient operations and make informed procurement decisions for new facility deployments across North America.
- Commercial & Industrial Contractors : Contractors and system integrators require North America market data to advise clients on bus duct solutions, stay competitive, and identify emerging project opportunities in modernization initiatives.
- Investment & Consulting Firms : Investors and consultants need comprehensive North America market analysis to evaluate industry opportunities, assess company valuations, and develop strategic recommendations for clients in the energy sector.
Key Companies in the North America Bus Duct Market
| Company | HQ | Ownership | Strongest segments |
|---|---|---|---|
| ABB | Switzerland | Public Company | Electrification,Motion,Automation, |
| SCHNEIDER ELECTRIC | France | Public Company | Low- and Medium-Voltage Electrical Products and Systems,Building Management, Power Metering, and Smart Controls,Industrial Automation, Drives, and Digital Energy Software, |
| SIEMENS | Germany | Public Company | Digital Industries (automation, PLM, simulation),Smart Infrastructure (electrification, buildings, grid),Mobility (rail, automation, services), |
| EATON | Ireland | Public Company | Electrical distribution, protection, and assemblies,Power quality, reliability, and connectivity,Residential and wiring devices, |
| LEGRAND | France | Public Company | Wiring devices and installation accessories,Energy distribution, protection, and management,Building control, connected home, and guestroom solutions, |
| GENERAL ELECTRIC COMPANY | United States | Public Company | Commercial Engines & Services,Defense & Propulsion Technologies,Additive, Components, and Other Systems, |
| VERTIV GROUP CORP. | United States | Private Company | Liquid and advanced thermal management integrated with racks/enclosures,Power distribution and backup tied to immersion deployments,Monitoring, control, and IT management platforms, |
| LS CABLE & SYSTEM LTD. | South Korea | Private Company | Energy cables (extra-high voltage, submarine, overhead, distribution, bus ducts),Telecommunication cables (optical, structured cabling, RF feeder),Industrial cables and harnesses (specialty, devices, automotive, modules, tubes), |
| POWELL INDUSTRIES | United States | Public Company | Integrated power control room substations, electrical houses, and custom-engineered modules,Traditional and arc-resistant distribution switchgear and control gear,Monitoring and control communications systems, motor control centers, switches, and bus duct systems, |
| NISSIN ELECTRIC CO., LTD. | Japan | Private Company | Power Supply and Environment System,Beam and Plasma,Equipment and Parts Solution, |
ABB
ABB is a Swiss multinational public company founded in 1883 with 111,900 employees. The company operates in electrification, industrial automation, and robotics sectors.
SCHNEIDER ELECTRIC
Schneider Electric is a French multinational public company established in 1836 with 158,122 employees. It specializes in energy management and industrial automation solutions.
SIEMENS
Siemens is a German multinational public company founded in 1847 with 310,312 employees. The company operates across electrification, automation, and digitalization sectors.
EATON
Eaton is a public company incorporated in Ireland, founded in 1911 with 97,303 employees. It provides electrical, hydraulic, and mechanical power management solutions.
LEGRAND
Legrand is a French multinational public company established in 1865 with 35,410 employees. The company specializes in electrical and digital building infrastructure.
GENERAL ELECTRIC COMPANY
General Electric Company is a United States-based public company founded in 1892 with 57,000 employees. It operates across power, renewable energy, aviation, and healthcare sectors.
VERTIV GROUP CORP.
Vertiv Group Corp. is a United States-based private company founded in 1965 with 19,000 employees. The company provides critical infrastructure and continuity solutions.
LS CABLE & SYSTEM LTD.
LS Cable & System Ltd. is a South Korean private company established in 1962 with 2,002 employees. It manufactures cables and related electrical systems.
POWELL INDUSTRIES
Powell Industries is a United States-based public company founded in 1947 with 3,143 employees. The company manufactures electrical equipment and systems.
NISSIN ELECTRIC CO., LTD.
Nissin Electric Co., Ltd. is a Japanese private company founded in 1910 with 5,382 employees. The company manufactures electrical equipment and systems.
Countries within North America - compare and drill down
| Country | 2025 size (native) |
|---|---|
| US | USD 2480.8 Million |
| Canada | USD 379.2 Million |
| Mexico | USD 215.9 Million |
Country market size visualization
Reasons to Buy this Report
- Market Size & Growth Projections : Access detailed forecasts showing North America's bus duct market expanding from $2,421.6M to $3,075.9M by 2029, enabling informed investment and expansion decisions across the region.
- Country-Level Insights : Gain granular market data for the US, Canada, and Mexico, allowing you to identify high-opportunity markets and tailor strategies to regional economic conditions and regulatory environments.
- Competitive Landscape Analysis : Understand key drivers specific to North America including data center growth, infrastructure modernization, and energy efficiency mandates to benchmark against competitors and identify market gaps.
- Sector-Specific Opportunities : Identify growth segments within North America's industrial, commercial, and utility sectors, enabling targeted product development and go-to-market strategies for maximum ROI.
- Strategic Planning & Risk Mitigation : Leverage North America-specific market intelligence to develop robust business strategies, assess regulatory risks, and capitalize on emerging opportunities in this mature yet growing market.
Frequently asked questions
What is the current size of the North America bus duct market?
The North America bus duct market is valued at $2,421.6 million in 2024.
What is the projected market size for North America by 2029?
North America's bus duct market is projected to reach $3,075.9 million by 2029.
What is the growth rate for the North America bus duct market?
North America's bus duct market is expected to grow at a compound annual growth rate of 4.9% from 2024 to 2029.
What factors are driving growth in North America's bus duct market?
North America's market growth is driven by infrastructure modernization, data center expansion, renewable energy integration, smart grid initiatives, and commercial construction projects.
Why is North America adopting bus duct technology?
North America is adopting bus duct technology for its space-saving benefits, superior thermal performance, energy efficiency, and compliance with stringent electrical safety standards.
RESEARCH METHODOLOGY
The research process for this technical, market-oriented, and commercial study of the bus duct market involved systematic collection, validation, and analysis of information related to electrical power distribution infrastructure, including product types, current ratings, voltage levels, conductor materials, end users, and regional developments. Extensive secondary research was conducted using annual reports, investor presentations, technical papers, industry publications, company websites, product catalogs, and financial reports to identify key market participants, product innovations, technology trends, market developments, and competitive strategies. The findings were further validated through primary interviews with executives from bus duct manufacturers, electrical component suppliers, EPC companies, distributors, and industry experts to assess market estimates, product adoption, pricing trends, customer requirements, and competitive positioning. Key market players and their competitive positions were established through a combination of secondary research and primary research involving senior executives, business development managers, product specialists, procurement professionals, and technical experts across the electrical distribution ecosystem.
Secondary Research
In the secondary research process, various sources were reviewed to identify and collect information relevant to the bus duct market. Secondary sources included annual reports, investor presentations, press releases, company websites, technical documents, product catalogs, and industry publications. Information from organizations such as the International Energy Agency (IEA), government energy departments, and electrical safety and standards bodies was examined to understand electricity infrastructure investments, data center expansion, industrial electrification, and power distribution developments. Secondary research focused on market size, key participants, product portfolios, current ratings, voltage specifications, conductor materials, manufacturing capabilities, pricing trends, end-user demand, and regional market developments.
Primary Research
During the primary research phase, bus duct manufacturers, electrical component suppliers, distributors, EPC contractors, procurement specialists, and industry experts were considered for qualitative and quantitative insights into the global bus duct market. Interviews were used to validate market estimates, product adoption, pricing trends, regional demand, competitive positioning, customer requirements, and technological developments. Primary research also helped assess demand across different current ratings, voltage levels, conductor materials, product types, and end users, including data centers, commercial buildings, industrial facilities, utilities, and renewable energy plants. Findings were cross-validated against company disclosures, product specifications, industry statistics, and technical documentation to refine market estimates, segment shares, regional forecasts, and competitive assessments.
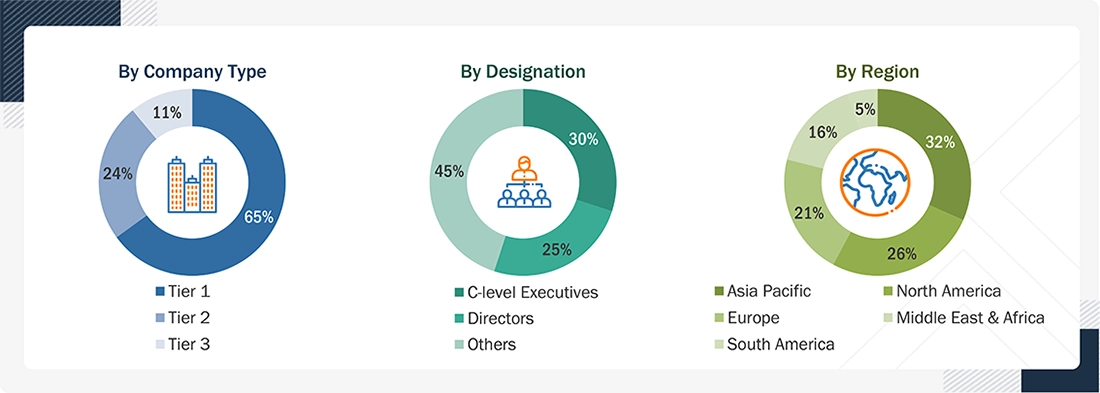
Note: Other designations include sales managers, engineers, and regional managers.
Tier 1 Company Revenue: >USD 5 billion, Tier 2 Company Revenue: between USD 1 and USD 5 billion, and Tier 3 Company Revenue: <USD 1 billion.
To know about the assumptions considered for the study, download the pdf brochure
Market Size Estimation
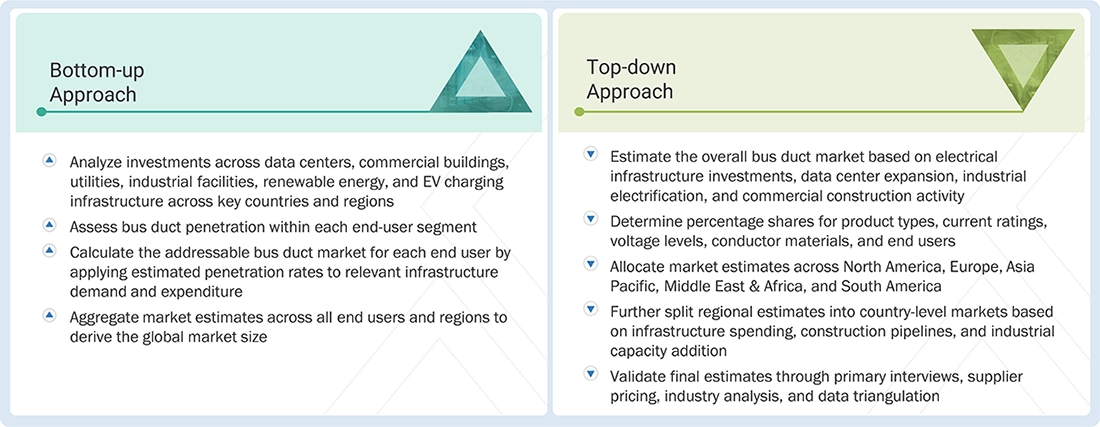
Both top-down and bottom-up approaches were used to estimate and validate the bus duct market and its dependent submarkets. Key market players were identified through secondary research, with their market shares assessed using primary and secondary sources. The research methodology includes reviewing annual reports, financial disclosures, product portfolios, and interviews with industry experts, including OEM executives, distributors, EPC contractors, and procurement managers, to obtain quantitative and qualitative insights into the global bus duct market.
Bottom-up Approach
- Analyze investments and infrastructure developments across key end-user segments, including data centers, commercial buildings, utilities, industrial facilities, renewable energy plants, and EV charging infrastructure, across major countries and regions.
- Estimate bus duct penetration within each end-user segment based on electrical infrastructure requirements, application suitability, project specifications, and industry adoption trends.
- Calculate the addressable bus duct market for each end-user segment by applying estimated penetration rates to relevant infrastructure demand and expenditure.
- Aggregate the estimated market sizes across all end-user segments and regions to derive the global bus duct market size.
- Segment the market by type, current rating, voltage, conductor material, end user, and region, considering product specifications, installation requirements, and regional demand patterns.
- Validate market estimates using OEM pricing, supplier data, project-level cost benchmarks, and primary research to ensure consistency and avoid double counting.
Top-down Approach
- Estimate the overall global bus duct market size based on electrical infrastructure investments, construction activity, industrial electrification, data center expansion, and power distribution infrastructure development
- Determine the percentage share of each market segment, including conductor material, voltage, current rating, product type, and end user, based on industry adoption patterns, product portfolios, supplier data, and primary research
- Allocate the global market size across the five regions: North America, Europe, Asia Pacific, Middle East & Africa, and South America, based on regional infrastructure investments, manufacturing activity, construction trends, and electricity demand
- Further distribute regional market estimates across key countries based on country-level infrastructure development, industrial capacity additions, data center expansion, and investments in electrical distribution systems
- Validate the final market estimates through primary interviews with bus duct manufacturers, suppliers, distributors, EPC contractors, and end users, followed by data triangulation to ensure consistency and accuracy
Global Bus Duct Market: Bottom-up Approach and Top-down Approach
Data Triangulation
The process of determining the global bus duct market size involved applying the previously established market-sizing methodologies, followed by segmenting the market across type, current rating, voltage, material, end user, and region. To establish comprehensive market estimates, data triangulation and market breakdown procedures were applied by cross-verifying demand and supply indicators, including electrical infrastructure investments, data center capacity expansion, industrial electrification, manufacturing facility upgrades, copper and aluminum consumption, busway product specifications, and regional installation requirements.
Market Definition
Bus ducts are engineered electrical distribution systems designed to safely transmit and distribute high-current electricity from power sources to downstream equipment. The systems typically comprise conductive busbars housed within protective enclosures, insulation, joints, and associated fittings. Depending on the application and installation requirements, bus ducts may be designed as isolated-phase, segregated-phase, or non-segregated systems for reliable power distribution across industrial, commercial, utility, and data center facilities. The bus duct market comprises the aggregate revenue generated by manufacturers and suppliers from the sale of bus ducts designed for electrical power distribution applications.
The study includes bus ducts across different materials, types, voltages, current ratings, and end users. The market covers North America, Europe, Asia Pacific, Middle East & Africa, and South America.
Key Stakeholders
- Bus duct and busbar system manufacturers
- Electrical equipment manufacturers and switchgear suppliers
- EPC contractors and electrical engineering companies
- Power generation companies and utility operators
- Data center developers and operators
- Industrial and manufacturing facility owners
- Commercial building developers and facility managers
- Renewable energy project developers and operators
- Electrical contractors and system integrators
- Transformer, switchgear, and power distribution equipment suppliers
- Electrical consultants and infrastructure designers
- Electrical testing, commissioning, and maintenance service providers
- Electrical standards organizations and regulatory authorities
Report Objectives
- To describe, segment, and forecast the global bus duct market by material, type, voltage, current rating, end user, and region, in terms of value
- To forecast the market size across five key regions: North America, Europe, Asia Pacific, South America, and the Middle East & Africa, along with country-level analysis, in terms of value and volume
- To provide the average selling price of bus duct by region, from 2023 to 2025
- To provide detailed information about the key drivers, restraints, opportunities, and industry-specific challenges influencing the growth of the bus duct market.
- To strategically analyze the global bus duct market with respect to individual growth trends, prospects, and contributions of each segment to the market
- To provide value chain analysis, trends/disruptions impacting customer business, market maps, ecosystem analysis, sustainability and regulatory landscape, pricing analysis, patent analysis, case study analysis, technology analysis, key conferences and events, Porter’s five forces analysis, macroeconomic outlook, customer landscape and buyer behavior, regulatory analysis, and AI/Gen AI impact on the market
- To analyze opportunities for stakeholders in the global bus duct market and draw a competitive landscape for market players
- To benchmark players within the market using the company evaluation matrix, which analyzes market players based on several parameters within the broad categories of business and product strategies
- To compare the key market players with respect to the market share, product specifications, and applications
- To strategically profile the key players and comprehensively analyze their market ranking and core competencies.
- To analyze competitive developments in the global bus duct market, such as expansions, product launches, partnerships, acquisitions and collaborations.
Available customizations:
With the given market data, MarketsandMarkets offers customizations based on the company’s specific needs. The following customization options are available for the report:
PRODUCT ANALYSIS
- Product Matrix, which provides a detailed comparison of the product portfolio of each company
COMPANY INFORMATION
- Detailed analyses and profiling of additional market players (up to 5)
Get the Full Bus Duct Market Report
Full forecast, segment splits, and company analysis for all Bus Duct Market.
- Canada Bus Duct Market
- Mexico Bus Duct Market
- US Bus Duct Market
- China Bus Duct Market
- India Bus Duct Market
- Japan Bus Duct Market
- South Korea Bus Duct Market
- Germany Bus Duct Market
- UK Bus Duct Market
- Italy Bus Duct Market
- France Bus Duct Market
- Brazil Bus Duct Market
- Argentina Bus Duct Market
- Saudi Arabia Bus Duct Market
- UAE Bus Duct Market
- South Africa Bus Duct Market
- Rest Of Europe Bus Duct Market
- Rest Of Asia Pacific Bus Duct Market
- GCC Countries Bus Duct Market
- Rest Of South America Bus Duct Market
- Rest Of GCC Countries Bus Duct Market
Need a Tailored Report?
Customize this report to your needs
Get 10% FREE Customization
Customize This Report