
Asia Pacific Captive Portal Market (2026-2031)

The Asia Pacific Captive Portal Market was valued at $291.1 Million in 2026 and projected to reach to $665.6 Million by 2031, representing a compound annual growth rate of 14.8%. The Asia Pacific captive portal market is poised for exceptional growth through 2031, driven by rapid urbanization, increasing smartphone penetration, and widespread adoption of guest network solutions across hospitality, retail, and enterprise sectors.


| Market Size in | USD 26.32 MN |
| Market Forecast in | |
| CAGR | |
| Forecast Period | |
| Units Considered | Value (USD MN) |
Asia Pacific Captive Portal Market Trends and Insights
- Asia Pacific's 14.8% compound annual growth rate outpaces global trends, driven by rapid digital transformation, increasing public Wi-Fi deployment, and heightened demand for guest network authentication across hospitality and retail sectors.
- The region's expanding middle class and smartphone penetration are accelerating adoption of captive portal solutions among enterprises and service providers. Asia Pacific's market growth is fueled by regulatory compliance requirements, rising cybersecurity awareness, and the proliferation of connected devices in urban centers.
- Between 2026 and 2031, Asia Pacific is expected to capture significant market share as telecommunications operators and venue owners invest in seamless user experience and network security.
- The region's competitive landscape features both established global vendors and emerging local players capitalizing on cost-sensitive markets and customized deployment models tailored to Asia Pacific's diverse regulatory environments..
Key Market Statistics
- CAGR (2026-2031) 14.8% CAGR
- Market Size, 2026 ~USD 291.1 Million
- Forecast, 2031 ~USD 665.6 Million
- Geography Asia Pacific
Asia Pacific Captive Portal Market Overview
Regional Growth Acceleration :
Asia Pacific's captive portal market is expanding at 14.8% CAGR, significantly outpacing the global growth rate of 13.4%, reflecting the region's accelerated digital transformation and infrastructure investments.
Hospitality & Retail Dominance :
Hotels, shopping malls, and retail establishments across Asia Pacific are rapidly deploying captive portals for guest authentication and network management, driving substantial market demand in these high-traffic sectors.
Public Wi-Fi Expansion :
Governments and telecom operators throughout Asia Pacific are expanding public Wi-Fi networks in urban centers, transportation hubs, and commercial zones, creating critical demand for captive portal solutions.
Market Valuation Trajectory :
The Asia Pacific captive portal market is valued at USD 291.1 million in 2026 and is projected to more than double to USD 665.6 million by 2031, representing substantial investment opportunities.
Asia Pacific Captive Portal Market Dynamics
- Countries like China, India, and Japan are leading this expansion through aggressive digital infrastructure development and rising consumer expectations for seamless connectivity experiences. Key growth catalysts include government initiatives promoting digital connectivity, expansion of 5G networks requiring complementary Wi-Fi solutions, and heightened focus on data security and user authentication.
- The region's diverse economic landscape presents opportunities across both developed markets like Australia and emerging economies, with enterprises increasingly recognizing captive portals as essential tools for customer engagement, analytics, and network security..
Market Ecosystem
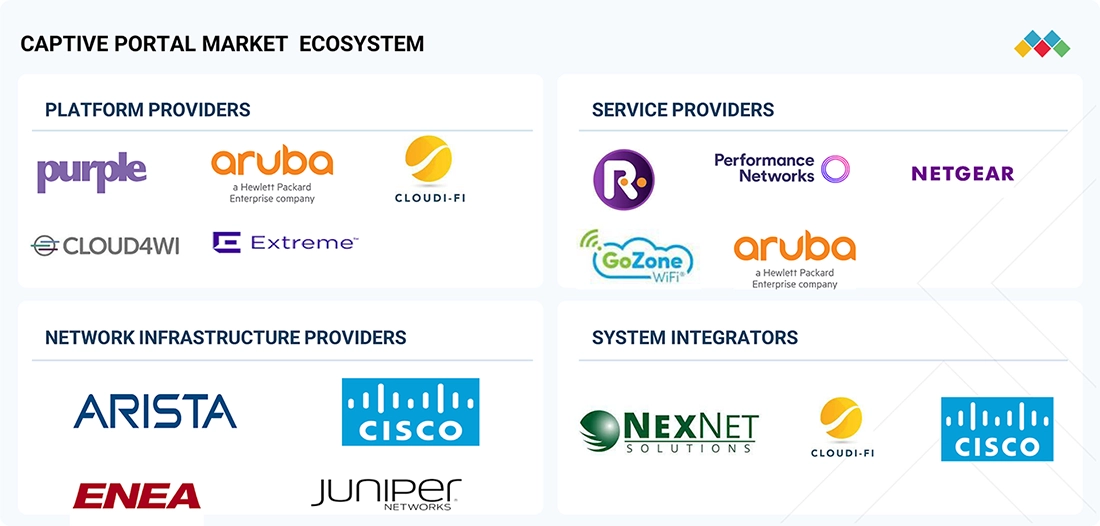
CAPTIVE PORTAL MARKET: COMMERCIAL USE CASES ACROSS INDUSTRIES
| COMPANY | USE CASE DESCRIPTION | BENEFITS |
|---|---|---|
 |
Boisset Collection used its Cisco network with Cloud4Wi to turn guest Wi-Fi into a customer engagement channel across its hospitality and winery locations. The captive portal supported branded access, first-party data collection, and automated customer communication after guest visits. | Improved guest engagement | First-party customer data capture | Personalized marketing | Better use of existing Wi-Fi infrastructure |
 |
AGS Airports used Purple’s guest Wi-Fi and tiered bandwidth capabilities to improve passenger connectivity and create a paid Wi-Fi revenue model. The captive portal helped manage airport Wi-Fi users, support premium access, and improve monetization of passenger internet services. | Passenger Wi-Fi monetization | Tiered bandwidth access | Improved airport connectivity | Additional revenue generation |
 |
A luxury retail brand deployed Cloudi-Fi’s cloud-based captive portal to improve in-store guest Wi-Fi access and customer engagement. The solution enabled shoppers to connect easily while helping the retailer collect consent-based customer data and link physical store visits with digital engagement. | Better in-store connectivity | Consent-based data capture | Improved customer engagement | Stronger online-offline customer visibility |
Logos and trademarks shown above are the property of their respective owners. Their use here is for informational and illustrative purposes only.
Related Ecosystem
Data Centre And Networking
- Software-Defined Networking (SDN)
- Mid-Sized Data Centers
- Small Data Centers
- Remote Monitoring
- Smart Healthcare
- Cisco Systems, Inc.
- HUAWEI TECHNOLOGIES CO LTD
- Hewlett Packard Enterprise Company
- MITSUBISHI ELECTRIC INFORMATION SYSTEMS CORPORATION
- MITSUBISHI ELECTRIC INFORMATION NETWORK CORPORATION
Software And Services
- Natural Language Processing (NLP)
- Machine Learning
- Supply Chain Management
- Predictive Analytics
- Image Sensors
- International Business Machines Corporation
- MICROSOFT CORPORATION
- Oracle Corporation
- SAP SE
- Amazon.com, Inc.
Key Takeaways
- Asia Pacific captive portal market valued at $291.1M in 2026, expanding to $665.6M by 2031 at 14.8% CAGR
- Asia Pacific's growth rate exceeds global average, driven by digital transformation and public Wi-Fi proliferation
- Regulatory compliance and cybersecurity mandates are primary growth catalysts across Asia Pacific markets
- Asia Pacific's competitive landscape combines global vendors with emerging local players offering region-specific solutions
Captive Portal Market Report Scope
| Report Metric | Details |
|---|---|
| Base Year | 2026 |
| Fastest Growing Segment | COWORKING SPACES (End User) |
| Forecast Period | 2026–2031 |
| Growth Rate | CAGR of 13.4% from 2026 to 2031 |
| Largest Segment | PLATFORMS (Offering) |
| Market Size Base Year (Billions) | ~USD 1.27 (2026) |
| Revenue Forecast (Billions) | ~USD 2.39 (2031) |
| Segments Covered | Offering, End User, Type 2020–2025, Type |
Asia Pacific Captive Portal Market Report Segmentation
4 segment dimensions are covered across the global market.
By Offering
- Platforms
- Services
By End User
- Coworking Spaces
- Entertainment Venues
- Hospitality & Leisure Venues
- Isps
- Other End Users
- Shopping Malls & Retail Outlets
- Travel & Transportation Hubs
By Type 2020–2025
- Airports
- Cruise Ships
- Train Stations
By Type
- Airports
- Cruise Ships
- Hotels & Resorts
- Other Hospitality & Leisure Venues
- Public Spaces
- Restaurants & Cafes
- Train Stations
Target Audience
- Captive Portal Solution Vendors : Vendors need Asia Pacific market data to identify high-growth countries, understand regional customer preferences, benchmark competitive positioning, and develop localized product strategies for hospitality and retail segments.
- Hospitality & Retail Operators : Hotel chains, shopping malls, and retail enterprises require market insights to evaluate captive portal ROI, understand peer adoption rates, assess vendor options, and justify technology investments to stakeholders.
- Telecom & Network Infrastructure Providers : Telecom operators and ISPs need regional market intelligence to identify captive portal opportunities in public Wi-Fi deployments, understand customer authentication requirements, and develop service offerings.
- Enterprise IT Decision Makers : CIOs and IT managers across Asia Pacific enterprises require market data to evaluate guest network solutions, understand industry best practices, assess vendor capabilities, and plan network security investments.
- Investment & Strategy Consultants : Investors, private equity firms, and management consultants need Asia Pacific market forecasts to evaluate investment opportunities, assess market attractiveness, identify acquisition targets, and guide portfolio companies.
Countries within Asia Pacific - compare and drill down
| Country | 2025 size (native) |
|---|---|
| China | USD 210.2 Million |
| Japan | USD 134 Million |
| India | USD 190.6 Million |
| Australia & New Zealand | USD 21.6 Million |
| Rest Of Asia Pacific | USD 109.2 Million |
Country market size visualization
Reasons to Buy this Report
- Regional Market Intelligence : Gain comprehensive insights into Asia Pacific's 14.8% CAGR growth trajectory with country-level breakdowns for China, India, Japan, and Australia, enabling precise market positioning and expansion strategies.
- Competitive Landscape Analysis : Understand regional competitive dynamics, vendor strategies, and market consolidation trends specific to Asia Pacific's hospitality, retail, and enterprise segments to identify partnership and acquisition opportunities.
- Sector-Specific Demand Drivers : Access detailed analysis of captive portal adoption across Asia Pacific's high-growth sectors including hotels, shopping centers, airports, and retail chains with quantified demand forecasts through 2031.
- Investment & Growth Opportunities : Identify high-potential markets and emerging segments within Asia Pacific where the market is projected to double from USD 291.1M to USD 665.6M, with clear growth inflection points and timing.
- Strategic Decision Support : Leverage Asia Pacific-specific market data, regulatory insights, and technology adoption patterns to inform product development, go-to-market strategies, and resource allocation decisions for the region.
Frequently asked questions
What is the current market size of captive portals in Asia Pacific?
The Asia Pacific captive portal market is valued at USD 291.1 million in 2026 and is projected to grow to USD 665.6 million by 2031.
What is the growth rate for captive portals in Asia Pacific?
Asia Pacific's captive portal market is growing at a compound annual growth rate (CAGR) of 14.8% from 2026 to 2031.
Which sectors are driving captive portal adoption in Asia Pacific?
Hospitality, retail, telecommunications, and enterprise sectors are primary drivers of captive portal adoption across Asia Pacific due to increased guest network authentication and security requirements.
What factors are accelerating captive portal market growth in Asia Pacific?
Digital transformation, regulatory compliance mandates, rising cybersecurity awareness, smartphone penetration, and expanding public Wi-Fi infrastructure are key growth factors in Asia Pacific.
How does Asia Pacific's captive portal market compare to global trends?
Asia Pacific's 14.8% CAGR exceeds the global average of 13.4%, reflecting the region's accelerated digital adoption and infrastructure investment.
RESEARCH METHODOLOGY
This research study involved the extensive use of secondary sources, directories, and databases, such as Dun & Bradstreet (D&B) Hoovers and Bloomberg BusinessWeek, to identify and collect information useful for a technical, market-oriented, and commercial study of the captive portal market. The primary sources have been mainly industry experts from the core and related industries and preferred suppliers, manufacturers, distributors, service providers, technology developers, alliances, and organizations related to all segments of the value chain of this market. In-depth interviews have been conducted with various primary respondents, including key industry participants, subject matter experts, C-level executives of key market players, and industry consultants, to obtain and verify critical qualitative and quantitative information.
Secondary Research
The market for companies offering captive portal platforms and services across different verticals has been estimated and projected using secondary data from paid and unpaid sources, along with an analysis of their product portfolios within the captive portal market ecosystem. It also involved rating company products based on their performance and quality. In the secondary research process, various sources such as several journals, such as the Institute of Electrical and Electronics Engineers (IEEE), ScienceDirect, ResearchGate, Academic Journals, Scientific.Net, and various telecom and WIFI associations/forums, Wi-Fi Alliance, and 3GPP have been referred to for identifying and collecting information for this study on the captive portal market.
The secondary sources included annual reports, press releases, investor presentations of companies, white papers, journals, and certified publications and articles by recognized authors, directories, and databases. Secondary research has been mainly used to obtain key information about the supply chain of the market, the total pool of key players, market classification, segmentation according to industry trends to the bottommost level, regional markets, and key developments from both market- and technology-oriented perspectives that have been further validated by primary sources.
Primary Research
In the primary research process, various primary sources from the supply and demand sides were interviewed to obtain qualitative and quantitative information on the market. The primary sources from the supply side included various industry experts, including Chief Experience Officers (CXOs); Vice Presidents (VPs); directors from business development, marketing, and product development/innovation teams; related key executives from captive portal solution vendors, professional service providers, and industry associations; and key opinion leaders.
Primary interviews were conducted to gather insights, such as market statistics, revenue data collected from solutions and services, market breakups, market size estimations, market forecasts, and data triangulation. Primary research also helped in understanding various trends related to technologies, applications, deployments, and regions. Stakeholders from the demand side, such as Chief Information Officers (CIOs), Chief Technology Officers (CTOs), Chief Strategy Officers (CSOs), and end users using captive portal solutions, were interviewed to understand the buyer’s perspective on suppliers, products, service providers, and their current usage of captive portal solutions, which would impact the overall captive portal market.
Breakdown of Primaries:
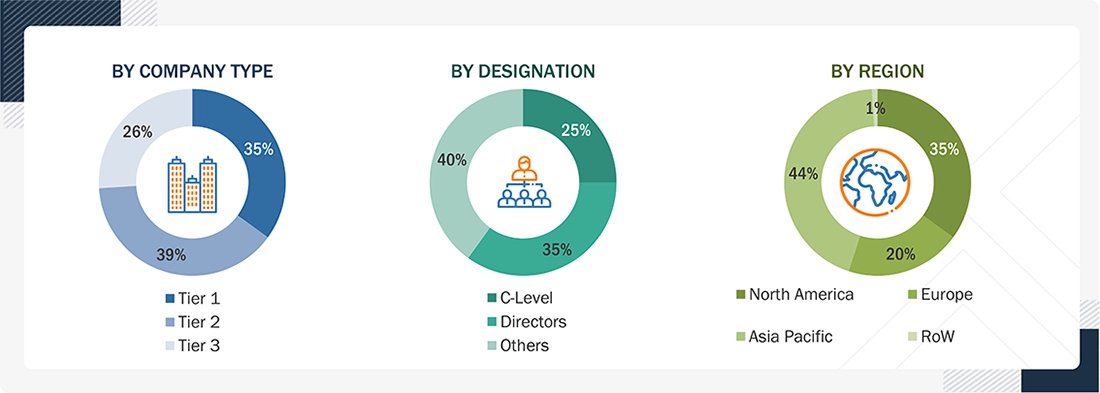
*Others include sales managers, marketing managers, and product managers.
Note: Tier 1 companies’ revenue is more than USD 1 billion; Tier 2 companies’ revenue ranges between USD 500 million to 1 billion; and Tier 3 companies’ revenue ranges between USD 100 million and USD 500 million
To know about the assumptions considered for the study, download the pdf brochure
Market Size Estimation
Multiple approaches were adopted to estimate and forecast the size of the captive portal market. The first approach involves estimating market size by summing up the revenue generated by companies through the sale of captive portal offerings.
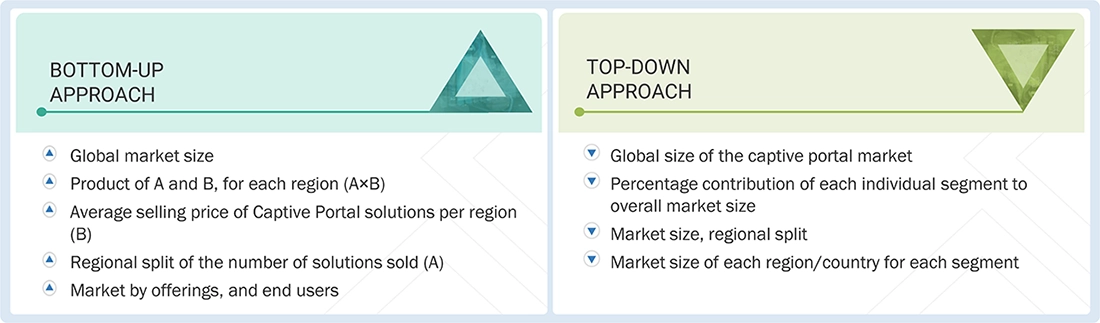
Top-down and bottom-up approaches were used to estimate and validate the total size of the captive portal market. These methods were extensively used to estimate the size of various segments in the market. The research methodology used to evaluate the market size is listed below.
- Key players in the market have been identified through extensive secondary research.
- In terms of value, the industry’s supply chain and market size have been determined through primary and secondary research processes.
- All percentage shares, splits, and breakups have been determined using secondary sources and verified through primary sources.
Captive Portal Market: Top-Down and Bottom-Up Approach
Data Triangulation
After determining the overall market size, the captive portal market was divided into several segments and subsegments. A data triangulation procedure was used to complete the overall market engineering process and arrive at the exact statistics for all segments and subsegments, wherever applicable. The data was triangulated by studying various factors and trends from the demand and supply sides. Along with data triangulation and market breakdown, the market size was validated by the top-down and bottom-up approaches.
Market Definition
A captive portal is a web-based authentication and access control system displayed to users before granting access to a wired or wireless network. It is widely deployed across public venues such as airports, hotels, retail outlets, educational institutions, transportation hubs, and enterprise environments to manage guest Wi-Fi access. Captive portals authenticate and authorize users through login credentials, social media authentication, vouchers, or acceptance of terms and conditions. In addition to securing network access, captive portals enable service providers and enterprises to deliver customized user experiences, collect customer insights, support targeted marketing campaigns, and monitor network usage. These platforms also facilitate user onboarding, traffic management, and analytics, thereby improving operational efficiency, customer engagement, and overall network security across public and private connectivity environments.
Key Stakeholders
- Captive Portal Platform and Service Providers
- Technology Vendors
- Telecom Providers
- Mobile Network Operators (MNOs)
- System Integrators (SIs)
- Resellers
- Value-added Resellers (VARs)
- Managed Service Providers (MSPs)
- Compliance Regulatory Authorities
- Government Authorities
- Original Equipment Manufacturers (OEMs)
Report Objectives
- To determine and forecast the global captive portal market by offerings (platforms and services), end user, and region
- To forecast the size of the market segments for North America, Europe, Asia Pacific, Latin America, and Middle East & Africa
- To provide detailed information about the major factors (drivers, restraints, opportunities, and challenges) influencing the growth of the captive portal market
- To analyze each submarket concerning individual growth trends, prospects, and contributions to the overall captive portal market
- To analyze the opportunities in the market for stakeholders by identifying the high-growth segments of the captive portal market
- To profile the key market players; provide a comparative analysis based on business overviews, regional presence, product offerings, business strategies, and key financials; and illustrate the market’s competitive landscape
- Track and analyze competitive developments in the market, such as mergers and acquisitions, product developments, partnerships and collaborations, and research and development (R&D) activities
Available customizations:
With the given market data, MarketsandMarkets offers customizations to meet the company’s specific needs. The following customization options are available for the report:
Country-wise information
-
Analysis for additional countries (up to five)
Company Information
-
Detailed analysis and profiling of additional market players (up to 5)
Get the Full Captive Portal Market Report
Full forecast, segment splits, and company analysis for all Captive Portal Market.
- Canada Captive Portal Market
- US Captive Portal Market
- UK Captive Portal Market
- Germany Captive Portal Market
- Italy Captive Portal Market
- Spain Captive Portal Market
- France Captive Portal Market
- China Captive Portal Market
- Japan Captive Portal Market
- India Captive Portal Market
- UAE Captive Portal Market
- Saudi Arabia Captive Portal Market
- South Africa Captive Portal Market
- Brazil Captive Portal Market
- Mexico Captive Portal Market
- Rest Of Europe Captive Portal Market
- Rest Of Asia Pacific Captive Portal Market
Need a Tailored Report?
Customize this report to your needs
Get 10% FREE Customization
Customize This Report
