
Asia Pacific Consumer Packaged Goods Market (2025-2030)

The Asia Pacific Consumer Packaged Goods Market was valued at $1026.27 Million in 2025 and projected to reach to $1355.93 Million by 2030, representing a compound annual growth rate of 5.7%. The Asia Pacific Consumer Packaged Goods market is positioned for sustained growth through 2030, driven by demographic shifts, rising purchasing power, and accelerating digital retail adoption.


| Market Size in | USD 26.32 MN |
| Market Forecast in | |
| CAGR | |
| Forecast Period | |
| Units Considered | Value (USD MN) |
Asia Pacific Consumer Packaged Goods Market Trends and Insights
- Asia Pacific's 5.7% compound annual growth rate significantly outpaces the global average of 4.2%, reflecting strong demand dynamics across the region's diverse consumer base.
- This accelerated growth in Asia Pacific is driven by rising disposable incomes, urbanization, and shifting consumer preferences toward convenience and quality products. Asia Pacific's CPG sector is characterized by increasing penetration of modern retail channels and e-commerce adoption, which are reshaping distribution networks across the region.
- The forecast period through 2030 indicates sustained momentum in Asia Pacific, supported by population growth and expanding middle-class demographics.
- Asia Pacific manufacturers are investing heavily in product innovation and localization strategies to capture emerging market opportunities and meet evolving consumer expectations for health-conscious and sustainable offerings..
Key Market Statistics
- CAGR (2025-2030) 5.7% CAGR
- Market Size, 2025 ~USD 1026.27 Million
- Forecast, 2030 ~USD 1355.93 Million
- Geography Asia Pacific
Asia Pacific Consumer Packaged Goods Market Overview
Outpacing Global Growth :
Asia Pacific's 5.7% CAGR significantly exceeds the global average of 4.2%, driven by rising disposable incomes, urbanization, and changing consumer preferences across the region's diverse markets.
Market Expansion Trajectory :
The region's CPG market is valued at USD 1,026.27 million in 2025 and is projected to grow to USD 1,355.93 million by 2030, representing a USD 329.66 million increase over the forecast period.
China & India Dominance :
China and India collectively represent the largest growth engines in Asia Pacific, with combined market sizes exceeding USD 897 billion, accounting for the majority of regional CPG consumption and innovation.
Emerging Consumer Dynamics :
Growing middle-class populations, e-commerce penetration, and premiumization trends across Southeast Asia and the subcontinent are reshaping product demand and distribution channels in the CPG sector.
Asia Pacific Consumer Packaged Goods Market Dynamics
- Key markets including China, India, Japan, and Australia & New Zealand are experiencing transformative changes in consumer behavior, with increasing demand for convenience products, health-conscious options, and sustainable packaging solutions. Regional expansion is further supported by improving supply chain infrastructure, growing retail modernization, and increased foreign investment in manufacturing and distribution networks.
- The region's young, tech-savvy population is driving innovation in product categories and marketing channels, while traditional retail continues to coexist with rapidly expanding e-commerce platforms, creating diverse growth opportunities for CPG manufacturers and distributors..
Market Ecosystem
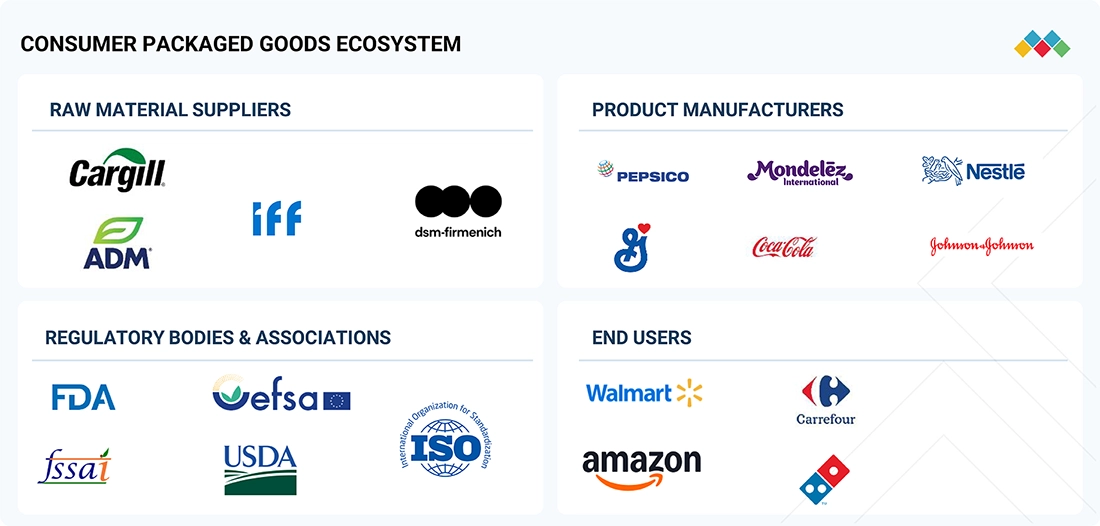
Consumer Packaged Goods Market: COMMERCIAL USE CASES ACROSS INDUSTRIES
| COMPANY | USE CASE DESCRIPTION | BENEFITS |
|---|---|---|
 |
Implementing AI-driven demand forecasting and digital twins for food & beverages to match production with consumption patterns | Minimizes food waste, lowers supply chain costs, ensures product availability, improves forecasting accuracy |
 |
Deploying smart vending machines with IoT sensors for personalization (flavor-mix options, portion control) and digital engagement | Increased consumer engagement, better data capture, optimized inventory in vending networks |
 |
Integrating QR-enabled smart packaging to provide recycling instructions and authenticity checks for baby and feminine care products | Enhances consumer trust, ensures regulatory compliance, supports sustainability commitments |
 |
Investing in plant-based snacks and alternative protein beverages (e.g., Beyond Meat collaborations) to diversify portfolio | Access to health-conscious consumers, category diversification, premium pricing opportunities |
Logos and trademarks shown above are the property of their respective owners. Their use here is for informational and illustrative purposes only.
Related Ecosystem
Fandb Logistics Cold Chain And Packaging
- Rigid Packaging
- Acrylics
- Active Packaging
- Dairy Products
- Gravure Process
- Amcor plc
- Essentra plc
- Basf se
- AZELIS HOLDINGS SA
- Sonoco Products Company
Key Takeaways
- Asia Pacific CPG market will grow from USD 1,026.27M (2025) to USD 1,355.93M (2030) at a 5.7% CAGR, outpacing global growth.
- Asia Pacific's rapid urbanization and rising middle-class consumption are primary catalysts for sustained market expansion through 2030.
- E-commerce and modern retail channels are transforming Asia Pacific's CPG distribution landscape and consumer purchasing behavior.
- Asia Pacific manufacturers are prioritizing product innovation and sustainability to meet evolving regional consumer demands.
Consumer Packaged Goods Market Report Scope
| Report Metric | Details |
|---|---|
| Base Year | 2025 |
| Fastest Growing Segment | METAL (Material) |
| Forecast Period | 2025-2030 |
| Growth Rate | CAGR of 4.2% from 2025 to 2030 |
| Largest Segment | FOOD & BEVERAGES (Product Type) |
| Market Size Base Year (Billions) | ~USD 3447.59 (2025) |
| Revenue Forecast (Billions) | ~USD 4235.01 (2030) |
| Segments Covered | Product Type, Distribution Channel, Packaging Format, Packaging Material, Packaging Type, Material, Material Type |
Asia Pacific Consumer Packaged Goods Market Report Segmentation
7 segment dimensions are covered across the global market.
By Product Type
- Cosmetics & Personal Care Products
- Food & Beverages
- Healthcare Products
- Household Care Products
- Other Product Types
By Distribution Channel
- Convenience Stores
- E-Commerce
- Other Distribution Channels
- Supermarket/Hypermarkets
- Supermarkets
- Supermarkets/Hypermarkets
By Packaging Format
- Flexible Packaging
- Rigid Packaging
By Packaging Material
- Glass
- Metal
- Paper & Paperboard
- Plastic
By Packaging Type
- Bottles
- Boxes
- Cans
- Glass
- Metal
- Paper & Paperboard
- Plastic
- Pouches
By Material
- Glass
- Metal
- Other Material Types
- Paper & Paperboard
- Plastic
By Material Type
- Aluminum
- Steel
Target Audience
- CPG Manufacturers & Brand Owners : Require Asia Pacific market intelligence to guide product launches, portfolio optimization, and regional expansion strategies across China, India, Japan, and emerging Southeast Asian markets.
- Retail & Distribution Networks : Need detailed market forecasts and country-level data to plan inventory, optimize supply chains, and identify growth opportunities in Asia Pacific's rapidly evolving retail landscape.
- Private Equity & Investment Firms : Seek comprehensive regional market analysis to evaluate acquisition targets, assess growth potential, and identify high-return investment opportunities in Asia Pacific CPG sectors.
- Market Entry & Strategy Consultants : Utilize Asia Pacific-specific insights to advise clients on market selection, competitive positioning, and localization strategies for successful CPG business expansion in the region.
- Financial Analysts & Investors : Require detailed market sizing, CAGR data, and country-level forecasts to support equity research, valuation models, and investment recommendations for Asia Pacific CPG companies.
Countries within Asia Pacific - compare and drill down
| Country | 2025 size (native) |
|---|---|
| China | USD 498690 Million |
| Japan | USD 184700 Million |
| India | USD 399130 Million |
| Australia & New Zealand | USD 52830 Million |
| Rest Of Asia Pacific | USD 220570 Million |
Country market size visualization
Reasons to Buy this Report
- Regional Growth Intelligence : Gain comprehensive insights into Asia Pacific's 5.7% CAGR trajectory, significantly outpacing global benchmarks and identifying high-potential market segments for strategic expansion.
- Country-Level Market Data : Access detailed market sizing and forecasts for major Asia Pacific economies including China, India, Japan, and Australia & New Zealand to inform localized go-to-market strategies.
- Competitive Positioning : Understand regional market dynamics, consumer preferences, and emerging trends across diverse Asia Pacific markets to benchmark performance and identify competitive advantages.
- Investment & Expansion Planning : Leverage USD 329.66 million growth opportunity data (2025-2030) to prioritize market entry, capacity investments, and partnership development across high-growth Asia Pacific territories.
- Consumer Trend Analysis : Identify premiumization, e-commerce, and sustainability trends reshaping Asia Pacific CPG demand, enabling product innovation and channel optimization aligned with regional consumer evolution.
Frequently asked questions
What is the projected market size for Asia Pacific CPG in 2030?
Asia Pacific's Consumer Packaged Goods market is forecast to reach USD 1,355.93 million by 2030, growing from USD 1,026.27 million in 2025.
How does Asia Pacific's growth rate compare to global CPG market growth?
Asia Pacific's 5.7% CAGR significantly exceeds the global CPG market CAGR of 4.2%, indicating stronger regional growth momentum.
What are the primary growth drivers for Asia Pacific's CPG market?
Key drivers include rising disposable incomes, rapid urbanization, expanding middle-class demographics, and increasing e-commerce penetration across Asia Pacific.
How is e-commerce impacting Asia Pacific's CPG distribution?
E-commerce adoption is reshaping Asia Pacific's CPG distribution networks, enabling direct-to-consumer sales and modernizing retail channels across the region.
What product trends are shaping Asia Pacific's CPG market through 2030?
Asia Pacific consumers increasingly demand health-conscious, sustainable, and locally-adapted CPG products, driving manufacturer innovation and localization strategies.
RESEARCH METHODOLOGY
The study involved two major approaches in estimating the current size of the CPG market. Exhaustive secondary research was done to collect information on the market, peer, and parent markets. The next step was to validate these findings, assumptions, and sizing with industry experts across the value chain through primary research. Both top-down and bottom-up approaches were employed to estimate the complete market size. After that, market breakdown and data triangulation were used to estimate the market size of segments and subsegments.
Secondary Research
This research study involved the extensive use of secondary sources—directories and databases such as Bloomberg Businessweek and Factiva—to identify and collect information useful for a technical, market-oriented, and commercial study of the market.
In the secondary research process, various sources, such as company annual reports, press releases, investor presentations, white papers, food journals, certified publications, articles from recognized authors, directories, and databases, were used to identify and collect information.
Secondary research was mainly used to obtain key information about the industry’s supply chain, the total pool of key players, and market classification and segmentation as per the industry trends to the bottom-most level, regional markets, and key developments from both market- and technology-oriented perspectives.
Primary Research
Extensive primary research was conducted after obtaining information regarding the CPG market scenario through secondary research. Several primary interviews were conducted with market experts from both the demand and supply sides across major countries of North America, Europe, Asia Pacific, South America, and the Rest of the World. Primary data was collected through questionnaires, emails, and telephonic interviews. The primary sources from the supply side included various industry experts, such as Chief X Officers (CXOs), Vice Presidents (VPs), Directors from business development, marketing, research, and development teams, and key opinion leaders. Primary interviews were conducted to gather insights such as market statistics, data on revenue collected from the products and services, market breakdowns, market size estimations, market forecasting, and data triangulation. Primary research also helped in understanding the various trends related to consumer packaged goods, product type, packaging type, distribution channel, packaging material, and region. Stakeholders from the demand side, such as research institutions and universities, third-party vendors, were interviewed to understand the buyer’s perspective on the product, and their current usage of consumer packaged goods and the outlook of their business, which will affect the overall market.
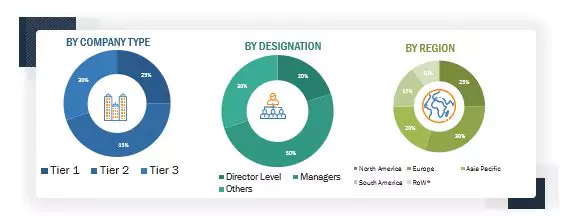
Note: The three tiers of the companies are defined based on their total revenues in 2023 or 2024,
as per the availability of financial data: Tier 1: Revenue > USD 1 billion; Tier 2: USD 100
million ≤ Revenue ≤ USD 1 billion; Tier 3: Revenue < USD 100 million.
To know about the assumptions considered for the study, download the pdf brochure
|
COMPANY NAME |
DESIGNATION |
|
Procter & Gamble (US) |
R&D expert |
|
Unilever (UK) |
Sales Manager |
|
Nestlé (Switzerland) |
Manager |
|
Danone (France) |
Sales Manager |
|
The Coca-Cola Company (US) |
Marketing Manager |
Market Size Estimation
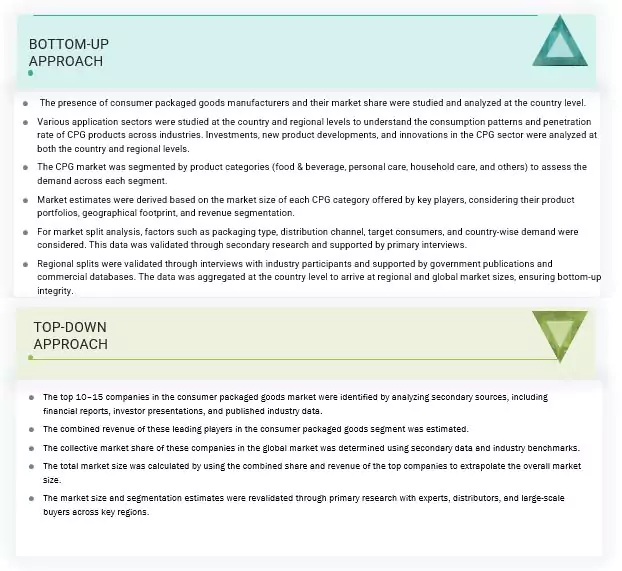
Both the top-down and bottom-up approaches were used to estimate and validate the total size of the consumer packaged goods market. These approaches were also used extensively to determine the size of various subsegments in the market. The research methodology used to estimate the market size includes the following details:
- The key players in the industry and the overall markets were identified through extensive secondary research.
- All shares, splits, and breakdowns were determined using secondary sources and verified through primary sources.
- All possible parameters that affect the market covered in this research study were accounted for, viewed in extensive detail, verified through primary research, and analyzed to obtain final quantitative and qualitative data.
- The research included the study of reports, reviews, and newsletters of top market players, along with extensive interviews for opinions from leaders, such as CEOs, directors, and marketing executives.
Consumer Packaged Goods Market : Top-Down and Bottom-Up Approach
Data Triangulation
After arriving at the overall market size from the estimation process explained above, the total market was split into several segments and subsegments. The data triangulation and market breakdown procedures were employed, wherever applicable, to estimate the overall CPG market and arrive at the exact statistics for all segments and subsegments. The data was triangulated by studying various factors and trends from the demand and supply sides. The market size was also validated using both the top-down and bottom-up approaches.
Market Definition
Consumer Packaged Goods (CPG) are products that consumers use on a daily or frequent basis and that are consumed quickly, requiring regular repurchase. These goods are typically low-cost, non-durable items packaged for retail sale, including categories such as food and beverages, personal care products, cosmetics, cleaning supplies, and household items.
Stakeholders
- Raw Material Suppliers – Providers of essential ingredients and inputs required for the production and processing of consumer goods, including food, beverages, personal care products, and more.
- Manufacturers & Processors – Companies that transform raw materials into finished or semi-finished products through various production and processing techniques.
- Contract Manufacturers & Co-packers – Third-party firms that produce, assemble, or package products on behalf of brand owners, enabling scalability and efficiency in production.
- Packaging & Labeling Companies – Businesses that design and supply packaging materials and labeling solutions to ensure product safety, branding, and regulatory compliance.
- Logistics & Supply Chain Partners – Organizations responsible for the transportation, warehousing, and distribution of products across the supply chain to ensure timely delivery and inventory management.
- Distributors & Wholesalers – Entities that purchase goods in bulk from manufacturers and sell them to retailers or other businesses within the supply chain.
- Retailers – Businesses that sell finished products directly to consumers through physical stores or online platforms.
- Marketing & Advertising Agencies – Firms that develop and implement promotional strategies, brand campaigns, and market research to boost product visibility and consumer engagement.
- Regulatory Bodies & Certification Agencies – Organizations that establish and enforce standards for safety, quality, and compliance, and issue necessary certifications for market entry (e.g., FDA, USDA, ISO).
- Consumers – End-users who purchase and use products, influencing market trends and demand through preferences, feedback, and purchasing behavior.
- Investors & Financial Stakeholders – Individuals or institutions that provide funding and financial support to companies across the value chain in exchange for returns or equity.
- Technology Providers – Companies offering digital tools, automation solutions, data analytics, and software platforms to improve operational efficiency and innovation.
- Sustainability & ESG Stakeholders – Entities focused on environmental, social, and governance (ESG) criteria, driving sustainable practices, ethical sourcing, and responsible business conduct throughout the value chain.
Report Objectives
- To determine and project the size of the CPG market with respect to the product type, packaging type, distribution channel, packaging material, and regions in terms of value over five years, ranging from 2025 to 2030
- To identify the attractive opportunities in the market by determining the largest and fastest-growing segments across regions
- To provide detailed information about the key factors influencing market growth (drivers, restraints, opportunities, and challenges)
- To analyze the opportunities in the market for stakeholders and provide details of the competitive landscape for market leaders
- To analyze the micro-markets with respect to individual growth trends, prospects, and their contribution to the total market
- To identify and profile the key players in the CPG market
- To understand the competitive landscape and identify the major growth strategies adopted by players across the key regions
Available Customizations
With the given market data, MarketsandMarkets offers customizations according to company-specific scientific needs.
The following customization options are available for the report:
Product Analysis
- Service Matrix, which gives a detailed comparison of the service portfolio of each company.
Geographic Analysis as per Feasibility
With the given market data, MarketsandMarkets offers customizations according to company-specific scientific needs.
- Further breakdown of the Rest of European consumer packaged goods market into key countries.
- Further breakdown of the Rest of Asia Pacific consumer packaged goods market into key countries.
- Further breakdown of the Rest of South American consumer packaged goods market into key countries.
Company Information
- Detailed analyses and profiling of additional market players (up to five)
Get the Full Consumer Packaged Goods Market Report
Full forecast, segment splits, and company analysis for all Consumer Packaged Goods Market.
- Canada Consumer Packaged Goods Market
- Mexico Consumer Packaged Goods Market
- US Consumer Packaged Goods Market
- Germany Consumer Packaged Goods Market
- UK Consumer Packaged Goods Market
- Italy Consumer Packaged Goods Market
- France Consumer Packaged Goods Market
- Spain Consumer Packaged Goods Market
- China Consumer Packaged Goods Market
- Japan Consumer Packaged Goods Market
- India Consumer Packaged Goods Market
- Argentina Consumer Packaged Goods Market
- Rest Of Europe Consumer Packaged Goods Market
- Rest Of Asia Pacific Consumer Packaged Goods Market
- Chile Consumer Packaged Goods Market
- Rest Of South America Consumer Packaged Goods Market
Need a Tailored Report?
Customize this report to your needs
Get 10% FREE Customization
Customize This Report
