
Asia Pacific Cosmetic Preservatives Market (2026-2031)

The Asia Pacific Cosmetic Preservatives Market was valued at $213.4 Million in 2026 and projected to reach to $286.2 Million by 2031, representing a compound annual growth rate of CAGR 6.1%. The Asia Pacific cosmetic preservatives market is poised for sustained growth through 2031, expanding from USD 213.4 million in 2026 to USD 286.2 million by 2031.


| Market Size in | USD 26.32 MN |
| Market Forecast in | |
| CAGR | |
| Forecast Period | |
| Units Considered | Value (USD MN) |
Asia Pacific Cosmetic Preservatives Market Trends and Insights
- Asia Pacific's market expansion is driven by rising consumer demand for personal care products, increasing regulatory focus on product safety, and growing awareness of natural and sustainable preservative solutions across the region.
- The region's cosmetic preservatives market benefits from rapid urbanization, rising disposable incomes, and a thriving beauty and personal care industry that spans multiple countries with distinct regulatory frameworks. Asia Pacific's 6.1% CAGR outpaces the global average, reflecting the region's accelerating adoption of premium cosmetic formulations and clean-label products.
- Asia Pacific manufacturers are increasingly investing in innovative preservation technologies to meet stringent regional regulations and consumer preferences for safer, naturally-derived preservatives.
- The forecast period through 2031 positions Asia Pacific as a critical growth engine for the global cosmetic preservatives market, supported by expanding middle-class populations and e-commerce penetration across key markets..
Key Market Statistics
- CAGR (2026-2031) CAGR 6.1%
- Market Size, 2026 ~USD 213.4 Million
- Forecast, 2031 ~USD 286.2 Million
- Geography Asia Pacific
Asia Pacific Cosmetic Preservatives Market Overview
Rapid Market Expansion :
Asia Pacific cosmetic preservatives market is growing at 6.1% CAGR, outpacing the global rate of 5.7%, driven by surging demand for personal care products across emerging economies and established markets.
China's Market Dominance :
China leads the region with USD 105.7 million in market size, reflecting strong consumer spending on cosmetics and stringent regulatory requirements for product preservation and safety standards.
Natural Preservative Shift :
Growing consumer awareness in Asia Pacific is driving demand for natural and sustainable preservative solutions, with brands increasingly adopting plant-based alternatives to synthetic chemicals.
Regulatory Compliance Focus :
Increasing regulatory scrutiny across Asia Pacific nations is pushing cosmetic manufacturers to invest in compliant preservation technologies, creating opportunities for innovative preservative solutions.
Asia Pacific Cosmetic Preservatives Market Dynamics
- This trajectory reflects the region's booming personal care sector, driven by rising middle-class consumers, urbanization, and increasing beauty consciousness among younger demographics.
- China, India, and Japan remain key growth engines, with emerging markets contributing significantly to regional expansion. Regulatory harmonization efforts and consumer preference for safer, naturally-derived preservatives are reshaping the competitive landscape.
- Manufacturers investing in R&D for clean-label and multifunctional preservatives will capture substantial market share.
- The region's diverse regulatory frameworks present both challenges and opportunities, requiring localized strategies to meet country-specific compliance requirements while capitalizing on the growing demand for premium, sustainable cosmetic products..
Market Ecosystem

COSMETIC PRESERVATIVES MARKET: COMMERCIAL USE CASES ACROSS INDUSTRIES
| COMPANY | USE CASE DESCRIPTION | BENEFITS |
|---|---|---|
 |
Uses broad-spectrum preservative systems (phenoxyethanol, parabens, organic acids) across skincare, haircare, and makeup products | Ensures microbial safety, extends shelf life, maintains product stability, and supports global regulatory compliance |
 |
Incorporates preservative blends in premium skincare, serums, and makeup formulations | Prevents contamination in high-value products, enhances product longevity, and ensures consumer safety |
 |
Uses preservatives in mass-market personal care brands (Dove, Sunsilk, etc.) across creams, shampoos, and deodorants | Cost-effective preservation, large-scale product stability, and protection against microbial growth |
Logos and trademarks shown above are the property of their respective owners. Their use here is for informational and illustrative purposes only.
Related Ecosystem
Speciality Chemicals
- Corrosion Inhibitors
- Polyetheretherketone (PEEK)
- Acrylonitrile Butadiene Styrene (ABS)
- Epoxy Resin
- Polycarbonate
- Basf se
- DOW CHEMICAL COMPANY
- Evonik industries ag
- Clariant ag.
- Solvay sa
Key Takeaways
- Asia Pacific cosmetic preservatives market valued at USD 213.4 million in 2026, expanding to USD 286.2 million by 2031 at 6.1% CAGR
- Asia Pacific's growth rate exceeds global average, driven by rising consumer demand for safe, natural preservatives in personal care products
- Asia Pacific regulatory environment and clean-label trends are accelerating adoption of innovative preservation technologies across the region
- Asia Pacific's expanding middle class and e-commerce growth position the region as a key driver of global cosmetic preservatives market expansion
Cosmetic Preservatives Market Report Scope
| Report Metric | Details |
|---|---|
| Base Year | 2026 |
| Fastest Growing Segment | ORGANIC ACIDS & THEIR SALTS (Type) |
| Forecast Period | 2026–2031 |
| Growth Rate | CAGR of 5.7% from 2026 to 2031 |
| Largest Segment | SKIN CARE (Application) |
| Market Size Base Year (Billions) | ~USD 0.58 (2026) |
| Revenue Forecast (Billions) | ~USD 0.77 (2031) |
| Segments Covered | Type, Application |
Asia Pacific Cosmetic Preservatives Market Report Segmentation
2 segment dimensions are covered across the global market.
By Type
- Alcohol-Based Preservatives
- Formaldehyde Donors
- Isothiazolinones
- Metal-Based/Inorganic Preservatives
- Organic Acids & Their Salts
- Other Types
- Paraben Esters
- Phenolic Preservatives
- Quaternary Ammonium Compounds
By Application
- Bath & Shower Products
- Color Cosmetics
- Hair Care
- Oral Care
- Other Applications
- Skin Care
- Sskin Care
Target Audience
- Cosmetic Manufacturers : Manufacturers need Asia Pacific market data to develop region-specific product formulations, understand local regulatory requirements, and identify opportunities for natural and sustainable preservative solutions.
- Preservative Suppliers : Suppliers require detailed market insights to identify growth opportunities, assess competitive positioning, and develop targeted sales strategies for different Asia Pacific markets and customer segments.
- Investment & Private Equity Firms : Investors need comprehensive market analysis to evaluate acquisition targets, assess growth potential, and make strategic investment decisions in the Asia Pacific cosmetic preservatives sector.
- Regulatory & Compliance Consultants : Consultants require country-specific regulatory data and market trends to advise clients on compliance strategies, product registration, and market entry approaches across Asia Pacific regions.
- Market Research & Strategy Teams : Strategic planners need detailed Asia Pacific market forecasts, competitive intelligence, and trend analysis to inform business development, product innovation, and market expansion initiatives.
Key Companies in the Asia Pacific Cosmetic Preservatives Market
| Company | HQ | Ownership | Strongest segments |
|---|---|---|---|
| SYNTHOS S.A | Poland | Private Company | Synthetic rubber (SBR, BR, NBR and related),EPS/XPS and polystyrene (InSphere, Inpacto, Silver, XPS PRIME, SYNTHOS PS),Dispersions, latex, adhesives (Osakryl, Synexil, WOODMAX, PAPERMAX), |
| BOREALIS AG | Austria | Private Company | Polyolefin solutions (PE/PP for consumer, infrastructure, mobility, energy, healthcare),Base chemicals (olefins, phenol, aromatics, intermediates),Recycling and circular polyolefin materials, |
| AZELIS HOLDINGS SA | Belgium | Private Company | Life Sciences (food, nutrition, pharma, personal and home care),Industrial Specialties (coatings, plastics, lubricants, advanced materials),Other and cross-portfolio services, |
| ASHLAND | United States | Public Company | Life Sciences (pharma, nutrition, ag, diagnostics, fine chemicals),Personal Care & Household,Specialty Additives (coatings, construction, energy, industrial), |
| BASF | Germany | Public Company | Chemicals (Petrochemicals and Intermediates),Materials (Isocyanates, Polyamides, Inorganics, Plastics Specialties),Industrial Solutions (Dispersions, Resins, Additives, Catalysts, Electronic Materials), |
| SYMRISE | Germany | Public Company | Taste, Nutrition & Health – Food & Beverage,Taste, Nutrition & Health – Pet Food & Aqua,Taste, Nutrition & Health – Probiotics & Dietary Supplements, |
| CLARIANT | Switzerland | Public Company | Care Chemicals,Adsorbents & Additives,Catalysts, |
| LANXESS | Germany | Public Company | Specialty Additives,Consumer Protection,Advanced Intermediates, |
| EASTMAN CHEMICAL COMPANY | United States | Public Company | Additives & Functional Products,Advanced Materials,Chemical Intermediates, |
| GALAXY SURFACTANTS | India | Public Company | Core surfactants (fatty alcohol sulfates, ether sulfates, ethoxylates, LABSA),Mild surfactants and blends,Emollients, pearlizers, foam and viscosity boosters, |
SYNTHOS S.A
SYNTHOS S.A is a Polish private chemical company founded in 1945 with 2,975 employees.
BOREALIS AG
BOREALIS AG is an Austrian private chemical company founded in 1994 with 5,887 employees.
AZELIS HOLDINGS SA
AZELIS HOLDINGS SA is a Belgian private chemical company founded in 2001 with 1,325 employees.
ASHLAND
ASHLAND is a United States public company founded in 1924 with 2,900 employees.
BASF
BASF is a German public chemical company founded in 1865 with 106,428 employees.
SYMRISE
SYMRISE is a German public company established in 1874 with 12,697 employees.
CLARIANT
CLARIANT is a Swiss public chemical company founded in 1886 with 9,998 employees.
LANXESS
LANXESS is a German public chemical company founded in 1863 with 11,630 employees.
EASTMAN CHEMICAL COMPANY
EASTMAN CHEMICAL COMPANY is a United States public company established in 1920 with 13,000 employees.
GALAXY SURFACTANTS
GALAXY SURFACTANTS is an Indian public company founded in 1980 with 1,723 employees.
Countries within Asia Pacific - compare and drill down
| Country | 2025 size (native) |
|---|---|
| China | USD 105.7 Million |
| India | USD 45 Million |
| Japan | USD 47.3 Million |
| Rest Of Asia Pacific | USD 88.2 Million |
Country market size visualization
Reasons to Buy this Report
- Regional Market Segmentation : Gain detailed insights into Asia Pacific's cosmetic preservatives market with country-level data for China, India, Japan, and Rest of Asia Pacific, enabling precise market targeting and localized business strategies.
- Growth Opportunity Identification : Identify high-growth segments and emerging trends specific to Asia Pacific, including the shift toward natural preservatives and regulatory compliance requirements that drive market expansion.
- Competitive Intelligence : Understand the competitive landscape across Asia Pacific markets, including key players, market consolidation trends, and differentiation strategies in the cosmetic preservatives sector.
- Regulatory Insights : Access comprehensive analysis of varying regulatory frameworks across Asia Pacific countries, helping manufacturers navigate compliance requirements and capitalize on market opportunities.
- Investment Decision Support : Make informed investment and expansion decisions with accurate market forecasts, CAGR projections, and strategic recommendations tailored to Asia Pacific's unique market dynamics.
Frequently asked questions
What is the current market size of cosmetic preservatives in Asia Pacific?
The Asia Pacific cosmetic preservatives market is valued at USD 213.4 million in 2026 and is projected to reach USD 286.2 million by 2031.
What is the growth rate for cosmetic preservatives in Asia Pacific?
Asia Pacific's cosmetic preservatives market is growing at a CAGR of 6.1% from 2026 to 2031, outpacing the global average of 5.7%.
What factors are driving growth in Asia Pacific's cosmetic preservatives market?
Key drivers include rising consumer demand for personal care products, increasing regulatory focus on product safety, growing preference for natural preservatives, rapid urbanization, and expanding e-commerce channels across Asia Pacific.
Which preservative types are most popular in Asia Pacific?
Asia Pacific shows strong demand for natural and clean-label preservatives, including plant-based and synthetic alternatives that meet regional regulatory standards and consumer safety expectations.
How does Asia Pacific's market growth compare to other regions?
Asia Pacific's 6.1% CAGR exceeds the global average of 5.7%, positioning the region as a high-growth market driven by demographic and economic expansion.
RESEARCH METHODOLOGY
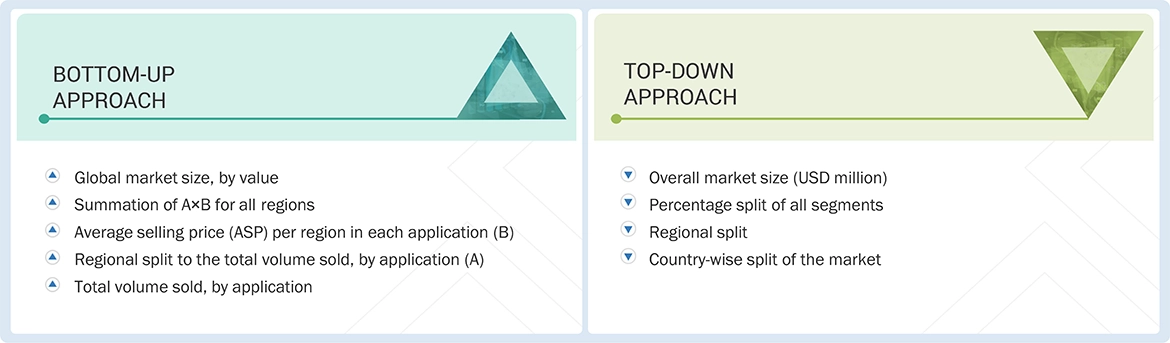
The study involves two major activities in estimating the current market size for the cosmetic preservatives market. Exhaustive secondary research was done to collect information on the market, peer market, and parent market. The next step was to validate these findings, assumptions, and sizing with industry experts across the value chain through primary research. Both top-down and bottom-up approaches were employed to estimate the complete market size. After that, data triangulation was used to estimate the market size of segments and subsegments.
Secondary Research
Secondary sources referred to for this research study included financial statements of companies offering cosmetic preservatives and information from various trade, business, and professional associations. Secondary research was used to obtain critical information about the industry’s value chain, the total pool of key players, market classification, and segmentation according to industry trends to the bottom-most level and regional markets. The secondary data was collected and analyzed to arrive at the overall size of the cosmetic preservatives market, which was validated by primary respondents.
Primary Research
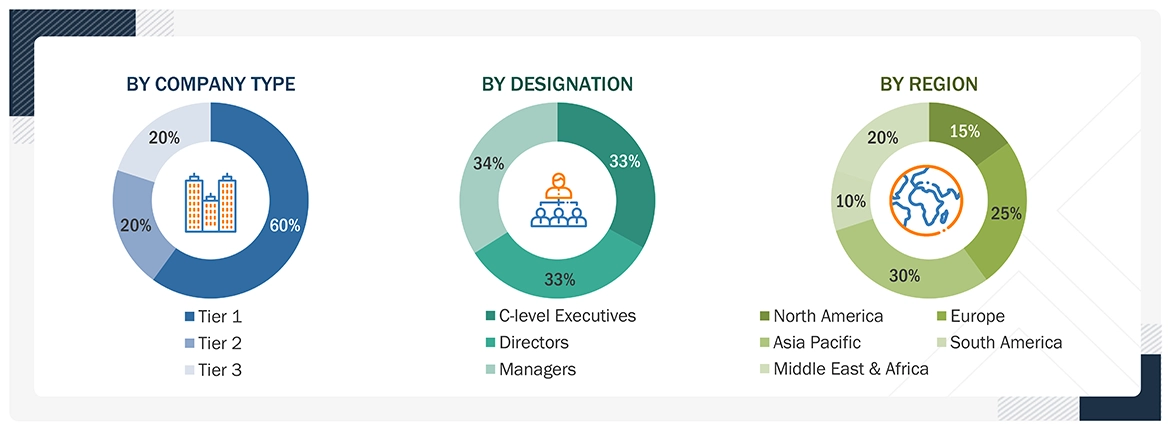
Extensive primary research was conducted after obtaining information regarding the cosmetic preservatives market scenario through secondary research. Several primary interviews were conducted with market experts from both the demand and supply sides across major countries of North America, Europe, the Asia Pacific, the Middle East & Africa, and South America. Primary data was collected through questionnaires, emails, and telephonic interviews. The primary sources from the supply side included various industry experts, such as Chief X Officers (CXOs), Vice Presidents (VPs), Directors from business development, marketing, product development/innovation teams, and related key executives from cosmetic preservatives industry vendors; system integrators; component providers; distributors; and key opinion leaders.
Primary interviews were conducted to gather insights such as market statistics, data on revenue collected from the products and services, market breakdowns, market size estimations, market forecasting, and data triangulation. Primary research also helped in understanding the various trends related to type, application, and region.
Stakeholders from the demand side, such as CIOs, CTOs, CSOs, and installation teams of the customers/end users who are using cosmetic preservatives, were interviewed to understand the buyer’s perspective on the suppliers, products, component providers, and their current usage of cosmetic preservatives and future outlook of their business, which would affect the overall market.
To know about the assumptions considered for the study, download the pdf brochure
Market Size Estimation
The research methodology used to estimate the size of the cosmetic preservatives market includes the following details. The market sizing was undertaken from the demand side. The market was upsized based on procurements and modernizations in cosmetic preservatives in different applications at a regional level. Such procurements provided information on the demand aspects of the cosmetic preservatives industry for each application. For each application, all possible segments of the cosmetic preservatives market were integrated and mapped.
Data Triangulation
After arriving at the overall size from the market size estimation process explained above, the total market was split into several segments and subsegments. The data triangulation and market breakdown procedures explained below were implemented, wherever applicable, to complete the overall market engineering process and arrive at the exact statistics for various market segments and subsegments. The data was triangulated by studying various factors and trends from the demand and supply sides. Along with this, the market size was validated using both the top-down and bottom-up approaches.
Market Definition
Preservatives are substances mainly used to prevent the formation of microorganisms across various products. Cosmetic preservatives are used in personal care products to prevent spoilage caused by microbial growth and thereby increase their shelf life.
Cosmetic preservatives are added to personal care products such as lotions, facemasks, sunscreens, shampoos, and others to prevent undesirable chemical changes or microbial growth. Without preservatives, products can become contaminated, which may lead to product spoilage and possibly cause infections.
Key Stakeholders
- Cosmetic preservatives manufacturers
- Raw material manufacturers
- Government and research organizations
- R&D institutions
- National and local government organizations
- Institutional investors
- Cosmetic preservatives supplier
- End users
Report Objectives
- To define, describe, and forecast the cosmetic preservatives market size in terms of volume and value
- To provide detailed information regarding the key factors, such as drivers, restraints, opportunities, and challenges influencing market growth
- To analyze and project the global cosmetic preservatives market by type, application, and region
- To forecast the market size concerning five main regions (along with country-level data), namely, North America, Europe, the Asia Pacific, the Middle East & Africa, and South America, and analyze the significant region-specific trends
- To strategically analyze micromarkets with respect to individual growth trends, prospects, and contributions of the submarkets to the overall market
- To analyze the market opportunities and the competitive landscape for stakeholders and market leaders
- To assess recent market developments and competitive strategies, such as agreements, contracts, acquisitions, and product developments/product launches, to draw the competitive landscape
- To strategically profile the key market players and comprehensively analyze their core competencies
Available customizations:
MarketsandMarkets offers the following customizations for this market report:
- Additional country-level analysis of the cosmetic preservatives market
Product Analysis
- Product matrix, which provides a detailed comparison of the product portfolio of each company’s market
Get the Full Cosmetic Preservatives Market Report
Full forecast, segment splits, and company analysis for all Cosmetic Preservatives Market.
- US Cosmetic Preservatives Market
- Canada Cosmetic Preservatives Market
- Mexico Cosmetic Preservatives Market
- Germany Cosmetic Preservatives Market
- France Cosmetic Preservatives Market
- UK Cosmetic Preservatives Market
- Italy Cosmetic Preservatives Market
- Spain Cosmetic Preservatives Market
- China Cosmetic Preservatives Market
- India Cosmetic Preservatives Market
- Japan Cosmetic Preservatives Market
- Turkey Cosmetic Preservatives Market
- South Africa Cosmetic Preservatives Market
- Brazil Cosmetic Preservatives Market
- Rest Of Europe Cosmetic Preservatives Market
- Rest Of Asia Pacific Cosmetic Preservatives Market
Need a Tailored Report?
Customize this report to your needs
Get 10% FREE Customization
Customize This Report
