
Nordics Data Center GPU Market (2025-2030)

The Nordics Data Center GPU Market was valued at $168.9 Million in 2025 and projected to reach to $581 Million by 2030, representing a compound annual growth rate of 28.0%. The Nordics data center GPU market is poised for sustained expansion through 2030, with market size growing from $168.9 million in 2025 to $581.0 million.


| Market Size in | USD 26.32 MN |
| Market Forecast in | |
| CAGR | |
| Forecast Period | |
| Units Considered | Value (USD MN) |
Nordics Data Center GPU Market Trends and Insights
- This robust expansion in the Nordics reflects the region's strategic position as a global hub for data center infrastructure, driven by abundant renewable energy resources, advanced cooling capabilities, and strong digital infrastructure investments.
- The Nordics' market trajectory significantly outpaces global averages, positioning the region as a critical growth engine for GPU-accelerated computing solutions. The Nordics data center GPU market benefits from substantial demand across AI, machine learning, and high-performance computing applications.
- Major technology companies and cloud service providers are increasingly establishing data center operations in the Nordics, leveraging the region's competitive advantages in energy efficiency and operational sustainability.
- Between 2025 and 2030, the Nordics will capture growing market share as enterprises prioritize GPU-accelerated workloads for advanced analytics and generative AI deployments..
Key Market Statistics
- CAGR (2025-2030) 28.0% CAGR
- Market Size, 2025 ~USD 168.9 Million
- Forecast, 2030 ~USD 581 Million
- Country Nordics
Nordics Data Center GPU Market Overview
Exceptional Growth Trajectory :
The Nordics data center GPU market is expanding at 28% CAGR, significantly outpacing the global rate of 13.7%, driven by region-specific advantages in infrastructure and energy efficiency.
Renewable Energy Advantage :
Abundant hydroelectric and wind power resources in Norway, Sweden, and Finland make the Nordics an ideal location for energy-intensive GPU data centers, reducing operational costs and environmental impact.
Advanced Cooling Infrastructure :
Nordic countries leverage natural cooling capabilities and sophisticated thermal management systems, enabling efficient GPU deployment and attracting major cloud and AI service providers to establish regional hubs.
Strategic Global Hub Position :
The Nordics serve as a critical gateway for European AI and machine learning workloads, with growing investments from hyperscalers and enterprises seeking reliable, sustainable data center solutions.
Nordics Data Center GPU Market Dynamics
- This exceptional 28% CAGR reflects increasing demand for AI infrastructure, machine learning capabilities, and high-performance computing across the region's enterprises and public sector organizations.
- The Nordic region's competitive advantages—including renewable energy abundance, superior cooling infrastructure, and political stability—position it as Europe's premier destination for GPU-intensive workloads. Key growth drivers include accelerating digital transformation initiatives, expanding cloud adoption among Nordic enterprises, and strategic investments by global hyperscalers establishing regional data center facilities.
- The region's commitment to sustainability and green computing aligns perfectly with enterprise ESG objectives, further attracting GPU infrastructure investments.
- As AI and generative AI applications proliferate across finance, healthcare, and manufacturing sectors, the Nordics will capture increasing market share from broader European demand..
Market Ecosystem
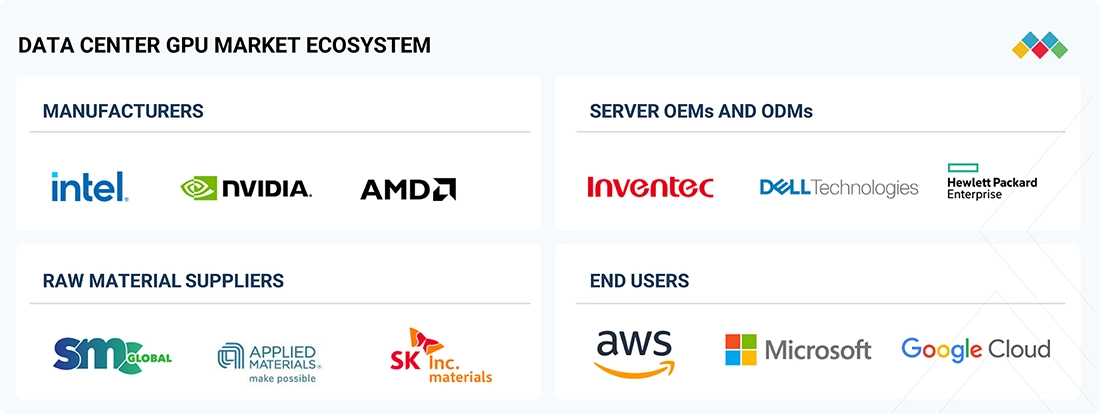
Data Center GPU Market Trends: COMMERCIAL USE CASES ACROSS INDUSTRIES
| COMPANY | USE CASE DESCRIPTION | BENEFITS |
|---|---|---|
 |
BEN Group utilized NVIDIA’s DGX A100 AI platform to accelerate large-scale data analysis, build predictive models, and detect fraud in influencer marketing campaigns | Reduced campaign costs, improved conversion rates, and accelerated data-driven decision-making through AI-powered insights |
|
|
Terray Therapeutics leveraged NVIDIA’s DGX Cloud and Base Command Platform to accelerate generative AI–driven small-molecule drug discovery | Accelerated model training, improved resource utilization, and faster discovery of optimized drug candidates through scalable generative AI infrastructure |
|
|
Siemens Healthineers implemented NVIDIA’s AI supercomputing infrastructure to automate and accelerate radiation therapy planning through intelligent organ segmentation | Reduced treatment planning time, improved workflow efficiency, and accelerated delivery of advanced, AI-driven oncology solutions |
|
|
GAC R&D Center utilized NVIDIA GPUs to accelerate CFD simulations and optimize vehicle aerodynamics for next-generation concept and production cars | Achieved record-low drag coefficients with 70% faster simulations and 60% reduced manual effort through GPU-accelerated CFD workflows |
|
|
Stone Ridge Technology partnered with Eni to deploy ECHELON 2.0, a GPU-optimized reservoir simulation platform, to accelerate large-scale geological modeling and forecasting | Reduced simulation runtimes from days to minutes, enabling faster, more detailed reservoir analysis and improved decision-making in energy exploration |
Logos and trademarks shown above are the property of their respective owners. Their use here is for informational and illustrative purposes only.
Related Ecosystem
Data Centre And Networking
- Software-Defined Networking (SDN)
- Mid-Sized Data Centers
- Small Data Centers
- Remote Monitoring
- Smart Healthcare
- Cisco Systems, Inc.
- HUAWEI TECHNOLOGIES CO LTD
- Hewlett Packard Enterprise Company
- MITSUBISHI ELECTRIC INFORMATION SYSTEMS CORPORATION
- MITSUBISHI ELECTRIC INFORMATION NETWORK CORPORATION
Electronics System And Components
- Sensors
- Temperature Sensors
- Pressure Sensors
- Actuators
- Image Sensors
- Lenovo
- Samsung
- Texas Instruments Incorporated
- HONEYWELL INTERNATIONAL INC.
- Teledyne Technologies Incorporated
Key Takeaways
- The Nordics data center GPU market will grow from $168.9M (2025) to $581.0M (2030) at a 28.0% CAGR, significantly outpacing global growth.
- The Nordics' renewable energy infrastructure and cooling advantages position the region as a preferred destination for GPU-intensive data center investments.
- AI and machine learning workloads are driving accelerated GPU adoption across the Nordics, with major cloud providers expanding regional capacity.
- The Nordics will represent a disproportionately large share of European GPU market growth through 2030, driven by sustainability and operational efficiency.
Data Center GPU Market Report Scope
| Report Metric | Details |
|---|---|
| Base Year | 2025 |
| Fastest Growing Segment | IAAS (Service Model) |
| Forecast Period | 2025-2030 |
| Growth Rate | CAGR of 13.7% from 2025 to 2030 |
| Largest Segment | INFERENCE (Function) |
| Market Size Base Year (Billions) | ~USD 120.2 (2025) |
| Revenue Forecast (Billions) | ~USD 228.4 (2030) |
| Segments Covered | Service Model, Deployment, Function, Application, Type, End User, Enterprise Type |
Nordics Data Center GPU Market Report Segmentation
7 segment dimensions are covered across the global market.
By Service Model
- IaaS
- PaaS
By Deployment
- Cloud
- Hybrid Cloud
- On-Premises
- Private Cloud
- Public Cloud
By Function
- Inference
- Training
By Application
- Computer Vision
- Generative AI
- Machine Learning
- Natural Language Processing
By Type
- Autoencoders
- Convolutional Neural Networks (Cnns)
- Deep Learning
- Generative Adversarial Networks (Gans)
- Rule-Based Models
- Statistical Models
- Transformer Models
By End User
- Cloud Service Providers
- Enterprises
- Government Organizations
By Enterprise Type
- Automotive
- Bfsi
- Healthcare
- Media & Entertainment
- Retail & E-Commerce
Target Audience
- GPU & Semiconductor Manufacturers : Need Nordic-specific demand forecasts and regional adoption patterns to optimize product positioning, supply chain planning, and sales strategies for Scandinavian data center operators and enterprises.
- Data Center Operators & Hyperscalers : Require detailed market sizing and growth projections to justify Nordic facility investments, assess competitive landscape, and identify partnership opportunities with local enterprises and cloud providers.
- Enterprise IT & Cloud Decision-Makers : Seek Nordic market insights to evaluate regional GPU infrastructure availability, pricing trends, and provider options for AI/ML workloads, ensuring optimal resource allocation and cost management.
- Investment & Private Equity Firms : Need comprehensive Nordic market analysis to evaluate investment opportunities in data center infrastructure, GPU technology providers, and AI computing ventures with strong regional growth potential.
- Technology Consultants & System Integrators : Require Nordic market intelligence to advise clients on GPU infrastructure solutions, competitive positioning, and technology roadmaps aligned with regional demand trends and sustainability requirements.
Reasons to Buy this Report
- Regional Market Sizing & Forecasts : Obtain precise market valuations specific to the Nordics ($168.9M in 2025, $581M in 2030) with detailed CAGR analysis, enabling accurate business planning and investment decisions tailored to Nordic market dynamics.
- Competitive Positioning Intelligence : Understand the Nordic GPU market's outperformance versus global trends (28% vs 13.7% CAGR), identifying unique regional opportunities and competitive advantages for market entry or expansion strategies.
- Infrastructure & Energy Insights : Access detailed analysis of Nordic renewable energy resources, cooling capabilities, and infrastructure advantages that differentiate the region, supporting site selection and operational efficiency planning.
- Demand Driver Analysis : Identify Nordic-specific growth catalysts including AI adoption rates, enterprise digital transformation initiatives, and hyperscaler investment patterns to prioritize market opportunities and partnerships.
- Strategic Investment Guidance : Leverage Nordic market intelligence to guide capital allocation decisions, facility planning, and go-to-market strategies for GPU infrastructure providers, cloud operators, and technology investors.
Frequently asked questions
What is the projected market size for data center GPUs in the Nordics by 2030?
The Nordics data center GPU market is forecast to reach $581.0 million by 2030, growing from $168.9 million in 2025.
What is the CAGR for the Nordics data center GPU market?
The Nordics data center GPU market is expected to grow at a compound annual growth rate of 28.0% between 2025 and 2030.
Why is the Nordics experiencing faster GPU market growth than the global average?
The Nordics benefits from abundant renewable energy, superior cooling infrastructure, strategic geographic positioning, and strong cloud provider investments, making it an attractive hub for GPU-intensive data centers.
Which applications are driving GPU demand in the Nordics?
AI, machine learning, high-performance computing, generative AI, and advanced analytics applications are the primary drivers of GPU adoption in the Nordics data center market.
How does the Nordics market compare to the global data center GPU market?
The Nordics 28.0% CAGR significantly exceeds the global 13.7% CAGR, indicating the region is capturing disproportionate market growth and investment in GPU infrastructure.
RESEARCH METHODOLOGY
The study involved four major activities in estimating the current size of the data center GPU market. Exhaustive secondary research was done to collect information on the market, peer, and parent markets. The next step was to validate these findings, assumptions, and sizing with industry experts across the value chain through primary research. Both top-down and bottom-up approaches were employed to estimate the complete market size. After that, market breakdown and data triangulation were used to estimate the market size of segments and subsegments.
Secondary Research
Various secondary sources have been referred to in the secondary research process to identify and collect important information for this study. The secondary sources include annual reports, press releases, and investor presentations of companies; white papers; journals and certified publications; and articles from recognized authors, websites, directories, and databases. Secondary research has been conducted to obtain critical information about the industry’s supply chain, the market’s value chain, the total pool of key players, market segmentation according to the industry trends (to the bottom-most level), regional markets, and key developments from market- and technology-oriented perspectives. The secondary data has been collected and analyzed to determine the overall market size, further validated by primary research.
Primary Research
Extensive primary research was conducted after gaining knowledge about the current scenario of the image sensor market through secondary research. Several primary interviews were conducted with experts from the demand and supply sides across four major regions: North America, Europe, the Asia Pacific, and the Rest of the World. This primary data was collected through questionnaires, emails, and telephonic interviews.
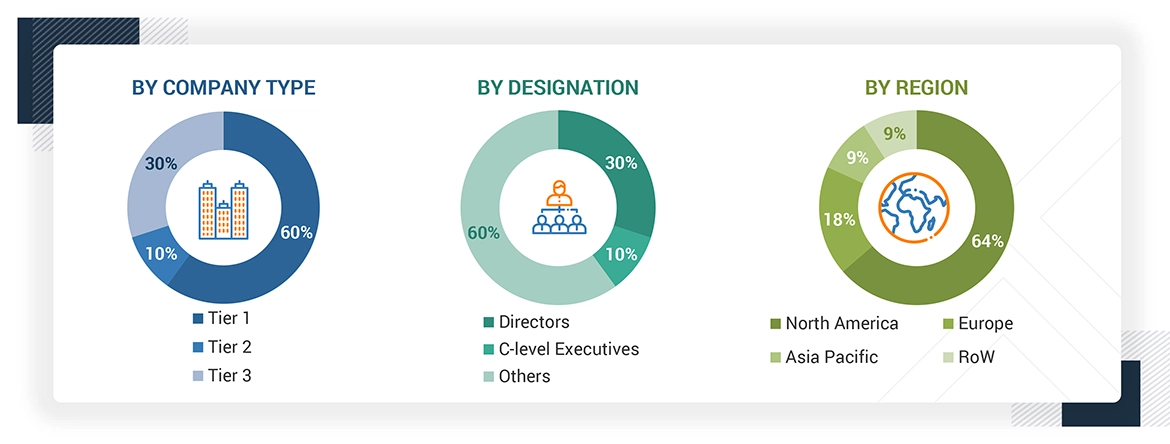
Note: Other designations include technology heads, media analysts, sales managers, marketing managers, and product managers.
Companies are classified into tiers based on their total revenues as of 2024?Tier 1: >USD 1 billion, Tier 2: USD 500 million–1 billion, and Tier 3: USD 500 million.
To know about the assumptions considered for the study, download the pdf brochure
Market Size Estimation
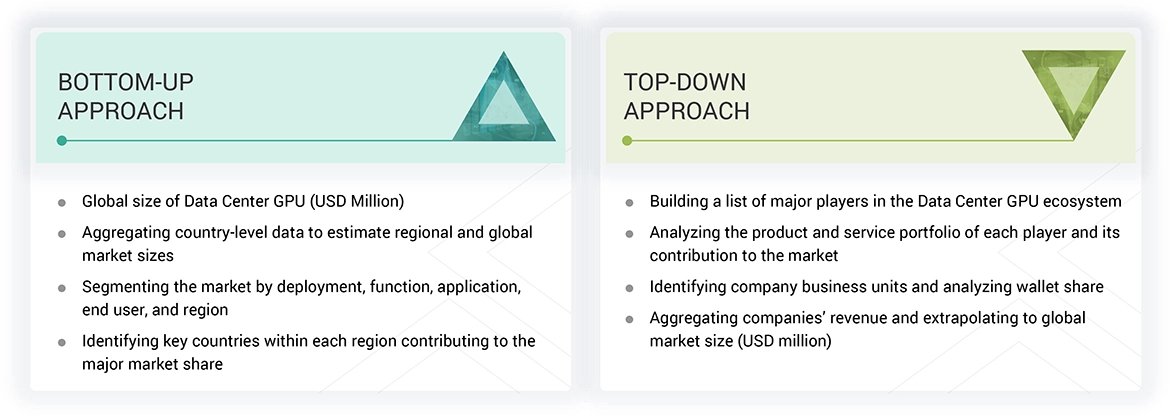
In the complete market engineering process, top-down and bottom-up approaches and several data triangulation methods have been used to estimate and forecast the overall market segments and subsegments listed in this report. Key players in the market have been identified through secondary research, and their market shares in the respective regions have been determined through primary and secondary research. This entire procedure includes the study of annual and financial reports of the top market players and extensive interviews for key insights (quantitative and qualitative) with industry experts (CEOs, VPs, directors, and marketing executives).
All percentage shares, splits, and breakdowns have been determined using secondary sources and verified through primary sources. All the parameters affecting the markets covered in this research study have been accounted for, viewed in detail, verified through primary research, and analyzed to obtain the final quantitative and qualitative data. This data has been consolidated and supplemented with detailed input and analysis from MarketsandMarkets and presented in this report. The following figure represents this study’s overall market size estimation process.
Bottom-Up Approach
- Identifying key participants that influence the entire market, along with the related component players
- Analyzing major manufacturers of data center GPUs, studying their portfolios, and understanding different types
- Analyzing trends pertaining to the use of data center GPUs in different kinds of industries
- Tracking the ongoing and upcoming developments in the market, such as investments, R&D activities, product/service launches, collaborations, and partnerships, and forecasting the market based on these developments and other critical parameters
- Carrying out multiple discussions with key opinion leaders to understand different types of data center GPU trends in the market, thereby analyzing the breakup of the scope of work carried out by major companies
- Arriving at the market estimates by analyzing the revenues of companies generated and then combining them to get the market estimate
- Segmenting the overall market into various other market segments
- Verifying and cross-checking the estimate at every level, from discussions with key opinion leaders such as CXOs, directors, and operations managers, and finally with the domain experts at MarketsandMarkets
- Studying various paid and unpaid sources of information, such as annual reports, press releases, white papers, and databases
Top-Down Approach
- Focusing initially on the top-line investments and expenditures being made in the ecosystem of the data center GPU market, splitting the key market areas based on type, function, end user, and region, and listing the key developments
- Identifying all leading players in the data center GPU market based on type, function, and end user through secondary research and fully verifying them through a brief discussion with Industry experts
- Analyzing revenues, product mix, geographic presence, and key applications served by all identified players to estimate and arrive at percentage splits for all key segments
- Discussing splits with industry experts to validate the information and identify key growth pockets across all key segments
- Breaking down the total market based on verified splits and key growth pockets across all segments
Data Center GPU Market : Top-Down and Bottom-Up Approach
Data Triangulation
After arriving at the overall market size using the market size estimation processes explained above, the market has been split into several segments and subsegments. Data triangulation and market breakdown procedures have been employed to complete the entire market engineering process and arrive at the exact statistics of each market segment and subsegment. The data has been triangulated by studying various factors and trends from the demand and supply sides in the data center GPU market.
Market Definition
A data center GPU is a specialized processor optimized for parallel processing in large-scale computing environments. It is used primarily to accelerate workloads such as artificial intelligence (AI) inference and training, high-performance computing (HPC), data analytics, and video processing in cloud and enterprise data centers.
Key Stakeholders
- Raw Material Suppliers
- Original Equipment Manufacturers (OEMs)
- Original Design Manufacturers (ODM) and Technology Solution Providers
- Research Institutes
- Data Center GPU Manufacturers
- Data Center GPU Forums, Alliances, and Associations
- Governments and Financial Institutions
- Analysts and Strategic Business Planners
Report Objectives
- To describe and forecast the data center GPU market by deployment, function, application, end user, and region.
- To forecast the data center GPU market by function in terms of volume
- To provide the market size estimation for North America, Europe, Asia Pacific, and the Rest of the World (RoW), along with their respective country-level market sizes, in terms of value
- To provide detailed information regarding drivers, restraints, opportunities, and challenges influencing market growth
- To provide a value chain analysis, ecosystem analysis, case study analysis, patent analysis, trade analysis, technology analysis, pricing analysis, key conferences and events, key stakeholders and buying criteria, Porter’s five forces analysis, investment and funding scenario, and regulations pertaining to the market.
- To strategically analyze micromarkets1 with regard to individual growth trends, prospects, and contributions to the total market
- To analyze opportunities for stakeholders by identifying high-growth segments of the market
- To strategically profile the key players, comprehensively analyze their market positions in terms of ranking and core competencies2, and provide a competitive market landscape
- To analyze strategic approaches, such as product launches, expansions, and partnerships, in the data center GPU market
- To analyze the impact of the macroeconomic outlook for each region
Customization Options:
With the given market data, MarketsandMarkets offers customizations according to the specific requirements of companies. The following customization options are available for the report:
- Detailed analysis and profiling of additional market players based on various blocks of the supply chain
Get the Full Data Center GPU Market Report
Full forecast, segment splits, and company analysis for all Data Center GPU Market.
- US Data Center GPU Market
- Canada Data Center GPU Market
- Mexico Data Center GPU Market
- UK Data Center GPU Market
- Germany Data Center GPU Market
- France Data Center GPU Market
- Spain Data Center GPU Market
- Italy Data Center GPU Market
- Poland Data Center GPU Market
- Rest Of Europe Data Center GPU Market
- China Data Center GPU Market
- Japan Data Center GPU Market
- India Data Center GPU Market
- South Korea Data Center GPU Market
- Australia Data Center GPU Market
- Vietnam Data Center GPU Market
- Thailand Data Center GPU Market
- Indonesia Data Center GPU Market
- Malaysia Data Center GPU Market
- Rest Of Asia Pacific Data Center GPU Market
- Saudi Arabia Data Center GPU Market
- UAE Data Center GPU Market
- Qatar Data Center GPU Market
- Kuwait Data Center GPU Market
- Bahrain Data Center GPU Market
- Oman Data Center GPU Market
- Rest Of The Middle East Data Center GPU Market
- South Africa Data Center GPU Market
- Other African Countries Data Center GPU Market
Need a Tailored Report?
Customize this report to your needs
Get 10% FREE Customization
Customize This Report
