
Asia Pacific Digital Signage Market (2026-2031)

The Asia Pacific Digital Signage Market was valued at $8052.6 Million in 2026 and projected to reach to $12864.4 Million by 2031, representing a compound annual growth rate of 8.1%. The Asia Pacific digital signage market is positioned for sustained growth through 2031, driven by rapid urbanization, increasing consumer spending, and digital transformation initiatives across major economies.


| Market Size in | USD 26.32 MN |
| Market Forecast in | |
| CAGR | |
| Forecast Period | |
| Units Considered | Value (USD MN) |
Asia Pacific Digital Signage Market Trends and Insights
- Asia Pacific's 8.1% compound annual growth rate outpaces the global average, driven by rapid urbanization, increasing retail modernization, and heightened demand for dynamic advertising solutions across the region.
- Major economies in Asia Pacific are investing heavily in smart city infrastructure and digital transformation initiatives, creating substantial opportunities for digital signage deployment in retail, transportation, hospitality, and corporate sectors. Asia Pacific's digital signage adoption is accelerated by technological advancements in LED displays, cloud-based content management systems, and AI-powered analytics.
- The region benefits from a large consumer base, growing middle-class populations, and competitive manufacturing capabilities that reduce deployment costs.
- Asia Pacific's strategic position as a global technology hub further strengthens its market position, with local vendors and international players competing to capture market share across diverse verticals and geographies..
Key Market Statistics
- CAGR (2026-2031) 8.1% CAGR
- Market Size, 2026 ~USD 8052.6 Million
- Forecast, 2031 ~USD 12864.4 Million
- Geography Asia Pacific
Asia Pacific Digital Signage Market Overview
Regional Growth Acceleration :
Asia Pacific's digital signage market is expanding at 8.1% CAGR, significantly outpacing the global average of 6.6%, reflecting the region's accelerated digital transformation and infrastructure investments.
Market Valuation Trajectory :
The market is valued at USD 8,052.6 million in 2026 and is projected to reach USD 12,864.4 million by 2031, representing a 59.8% increase over the five-year forecast period.
Urbanization & Retail Modernization :
Rapid urbanization across Asia Pacific economies is driving retail modernization initiatives, with businesses increasingly adopting dynamic digital signage solutions for enhanced customer engagement and brand visibility.
Advertising Innovation Demand :
Growing demand for dynamic advertising solutions across the region is fueling adoption of advanced digital signage technologies in retail, hospitality, transportation, and corporate sectors.
Asia Pacific Digital Signage Market Dynamics
- Retail modernization efforts, particularly in China, India, and Southeast Asia, are accelerating the deployment of interactive and dynamic signage solutions.
- The region's younger demographic and rising middle-class population are creating heightened demand for innovative advertising and customer experience solutions. Key growth catalysts include expanding e-commerce integration with physical retail, smart city development projects, and increased investment in transportation and hospitality infrastructure.
- As businesses prioritize omnichannel strategies and experiential marketing, digital signage adoption will continue to accelerate.
- The competitive landscape is intensifying with both regional and global players expanding their presence, driving technological innovation and competitive pricing in the Asia Pacific market..
Market Ecosystem
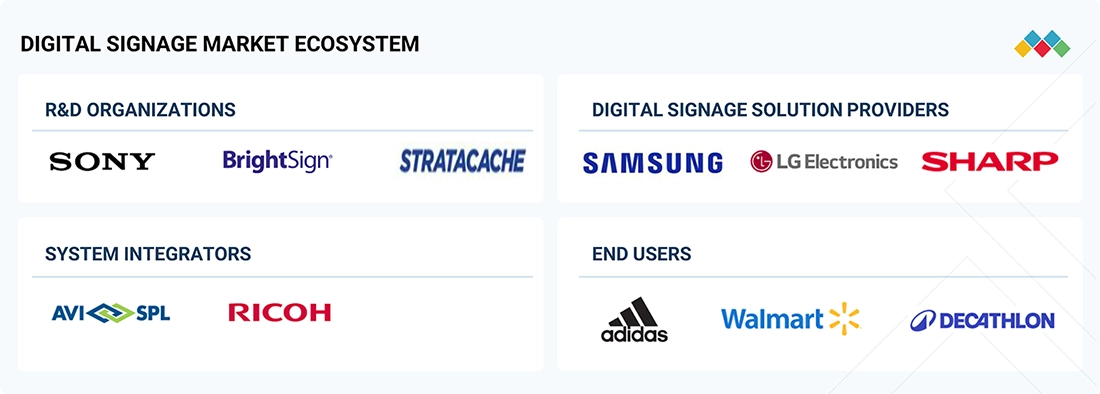
DIGITAL SIGNAGE MARKET SIZE, SHARE & GROWTH: COMMERCIAL USE CASES ACROSS INDUSTRIES
| COMPANY | USE CASE DESCRIPTION | BENEFITS |
|---|---|---|
 |
Provides large-format digital signage displays, video walls, and LED signage platforms used in retail stores, corporate offices, airports, and stadiums for dynamic advertising and real-time information display | High-resolution visuals, reliable performance, and scalable display networks for engaging customer communication |
 |
Offers OLED, LCD, and LED digital signage solutions with integrated content management platforms for retail, hospitality, healthcare, and transportation environments | Superior image quality, energy-efficient displays, and seamless remote content management |
 |
Develops professional digital signage displays and interactive touchscreens used in corporate, retail, and educational environments for presentations, promotions, and information sharing | Enhanced collaboration, clear visual communication, and durable commercial-grade displays |
 |
Provides professional digital signage displays, interactive screens, and AV solutions used in retail, transportation hubs, corporate environments, and entertainment venues for advertising, wayfinding, and real-time information delivery | High reliability, superior image quality, durable commercial displays, and seamless integration with professional AV and content management systems |
 |
Supplies fine-pitch LED video walls and large-scale digital signage displays for advertising, control rooms, entertainment venues, and smart city projects | Ultra-high brightness displays, seamless large-screen experiences, and strong visibility in indoor and outdoor environments |
Logos and trademarks shown above are the property of their respective owners. Their use here is for informational and illustrative purposes only.
Related Ecosystem
Display Technology
- Liquid Crystal Display (LCD)
- Sensors
- Virtual Reality Devices
- Augmented Reality
- Digital Light Processing (DLP)
- VIVITEK CORPORATION
- Samsung
- Lenovo
- Panasonic Holdings Corporation
- Lg corp
Key Takeaways
- Asia Pacific digital signage market will grow from USD 8,052.6M (2026) to USD 12,864.4M (2031) at 8.1% CAGR, outpacing global growth.
- Asia Pacific's rapid urbanization and smart city initiatives are primary catalysts for digital signage expansion across retail, transportation, and corporate sectors.
- Technological innovations in LED displays and AI-powered analytics are driving Asia Pacific adoption and enabling cost-effective deployment solutions.
- Asia Pacific's competitive manufacturing ecosystem and large consumer base position the region as a critical growth engine for the global digital signage market.
Digital Signage Market Report Scope
| Report Metric | Details |
|---|---|
| Base Year | 2026 |
| Fastest Growing Segment | SOFTWARE (Offering) |
| Forecast Period | 2026–2031 |
| Growth Rate | CAGR of 6.6% from 2026 to 2031 |
| Largest Segment | HARDWARE (Offering) |
| Market Size Base Year (Billions) | ~USD 21.06 (2026) |
| Revenue Forecast (Billions) | ~USD 29 (2031) |
| Segments Covered | Offering, Type, End Use |
Asia Pacific Digital Signage Market Report Segmentation
3 segment dimensions are covered across the global market.
By Offering
- Hardware
- Services
- Software
By Type
- Bfsi Institutions
- Consulting & Other Services
- Content Management Systems
- Corporate Offices
- Displays
- Edge Server Software
- Educational Institution
- Educational Institutions
- Government & Public Sector Institutions
- Healthcare Facilities
- Hospitality Facilities & Restaurants
- Installation
- Maintenance & Other Services
- Media Players
- Other Hardware
- Other Software Offerings
- Projectors
- Retail
- Sports & Entertainment Venues
- Transportation Hubs & Public Places
By End Use
- Commercial
- Industrial
- Infrastructural
- Institutional
Target Audience
- Regional Retailers & Brands : Retail chains and consumer brands operating across Asia Pacific need market intelligence to optimize digital signage investments, enhance customer experiences, and drive sales through modernized store environments.
- Digital Signage Manufacturers : Hardware and software providers require detailed Asia Pacific market data to identify growth opportunities, assess regional demand, benchmark competition, and develop localized product strategies.
- System Integrators & Solution Providers : Integration firms and service providers need comprehensive market insights to identify client opportunities, understand regional requirements, and develop Asia Pacific-specific service offerings.
- Investment & Private Equity Firms : Investors evaluating opportunities in Asia Pacific's digital signage ecosystem require market sizing, growth forecasts, and competitive analysis to support investment decisions and portfolio strategy.
- Corporate Real Estate & Facility Managers : Enterprise organizations managing facilities across Asia Pacific need market research to evaluate digital signage solutions, understand ROI potential, and plan technology infrastructure investments.
Key Companies in the Asia Pacific Digital Signage Market
| Company | HQ | Ownership | Strongest segments |
|---|---|---|---|
| QISDA CORPORATION | Taiwan | Public Company | Displays (Direct-view LED, LCD, OLED, E-paper),Projectors,Media Players, |
| VERIFONE | United States | Private Company | Kiosks,Menu Boards,Billboards & Video Walls, |
| BHARTI AIRTEL LIMITED | India | Public Company | Video Walls,Kiosks,Menu Boards, |
| ESTERLINE TECHNOLOGIES CORP | United States | Private Company | Video Walls,Kiosks,Menu Boards, |
| MICROSOFT CORPORATION | United States | Public Company | Content Management Software,Media Players,Kiosks, |
| WIPRO LIMITED | India | Public Company | Content Management Software & Integration,Media Players & IT Infrastructure,Displays (Direct-view LED, LCD, OLED, E-paper), |
| SYNNEX CORPORATION | United States | Public Company | Video Walls,Kiosks,Menu Boards, |
| KORE WIRELESS GROUP | United States | Public Company | Video Walls,Kiosks,Menu Boards, |
| VALENS | Israel | Public Company | Video Walls,Kiosks,Menu Boards, |
| TRUE CORPORATION PUBLIC COMPANY LIMITED | United States | Public Company | Video Walls,Kiosks,Menu Boards, |
| CORETRONIC CORPORATION | Taiwan | Public Company | Projectors (signage use cases),Displays (LCD, backlight-based, medical and intelligent displays),Media players and content / intelligent cloud platforms, |
| LENOVO | China | Public Company | Video Walls,Kiosks,Menu Boards, |
| L&T TECHNOLOGY SERVICES LIMITED | India | Public Company | Video Walls,Kiosks,Menu Boards, |
| SAMSUNG | South Korea | Public Company | Video Walls,Kiosks,Menu Boards, |
| LG ELECTRONICS | South Korea | Public Company | Video Walls,Kiosks,Menu Boards, |
| SHARP CORPORATION | Japan | Public Company | Video Walls,Kiosks,Menu Boards, |
| LEYARD | China | Public Company | Video Walls (dvLED and LCD),Billboards & Outdoor LED (including naked-eye 3D, smart poles),Kiosks & Menu Boards, |
| SONY GROUP CORPORATION | Japan | Public Company | Professional Displays (Direct-view LED, LCD, OLED, E-paper),Projectors,Media Players & Integrated SoC, |
| BARCO | Belgium | Public Company | Video Walls,Projectors,Displays (Direct-view LED, LCD, OLED, E-paper), |
| PANASONIC HOLDINGS CORPORATION | Japan | Public Company | Video Walls,Kiosks,Menu Boards, |
| AUO CORPORATION | Taiwan | Public Company | Video Walls,Kiosks,Menu Boards, |
| DAKTRONICS | United States | Public Company | Video Walls,Billboards,Kiosks, |
| DELTA ELECTRONICS, INC. | Taiwan | Public Company | Video Walls,Projectors,Kiosks & Menu Boards, |
QISDA CORPORATION
QISDA Corporation is a Taiwanese public company established in 1984 with 14,375 employees. It operates in the electronics and technology manufacturing sector.
VERIFONE
VeriFone is a United States-based private company founded in 1981 with 5,600 employees. The company specializes in payment and point-of-sale solutions.
BHARTI AIRTEL LIMITED
Bharti Airtel Limited is an Indian public company founded in 1995 with 28,730 employees. It is a major telecommunications and mobile services provider.
ESTERLINE TECHNOLOGIES CORP
Esterline Technologies Corp is a United States private company established in 1967 with 12,609 employees. The company operates in aerospace and defense technology.
MICROSOFT CORPORATION
Microsoft Corporation is a United States public company founded in 1975 with 228,000 employees. It is a global leader in software, cloud computing, and technology services.
WIPRO LIMITED
Wipro Limited is an Indian public company founded in 1945 with 240,000 employees. It is a major provider of information technology, consulting, and business process services.
SYNNEX CORPORATION
SYNNEX Corporation is a United States public company founded in 1980 with 24,000 employees. It is a leading distributor of information technology products and services.
KORE WIRELESS GROUP
KORE Wireless Group is a United States public company founded in 2002 with 403 employees. The company provides wireless connectivity and IoT solutions.
VALENS
Valens is an Israeli public company founded in 2006 with 233 employees. The company develops semiconductor and connectivity solutions.
TRUE CORPORATION PUBLIC COMPANY LIMITED
True Corporation Public Company Limited is a United States-based public company founded in 1990. The company operates in the telecommunications and media sectors.
CORETRONIC CORPORATION
Coretronic Corporation is a Taiwanese public company founded in 1992. The company specializes in display and projection technology.
LENOVO
Lenovo is a Chinese public company founded in 1984. It is a global leader in personal computers, servers, and technology solutions.
L&T TECHNOLOGY SERVICES LIMITED
L&T Technology Services Limited is an Indian public company founded in 2012 with 21,039 employees. The company provides engineering and technology services.
SAMSUNG
Samsung is a South Korean public company founded in 1969 with 128,735 employees. It is a global conglomerate operating in electronics, semiconductors, and consumer goods.
LG ELECTRONICS
LG Electronics is a South Korean public company founded in 1958 with 34,884 employees. The company manufactures consumer electronics, displays, and home appliances.
SHARP CORPORATION
Sharp Corporation is a Japanese public company founded in 1912 with 34,549 employees. The company operates in electronics, displays, and solar energy solutions.
LEYARD
Leyard is a Chinese public company founded in 1995 with 4,405 employees. The company specializes in LED display and digital signage technology.
SONY GROUP CORPORATION
Sony Group Corporation is a Japanese public company founded in 1946 with 94,900 employees. It is a global leader in electronics, entertainment, and gaming.
BARCO
Barco is a Belgian public company founded in 1934 with 2,927 employees. The company specializes in visualization and display technology solutions.
PANASONIC HOLDINGS CORPORATION
Panasonic Holdings Corporation is a Japanese public company founded in 1918 with 183,685 employees. It is a global manufacturer of electronics, appliances, and industrial solutions.
AUO CORPORATION
AU Optronics Corporation is a Taiwanese public company founded in 1996 with 43,000 employees. The company is a leading manufacturer of display panels and LCD technology.
DAKTRONICS
Daktronics is a United States public company founded in 1968 with 2,558 employees. The company designs and manufactures electronic displays and control systems.
DELTA ELECTRONICS, INC.
Delta Electronics, Inc. is a Taiwanese public company founded in 1971 with 85,684 employees. The company manufactures power supplies, thermal management, and industrial automation solutions.
Countries within Asia Pacific - compare and drill down
| Country | 2025 size (native) |
|---|
Country market size visualization
Reasons to Buy this Report
- Regional Market Insights : Gain comprehensive understanding of Asia Pacific-specific market dynamics, including country-level analysis of major economies driving growth in digital signage adoption and deployment.
- Competitive Landscape Analysis : Identify key regional and global players operating in Asia Pacific, their market positioning, strategic initiatives, and competitive advantages in this high-growth market segment.
- Investment & Expansion Strategy : Leverage detailed market forecasts and growth drivers to inform investment decisions, market entry strategies, and expansion plans specific to Asia Pacific opportunities through 2031.
- Sector-Specific Opportunities : Understand vertical-specific demand patterns across retail, hospitality, transportation, and corporate sectors in Asia Pacific to identify high-potential business segments and applications.
- Technology & Innovation Trends : Stay informed on emerging technologies, consumer preferences, and innovation trends shaping the Asia Pacific digital signage market to maintain competitive advantage in the region.
Frequently asked questions
What is the current size of the Asia Pacific digital signage market?
The Asia Pacific digital signage market is valued at USD 8,052.6 million in 2026 and is expected to reach USD 12,864.4 million by 2031.
What is the growth rate of the Asia Pacific digital signage market?
Asia Pacific's digital signage market is growing at a compound annual growth rate (CAGR) of 8.1% from 2026 to 2031, exceeding the global average.
Which sectors are driving digital signage adoption in Asia Pacific?
Key sectors driving Asia Pacific digital signage adoption include retail, transportation, hospitality, corporate offices, and smart city infrastructure projects.
What technologies are accelerating Asia Pacific digital signage growth?
Advanced LED displays, cloud-based content management systems, AI-powered analytics, and IoT integration are primary technologies accelerating Asia Pacific market expansion.
Why is Asia Pacific outperforming the global digital signage market?
Asia Pacific outperforms globally due to rapid urbanization, large consumer populations, competitive manufacturing costs, smart city investments, and strong digital transformation initiatives across the region.
RESEARCH METHODOLOGY
The research study involved four major activities in estimating the digital signage market size. Exhaustive secondary research has been done to collect important information about the market and peer markets. The next step has been to validate these findings and assumptions and size them with the help of primary research with industry experts across the value chain. Both top-down and bottom-up approaches have been used to estimate the market size. The market breakdown and data triangulation have been adopted to estimate the market sizes of segments and sub-segments.
Secondary Research
In the secondary research process, various secondary sources were referred to identify and collect information required for this study. The secondary sources include annual reports, press releases, investor presentations of companies, white papers, and articles from recognized authors. Secondary research has been mainly done to obtain key information about the market’s value chain, the pool of key market players, market segmentation according to industry trends, regional outlook, and developments from both market and technology perspectives.
Primary Research
In primary research, various sources from both the supply and demand sides have been interviewed to obtain the qualitative and quantitative insights required for this report. Primary sources from the supply side include experts such as CEOs, vice presidents, marketing directors, manufacturers, technology and innovation directors, end users, and related executives from multiple key companies and organizations operating in the digital signage market ecosystem. After interacting with industry experts, brief sessions were conducted with highly experienced independent consultants to reinforce the findings from our primary research. This, along with the in-house subject matter experts’ opinions, has led us to the findings as described in the report. The breakdown of primary respondents is as follows:
Breakdown of Primaries
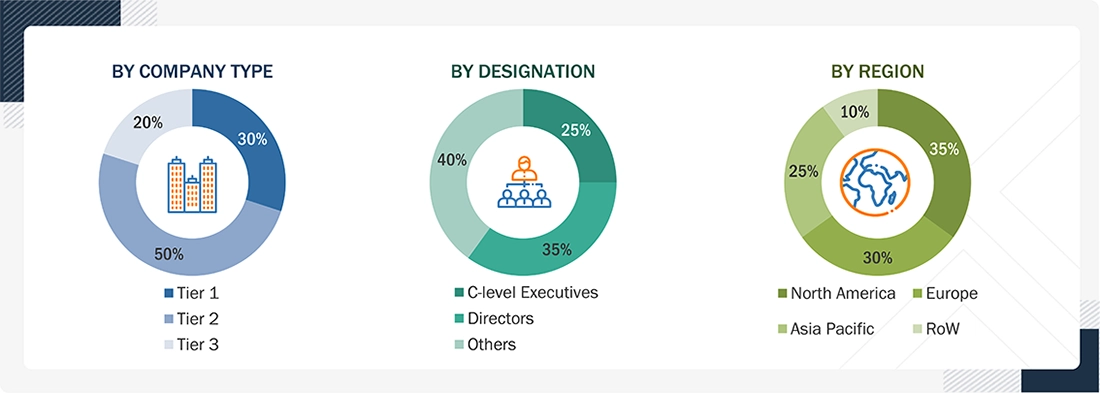
Note: “Others” includes sales, marketing, and product managers.
To know about the assumptions considered for the study, download the pdf brochure
Market Size Estimation
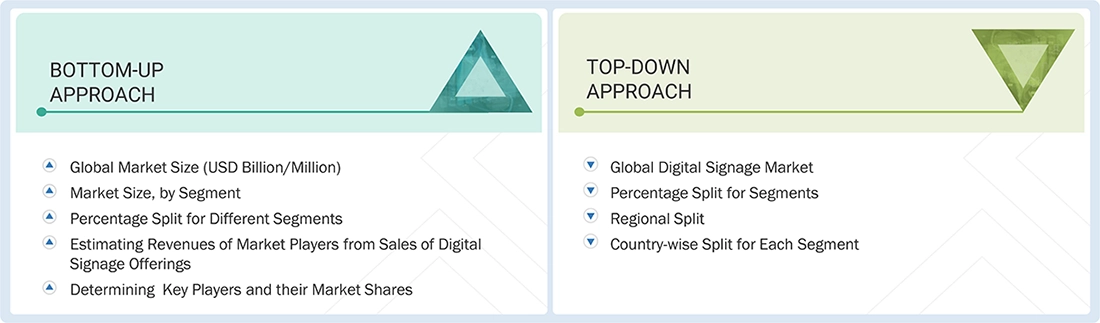
In the market engineering process, both top-down and bottom-up approaches and data triangulation methods have been used to estimate and validate the size of the digital signage market and other dependent submarkets. The research methodology used to estimate the market sizes includes the following:
- The bottom-up procedure has been employed to arrive at the overall size of the digital signage market.
- Major companies that provide digital signage were identified. This included analyzing company portfolios, product offerings, and presence across various regions.
- The segment-specific revenues of the companies, particularly those related to digital signage, were determined.
- The product-specific revenues of the companies, particularly those related to digital signage, were determined.
- These individual revenue figures were compiled to determine the total revenue generated across the identified companies within the sector.
- The global market size for digital signage was obtained using this consolidated data.
The top-down approach has been used to estimate and validate the total size of the digital signage market.
- Identified top-line investments and spending in the ecosystem and major market developments to consider segment-level splits
- Estimated the overall digital signage market size, then segmented the global market by allocating shares based on the segments considered
- Distributed the segment-level markets into regions and countries by aligning regional digital signage activity with economic indicators, digital signage manufacturing presence, and national development initiatives
Data Triangulation
After arriving at the overall market size using the market size estimation processes as explained above, the market has been split into several segments and subsegments. Data triangulation and market breakdown procedures have been employed to complete the entire market engineering process and arrive at the exact statistics of each market segment and subsegment. The data has been triangulated by studying various factors and trends from the demand and supply sides of the digital signage market.
Market Definition
The digital signage market encompasses the design, development, and deployment of digital display solutions used to deliver dynamic visual content, information, and advertising across commercial and public environments. These systems utilize advanced display technologies such as LCD, LED, OLED, and microLED screens integrated with media players, connectivity modules, and content management software to enable real-time content updates, remote management, and targeted messaging. Digital signage solutions support applications such as advertising, promotions, wayfinding, corporate communication, and public information displays across retail stores, transportation hubs, hospitality venues, healthcare facilities, educational institutions, and smart city infrastructure. Market growth is driven by increasing demand for data-driven advertising, interactive customer engagement, and centralized content control across large display networks. Advancements in high-resolution displays, cloud-based content management systems, AI-driven analytics, IoT connectivity, and energy-efficient display technologies are enhancing operational flexibility, audience targeting, and scalability, positioning digital signage as a critical communication and marketing tool in modern digital ecosystems.
Stakeholders
- Display Panel Manufacturers
- Display Material and Component Suppliers
- Manufacturing Equipment Suppliers
- System Integrators/OSAT Vendors
- Digital Signage Providers
- Digital Signage Hardware Providers
- Digital Signage Software Providers
- Technology/IP Developers
- Consulting and Market Research Service Providers
- Display and Material-related Associations, Organizations, Forums, and Alliances
- Venture Capitalists and Startups
- Research and Educational Institutes
- Distributors and Resellers
- End Users
Report Objectives
- To define, describe, segment, and forecast the digital signage market size by offering, product type, display size, installation location, application, enterprise size, end use, and region, in terms of value
- To evaluate the digital signage market size in four key regions: North America, Europe, Asia Pacific, and RoW, in terms of value
- To provide detailed information regarding the key factors such as drivers, restraints, opportunities, and challenges influencing the growth of the market
- To analyze the digital signage value chain and ecosystem, along with the average selling price for the product type and region segment
- To strategically study the regulatory landscape, tariffs, standards, patents, Porter’s Five Forces, import and export scenarios, trade values, and case studies pertaining to the market under study
- To understand micromarkets1 with regard to individual growth trends, prospects, and contributions to the overall market
- To offer the impact of AI/Gen AI on the digital signage market
- To outline the macroeconomic outlook for the regions under study
- To analyze strategies such as product launches, collaborations, acquisitions, and partnerships adopted by players in the digital signage market
- To profile key market players and comprehensively analyze their ranking based on their revenue, market share, and core competencies2
Get the Full Digital Signage Market Report
Full forecast, segment splits, and company analysis for all Digital Signage Market.
- US Digital Signage Market
- Canada Digital Signage Market
- Mexico Digital Signage Market
- Germany Digital Signage Market
- UK Digital Signage Market
- France Digital Signage Market
- Italy Digital Signage Market
- Spain Digital Signage Market
- Netherlands Digital Signage Market
- Belgium Digital Signage Market
- Nordic Countries Digital Signage Market
- Rest Of Europe Digital Signage Market
- China Digital Signage Market
- Japan Digital Signage Market
- India Digital Signage Market
- South Korea Digital Signage Market
- Australia Digital Signage Market
- Southeast Asia Digital Signage Market
- Rest Of Asia Pacific Digital Signage Market
- Saudi Arabia Digital Signage Market
- UAE Digital Signage Market
- Qatar Digital Signage Market
- Kuwait Digital Signage Market
- Bahrain Digital Signage Market
- Oman Digital Signage Market
- Rest Of Middle East Digital Signage Market
- Brazil Digital Signage Market
- Argentina Digital Signage Market
- Rest Of South America Digital Signage Market
- South Africa Digital Signage Market
- Rest Of Africa Digital Signage Market
Need a Tailored Report?
Customize this report to your needs
Get 10% FREE Customization
Customize This Report
