
North America Display Module Market (2026-2031)

The North America Display Module Market was valued at $38070 Million in 2026 and projected to reach to $43690 Million by 2031, representing a compound annual growth rate of 2.3%. North America's display module market is positioned for steady growth, expanding from $38,070 million in 2026 to $43,690 million by 2031 at a 2.3% CAGR.


| Market Size in | USD 26.32 MN |
| Market Forecast in | |
| CAGR | |
| Forecast Period | |
| Units Considered | Value (USD MN) |
North America Display Module Market Trends and Insights
- This steady expansion reflects North America's continued demand for advanced display technologies across consumer electronics, automotive, and industrial applications.
- North America maintains a mature yet dynamic market landscape, driven by technological innovation and replacement cycles in established sectors. The North America display module market benefits from strong infrastructure, high consumer spending, and significant R&D investments from leading manufacturers.
- North America's growth trajectory through 2031 is supported by increasing adoption of high-resolution displays, flexible screen technologies, and integration of displays in emerging applications such as augmented reality and smart automotive systems.
- Despite moderate growth compared to emerging markets, North America remains a critical hub for display module innovation and premium product development..
Key Market Statistics
- CAGR (2026-2031) 2.3% CAGR
- Market Size, 2026 ~USD 38070 Million
- Forecast, 2031 ~USD 43690 Million
- Geography North America
North America Display Module Market Overview
Mature Market Leadership :
North America commands a significant share of the global display module market, driven by established consumer electronics manufacturers, automotive OEMs, and technology innovators concentrated in the US, Canada, and Mexico.
Automotive Display Integration :
The region's automotive sector is accelerating adoption of advanced display modules for infotainment systems, digital dashboards, and autonomous vehicle interfaces, supporting steady market growth through 2031.
Consumer Electronics Demand :
Sustained demand from North American consumers for high-resolution displays in smartphones, tablets, laptops, and smart home devices continues to drive module innovation and manufacturing investments.
Industrial & Commercial Applications :
Growing deployment of display modules in industrial automation, retail signage, medical devices, and enterprise solutions reflects North America's diversified end-user base beyond consumer segments.
North America Display Module Market Dynamics
- This measured growth trajectory reflects the region's mature market characteristics, where incremental technological advancements and application diversification drive demand rather than explosive expansion.
- The market benefits from strong R&D capabilities, established supply chains, and high consumer purchasing power across the US, Canada, and Mexico. Key growth catalysts include the automotive industry's digital transformation, increasing adoption of edge computing displays, and emerging applications in augmented reality and flexible display technologies.
- While North America's growth rate trails the global average of 2.6%, the region maintains premium market positioning through innovation leadership and high-value display solutions.
- Strategic investments in next-generation display technologies and manufacturing capabilities will sustain competitive advantage through 2031..
Market Ecosystem
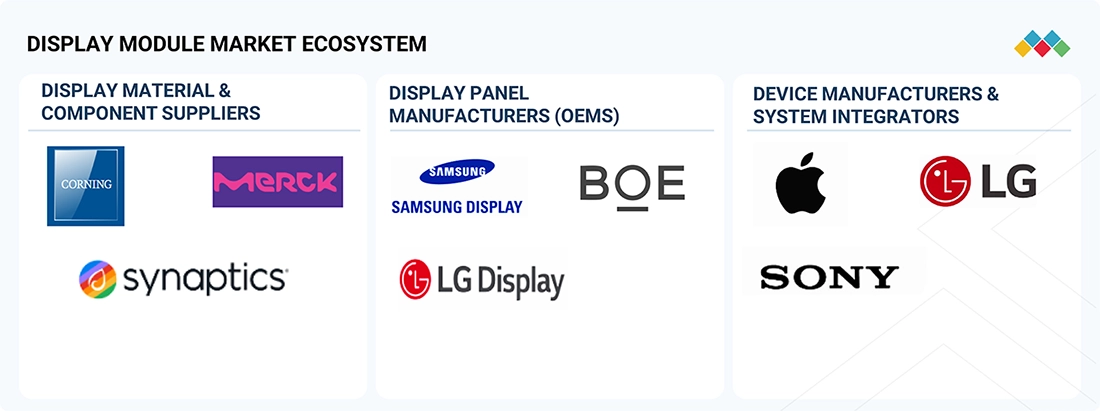
DISPLAY MODULE MARKET: COMMERCIAL USE CASES ACROSS INDUSTRIES
| COMPANY | USE CASE DESCRIPTION | BENEFITS |
|---|---|---|
 |
Expanding OLED, AMOLED, and foldable display modules for smartphones, automotive displays, IT devices, and XR applications, with a focus on thinner, energy-efficient, and high-performance modules | Enhanced display quality and power efficiency | Advanced flexible display solutions | Stronger premium product positioning |
 |
Increasing production of OLED, Mini-LED, and flexible display modules while expanding manufacturing capacity for consumer electronics, automotive, and industrial applications | Higher production scalability | Improved display module performance | Expanded customer reach |
 |
Developing OLED and large-format display modules for TVs, automotive, gaming, and commercial applications with enhanced brightness, durability, and energy efficiency | Superior visual performance | Improved energy efficiency | Broader adoption in premium and automotive applications |
Logos and trademarks shown above are the property of their respective owners. Their use here is for informational and illustrative purposes only.
Related Ecosystem
Display Technology
- Augmented Reality
- Liquid Crystal Display (LCD)
- Sensors
- Virtual Reality Devices
- Liquid Crystal on Silicon (LCOS)
- VIVITEK CORPORATION
- Samsung
- Lenovo
- Panasonic Holdings Corporation
- Lg corp
Key Takeaways
- North America's display module market reaches $38.07B in 2026 and grows to $43.69B by 2031 at a 2.3% CAGR.
- North America's mature market is driven by replacement cycles, technological innovation, and premium product demand.
- North America leads in R&D investment and adoption of advanced technologies including flexible displays and AR integration.
- North America's steady growth reflects stable consumer spending and strong infrastructure supporting display module applications.
Display Module Market Report Scope
| Report Metric | Details |
|---|---|
| Base Year | 2026 |
| Fastest Growing Segment | MICROLED (Display Technology) |
| Forecast Period | 2026-2031 |
| Growth Rate | CAGR of 2.6% from 2026 to 2031 |
| Largest Segment | ELECTRONIC (NON-OPTICAL) (Type) |
| Market Size Base Year (Billions) | ~USD 137 (2026) |
| Revenue Forecast (Billions) | ~USD 155.76 (2031) |
| Segments Covered | Type, Display Technology, Display Type, Product Type, Technology, Electronic Type, End Use, Display Size |
North America Display Module Market Report Segmentation
8 segment dimensions are covered across the global market.
By Type
- Electronic (Non-Optical)
- Optical
- Other Non-Optical Module-Based Products
- Smartphones
- Tablets, Monitors & Laptops
By Display Technology
- Dlp
- E-Paper
- Laser Beam Scanning
- Laser-Beam Scanning
- Lcd
- Lcos
- Led
- Microled
- Oled
- Oledos
- Other Optical Display Technologies
- Tft Lcd
By Display Type
- Ar
- Vr & Mr
By Product Type
- Hmds
- Huds
- Other Non-Optical Module-Based Products
- Smartphones
- Tablets, Monitors & Laptops
By Technology
- Dlp
- Laser Beam Scanning
- Oled
By Electronic Type
- Other Non-Optical Module-Based Products
- Smartphones
- Tablets, Monitors & Laptops
- Tablets, Monitors, & Laptops
By End Use
- Aerospace & Defense
- Automotive
- Consumer Electronics
- Education
- Healthcare
- Industrial
- Other End Uses
- Retail, Hospitality & Bfsi
- Sports & Entertainment
- Transportation
By Display Size
- 0.5-1 Inch
- Less Than 0.5 Inch
- Microdisplays
- More Than 1 Inch
- More Than 9 Inches
- Up To 9 Inches
Target Audience
- Display Module Manufacturers : Manufacturers need North America-specific market data to optimize production capacity, identify growth opportunities in automotive and industrial segments, and benchmark competitive positioning against regional rivals.
- Automotive OEMs & Suppliers : Automotive companies require detailed insights into display module demand trends, technology preferences, and supply chain dynamics to support vehicle electrification and autonomous driving initiatives across North America.
- Consumer Electronics Companies : Electronics manufacturers and brands need regional market forecasts to guide product launches, display technology selection, and sourcing strategies for smartphones, tablets, and smart devices sold in North America.
- Investment & Private Equity Firms : Investors evaluating acquisition targets, expansion opportunities, or portfolio companies in the display module sector require North America market analysis to assess growth potential and valuation benchmarks.
- Technology & Strategy Consultants : Consulting firms advising clients on market entry, competitive strategy, or technology roadmaps need authoritative North America display module data to support client recommendations and strategic planning.
Countries within North America - compare and drill down
| Country | 2025 size (native) |
|---|---|
| US | USD 2482.3 Million |
| Canada | USD 553.2 Million |
| Mexico | USD 225.8 Million |
Country market size visualization
Reasons to Buy this Report
- Country-Level Market Segmentation : Access detailed market sizing and growth projections for the US, Canada, and Mexico individually, enabling precise market entry strategies and regional investment decisions tailored to each North American economy.
- Competitive Landscape Intelligence : Understand the competitive dynamics specific to North America's display module ecosystem, including key manufacturers, technology leaders, and market consolidation trends shaping the region's future.
- End-Use Application Analysis : Gain insights into North America's unique demand drivers across consumer electronics, automotive, industrial, and commercial sectors, with forecasts aligned to regional industry growth patterns.
- Technology Adoption Trends : Identify emerging display technologies gaining traction in North America, including flexible displays, high-refresh-rate modules, and automotive-grade solutions, with adoption timelines and market impact assessments.
- Strategic Planning & Investment Guidance : Leverage North America-specific market data to inform product development roadmaps, manufacturing location decisions, partnership strategies, and capital allocation across the region through 2031.
Frequently asked questions
What is the current size of North America's display module market?
North America's display module market is valued at $38,070 million in 2026, representing a significant portion of global display module demand.
What is the projected market size for North America's display modules by 2031?
North America's display module market is forecast to reach $43,690 million by 2031, reflecting a 2.3% compound annual growth rate over the five-year period.
What growth rate is North America's display module market expected to achieve?
North America's display module market is expected to grow at a 2.3% CAGR from 2026 to 2031, indicating steady but moderate expansion in this mature region.
Which sectors drive demand for display modules in North America?
North America's display module demand is driven by consumer electronics, automotive applications, industrial displays, and emerging technologies such as augmented reality and smart devices.
Why is North America's display module growth rate lower than global averages?
North America's 2.3% CAGR reflects a mature, saturated market with established replacement cycles, whereas global growth is accelerated by rapid adoption in emerging economies.
RESEARCH METHODOLOGY
The study involved four major activities in estimating the current size of the display module market. Exhaustive secondary research was conducted to gather information on the market, adjacent markets, and the overall high-end refractometer landscape. These findings, along with assumptions and projections, were validated through primary research involving interviews with industry experts and key stakeholders across the value chain. Both top-down and bottom-up approaches were utilized to estimate the overall market size. Subsequently, market breakdown and data triangulation techniques were applied to determine the sizes of various segments and subsegments. Two key sources, secondary and primary, were leveraged to conduct a comprehensive technical and commercial assessment of the display module market.
Secondary Research
The secondary research process referred to various secondary sources to identify and collect necessary information for this study. The secondary sources included annual reports, press releases, and investor presentations of companies; white papers; journals and certified publications; and articles from recognized authors, websites, directories, and databases. Secondary research was conducted to obtain key information about the industry’s supply chain, the market’s value chain, the total pool of key players, market segmentation according to the industry trends (to the bottom-most level), regional markets, and key developments from market- and technology-oriented perspectives. The secondary data was collected and analyzed to determine the overall market size, which is further validated through primary research.
Primary Research
Extensive primary research was conducted after gaining knowledge about the current scenario of the display module market through secondary research. Several primary interviews were conducted with experts from the demand and supply sides across five major regions—North America, Europe, Asia Pacific, and the RoW. This primary data was collected through questionnaires, emails, and telephonic interviews.
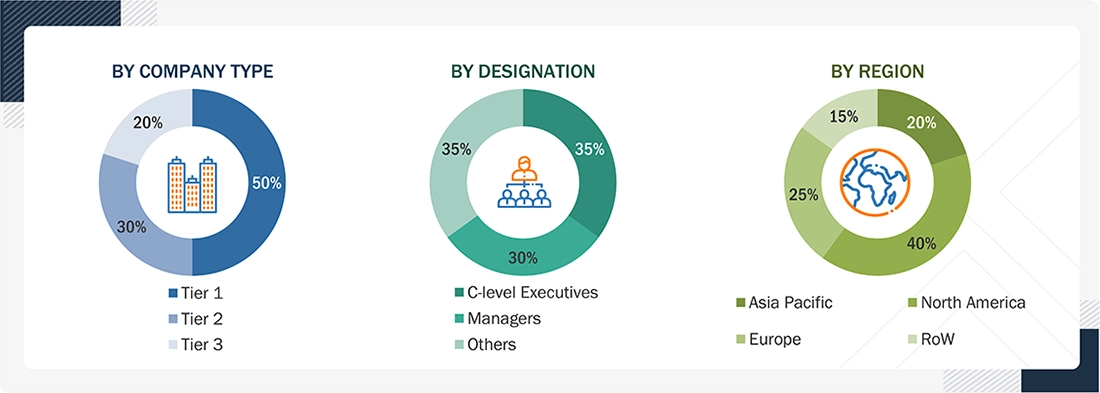
Notes: The three tiers of companies have been defined based on their total revenue as of 2025. The categorization given below has been applied:
To know about the assumptions considered for the study, download the pdf brochure
Market Size Estimation
In the complete market engineering process, top-down and bottom-up approaches and several data triangulation methods were used to estimate and forecast the overall market segments and subsegments listed in this report. Key players in the market were identified through secondary research, and their market shares in the respective regions were determined through primary and secondary research. This entire procedure included the study of annual and financial reports of the top market players and extensive interviews for key insights (quantitative and qualitative) with industry experts (CEOs, VPs, directors, and marketing executives).
All percentage shares, splits, and breakdowns were determined using secondary sources and verified through primary sources. All the parameters affecting the markets covered in this research study were accounted for, viewed in detail, verified through primary research, and analyzed to obtain the final quantitative and qualitative data. This data was consolidated and supplemented with detailed inputs and analysis from MarketsandMarkets and presented in this report.
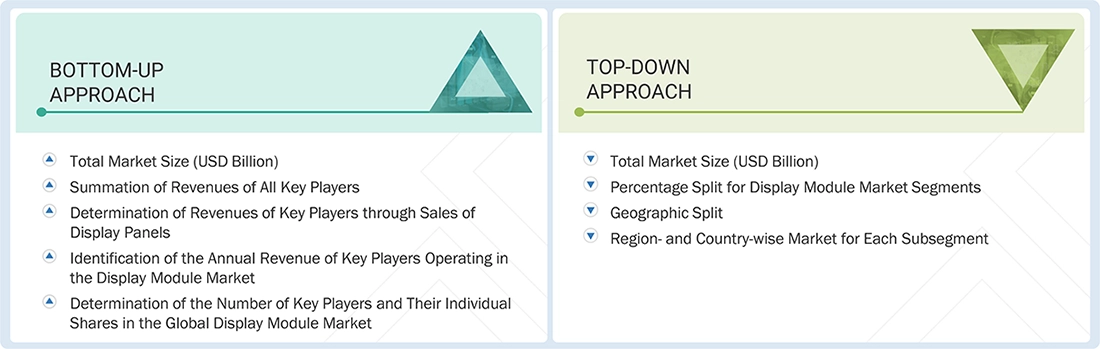
- Approach to arrive at market size using bottom-up analysis (demand side)
- Companies offering display panels were identified, and their offerings were mapped based on technology and panel size footprint.
- The global display module market size was derived through the data sanity method. The revenues of display panel providers were analyzed through annual reports and press releases and summed up to derive the overall market size.
- For each company, a percentage was assigned to the overall revenue to derive the revenues from display panels.
- Each company’s percentage was assigned after analyzing various factors, including its product offerings, geographic presence, R&D expenditures and initiatives, and recent developments/strategies adopted for growth in the display module market.
- For the CAGR, the market trend analysis of display panels was carried out by understanding the industry penetration rate and the demand and supply of display panels to different verticals.
- Estimates at every level were verified and cross-checked by discussing them with key opinion leaders, including sales heads, directors, operations managers, and market domain experts of MarketsandMarkets.
- Various paid and unpaid information sources, such as annual reports, press releases, white papers, and databases, were studied.
The top-down approach was used to estimate and validate the total size of the display module market.
- Focusing initially on the top-line investments and expenditures being made in the ecosystem of displays, further splitting into display technology, product type, display size, end-use industry, and display resolution, and listing key developments in key market areas
- Identifying all major players in the display module market and their product portfolio for various verticals through secondary research, as well as verifying with a brief discussion with industry experts
- Analyzing revenues, product mix, geographic presence, and key verticals for which all identified players serve, display products/technologies to estimate and arrive at the percentage splits for all key segments
- Discussing these splits with the industry experts to validate the information and identify key growth pockets across all key segments
- Breaking down the total market based on verified splits and key growth pockets across all segments
The market size was arrived at using the following approaches:
Data Triangulation
After estimating the overall market size, the label identification market was classified into subsegments. The overall market engineering process was finalized through data triangulation and market segmentation, yielding accurate statistics for all segments and subsegments. This triangulation involved analyzing various trends and factors on both the demand and supply sides. Furthermore, label identification market data were verified and validated using both top-down and bottom-up approaches.
Market Definition
The label identification market comprises technologies, instruments, software, and consumables used to accurately identify, authenticate, and track biological, chemical, and material samples in laboratory environments. These technologies include barcode and RFID systems, laboratory information management systems (LIMS), sample labeling and tracking solutions, molecular identification technologies, microbial identification systems, and automated data management platforms. Label identification is widely used across pharmaceutical and biotechnology companies, clinical and diagnostic laboratories, academic and research institutes, food and beverage testing, environmental testing, and forensic laboratories to improve sample traceability, workflow efficiency, regulatory compliance, data integrity, and the accuracy of analytical and diagnostic results.
Key Stakeholders
- Research & Development Directors
- Analytical Laboratory Managers
- Scientists
- Quality Control (QC) Managers
- Quality Assurance (QA) Directors
- Procurement Managers
- Supply Chain Managers
- Bioprocessing Managers
- Manufacturing Operations Directors
- Clinical Research Managers
- Product Development Scientists
- Regulatory Affairs Managers
- Laboratory Directors
- Sales & Marketing Directors
- CRO/CDMO Operations Managers
Report Objectives
- To define, describe, and forecast the size of the label identification market based on product type, technology, application, and region
- To provide detailed information regarding the factors influencing the growth potential of the global label identification market (drivers, restraints, opportunities, challenges, and trends)
- To analyze micromarkets with respect to individual growth trends, prospects, and contributions to the global label identification market
- To analyze key growth opportunities in the global label identification market for key stakeholders and provide details of the competitive landscape for market leaders
- To forecast the size of market segments and/or subsegments concerning five regions, namely, North America (US and Canada), Europe (Germany, France, the UK, Spain, Italy, and the Rest of Europe), Asia Pacific (Japan, China, India, Australia, South Korea, and the Rest of Asia Pacific), Latin America (Brazil, Mexico, and the Rest of Latin America), and the Middle East & Africa (GCC Countries and the Rest of Middle East & Africa)
- To profile the key players in the label identification market and comprehensively analyze their market shares and core competencies
- To track and analyze the competitive developments undertaken in the global label identification market, such as product launches/approvals, agreements, expansions, collaborations, and acquisitions.
Available customizations:
With the market data given, MarketsandMarkets offers customizations according to the company’s specific needs. The following customization options are available for the report:
Company Information:
- Detailed analysis and profiling of additional market players (up to five)
Get the Full Display Module Market Report
Full forecast, segment splits, and company analysis for all Display Module Market.
- US Display Module Market
- Canada Display Module Market
- Mexico Display Module Market
- Germany Display Module Market
- UK Display Module Market
- France Display Module Market
- Italy Display Module Market
- China Display Module Market
- Japan Display Module Market
- South Korea Display Module Market
- Taiwan Display Module Market
- India Display Module Market
- Rest Of Europe Display Module Market
- Rest Of Asia Pacific Display Module Market
- GCC Countries Display Module Market
Need a Tailored Report?
Customize this report to your needs
Get 10% FREE Customization
Customize This Report
