
South East Asia Enterprise Networking Market (2025-2030)

The South East Asia Enterprise Networking Market was valued at $2100 Million in 2025 and projected to reach to $3712 Million by 2030, representing a compound annual growth rate of 12.1%. South East Asia's enterprise networking market is positioned for exceptional growth through 2030, fueled by accelerating digital transformation initiatives across manufacturing, finance, retail, and telecommunications sectors.


| Market Size in | USD 26.32 MN |
| Market Forecast in | |
| CAGR | |
| Forecast Period | |
| Units Considered | Value (USD MN) |
South East Asia Enterprise Networking Market Trends and Insights
- This 12.1% compound annual growth rate significantly outpaces global trends, reflecting the region's accelerating digital transformation and infrastructure modernization.
- South East Asia is witnessing unprecedented demand for advanced networking solutions driven by cloud adoption, remote work infrastructure, and 5G deployment across enterprise sectors. The enterprise networking landscape in South East Asia is characterized by rapid technology adoption and increasing investment in network security and software-defined networking (SDN) solutions.
- South East Asia's growing middle class, expanding e-commerce sector, and government digital initiatives are catalyzing enterprise spending on networking infrastructure.
- Between 2025 and 2030, South East Asia is expected to consolidate its position as a critical growth engine within the Asia Pacific region, with organizations prioritizing network resilience, scalability, and integrated security frameworks..
Key Market Statistics
- CAGR (2025-2030) 12.1% CAGR
- Market Size, 2025 ~USD 2100 Million
- Forecast, 2030 ~USD 3712 Million
- Country South East Asia
South East Asia Enterprise Networking Market Overview
Outpacing Global Growth :
South East Asia's enterprise networking market grows at 12.1% CAGR, significantly exceeding the global rate of 8.6%, driven by rapid digital transformation across the region's economies.
Substantial Market Expansion :
Market valuation is projected to surge from $2,100 million in 2025 to $3,712 million by 2030, representing a 76.8% increase over five years as enterprises modernize infrastructure.
Infrastructure Modernization Wave :
South East Asian nations are investing heavily in 5G deployment, cloud adoption, and data center expansion, creating unprecedented demand for advanced networking solutions and services.
Digital Economy Acceleration :
Rising e-commerce, fintech adoption, and IoT implementations across South East Asia are compelling enterprises to upgrade networking capabilities to support seamless connectivity and data flow.
South East Asia Enterprise Networking Market Dynamics
- Government investments in digital infrastructure, coupled with increasing foreign direct investment in technology hubs like Singapore, Vietnam, and Indonesia, are driving enterprise spending on advanced networking solutions.
- The region's young, tech-savvy population and expanding middle class are creating demand for robust connectivity infrastructure. Key growth drivers include widespread 5G rollout, cloud migration initiatives, and the proliferation of edge computing applications.
- Enterprises are prioritizing network security, software-defined networking (SDN), and network function virtualization (NFV) to support hybrid work environments and digital services.
- As South East Asian economies continue their digital journey, networking investments will remain critical, positioning the region as one of the fastest-growing markets globally for enterprise networking solutions..
Market Ecosystem
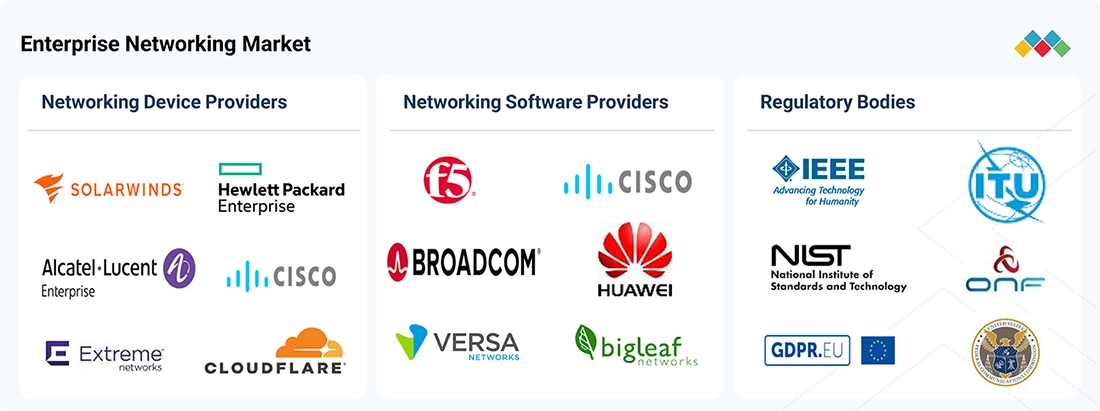
ENTERPRISE NETWORKING MARKET: COMMERCIAL USE CASES ACROSS INDUSTRIES
| COMPANY | USE CASE DESCRIPTION | BENEFITS |
|---|---|---|
 |
Cisco provides enterprise networking solutions through its Catalyst switching, wireless networking, Catalyst Center, SD-Access, SD-WAN, and Meraki cloud-managed networking portfolios. Organizations use these solutions to connect employees, branch offices, campuses, cloud applications, and IoT devices. Network automation, analytics, and integrated security help IT teams manage connectivity, monitor performance, and enforce consistent access policies across distributed enterprise environments. | Improved campus and branch connectivity | Centralized network management and automation | Enhanced network visibility and performance monitoring | Secure access for employees and IoT devices | Reliable connectivity across cloud and distributed locations |
 |
HPE delivers enterprise networking through HPE Aruba Networking, including access points, switches, gateways, Aruba Networking Central, and ClearPass. Organizations use these solutions to manage wired and wireless campus networks, branch connectivity, and SD-WAN environments. AI-powered network management, dynamic segmentation, and identity-based access controls help enterprises automate network operations, support IoT and BYOD devices, and apply consistent security policies across users and locations. | AI-driven network monitoring and troubleshooting | Simplified wired and wireless network operations | Improved network security through identity-based access controls | Better connectivity for IoT and BYOD devices | Scalable campus and branch infrastructure |
 |
Fortinet provides secure enterprise networking through FortiGate next-generation firewalls, FortiSwitch, FortiAP, FortiManager, and Secure SD-WAN. Enterprises use these solutions to connect branch offices, campuses, remote users, and multi-cloud environments while integrating network connectivity with security enforcement. Centralized management, application-aware traffic routing, AI-powered security services, and network segmentation help organizations protect network traffic, optimize application performance, and simplify distributed network operations. | Integrated networking and security management | Improved threat detection and protection | Optimized application performance and WAN connectivity | Consistent security policies across branches and cloud environments | Reduced network complexity and operating costs |
Logos and trademarks shown above are the property of their respective owners. Their use here is for informational and illustrative purposes only.
Related Ecosystem
Data Centre And Networking
- Software-Defined Networking (SDN)
- Mid-Sized Data Centers
- Small Data Centers
- Remote Monitoring
- Smart Healthcare
- Cisco Systems, Inc.
- HUAWEI TECHNOLOGIES CO LTD
- Hewlett Packard Enterprise Company
- MITSUBISHI ELECTRIC INFORMATION NETWORK CORPORATION
- MITSUBISHI ELECTRIC INFORMATION SYSTEMS CORPORATION
Key Takeaways
- South East Asia's enterprise networking market will grow from $2,100M (2025) to $3,712M (2030) at a 12.1% CAGR, outpacing global growth rates.
- South East Asia is driving adoption of cloud-native networking, SDN, and network security solutions across financial services, manufacturing, and telecommunications sectors.
- South East Asia's digital economy expansion and government infrastructure investments are primary catalysts for enterprise networking spending through 2030.
- South East Asia represents a high-growth opportunity for vendors targeting emerging markets with scalable, cost-effective networking solutions.
Enterprise Networking Market Report Scope
| Report Metric | Details |
|---|---|
| Base Year | 2025 |
| Fastest Growing Segment | SMES (Organization Size) |
| Forecast Period | 2025-2030 |
| Growth Rate | CAGR of 8.6% from 2025 to 2030 |
| Largest Segment | SERVICE PROVIDERS (End User) |
| Market Size Base Year (Billions) | ~USD 125.95 (2025) |
| Revenue Forecast (Billions) | ~USD 190.27 (2030) |
| Segments Covered | Offering, Type, Speed, Network, Deployment Mode, Connection Type, End User, Service Provider, Enterprise, Networking Device, Switch Type, Fixed Switch Type, Switch Speed, Networking Software, Service, Professional Service, Organization Size, Vertical, Sdn Type, Application |
South East Asia Enterprise Networking Market Report Segmentation
20 segment dimensions are covered across the global market.
By Offering
- Networking Devices
- Networking Software
- Sdn Infrastructure
- Services
- Software
- Solutions
By Type
- Access Points
- Appliances
- Consulting
- Deployment & Integration
- Firewalls
- Fixed Switches
- Gateways
- Implementation
- Managed Services
- Managed Switches
- Modular Switches
- Network Automation
- Network Management & Monitoring
- Network Security
- Network Virtualization
- Other Networking Devices
- Other Networking Software
- Power Over Ethernet (Poe) Switches
- Professional Services
- Routers
- Software
- Support & Maintenance
- Switches
- Training And Support
- Unmanaged Switches
By Speed
- 400 Gbps And Above
- > 40 Gbps To <=100 Gbps
- >1 Gbps To <=10 Gbps
- >10 Gbps To <=40 Gbps
- >100 Gbps To <=400 Gbps
By Network
- Branch Network
- Campus Network
- Campus Networks
- Data Center Network
- Remote Network
By Deployment Mode
- Cloud
- Do-It-Yourself (Diy)
- Managed Sd-Wan (Telco Or Msp)
- On-Premises
- Sd-Wan As A Service (Cloud-Based)
By Connection Type
- Wired
- Wireless
By End User
- Cloud Service Providers
- Enterprises
- Service Providers
- Telecommunication Service Providers
- Vertical
By Service Provider
- Cloud Service Providers
- Telecom Service Providers
By Enterprise
- Bfsi
- Education
- Government
- Healthcare & Life Sciences
- It & Ites
- Manufacturing
- Media & Entertainment
- Other Enterprises
- Retail & E-Commerce
- Transportation & Logistics
By Networking Device
- Access Points
- Firewalls
- Gateways
- Other Networking Devices
- Routers
- Switches
By Switch Type
- Fixed Switches
- Modular Switches
By Fixed Switch Type
- Managed Switches
- Power Over Ethernet (Poe) Switches
- Unmanaged Switches
By Switch Speed
- 400 Gbps And Above
- > 40 Gbps To <=100 Gbps
- >1 Gbps To <=10 Gbps
- >10 Gbps To <=40 Gbps
- >100 Gbps To <=400 Gbps
By Networking Software
- Network Automation
- Network Management And Monitoring
- Network Security
- Network Virtualization
- Other Networking Software
By Service
- Managed Services
- Professional Services
By Professional Service
- Consulting
- Deployment & Integration
- Support & Maintenance
By Organization Size
- Large Enterprises
- Smes
By Vertical
- Bfsi
- Education
- Energy And Utilities
- Government
- Government & Defense
- Healthcare
- Ites
- Manufacturing
- Other Verticals
- Retail
- Retail & E-Commerce
- Telecom
- Transportation And Logistics
By Sdn Type
- Hybrid Sdn
- Open Sdn
- Sdn Via Api
- Sdn Via Overlay
By Application
- Other Applications
- Sd-Lan
- Sd-Wan
- Security Applications
Target Audience
- Enterprise Networking Vendors : Vendors need South East Asia-specific market data to prioritize regional expansion, allocate sales resources, and develop localized product strategies aligned with regional infrastructure modernization trends.
- System Integrators & Resellers : SIs and resellers require detailed market insights to identify emerging opportunities in South East Asia, understand customer requirements, and position networking solutions effectively across the region.
- Investment & Private Equity Firms : Investors need comprehensive South East Asia market analysis to evaluate acquisition targets, assess portfolio company growth potential, and identify emerging networking technology leaders in the region.
- Enterprise IT Decision Makers : CIOs and IT leaders in South East Asia need market benchmarks and trend analysis to justify networking investments, evaluate vendor options, and align infrastructure spending with regional best practices.
- Telecommunications Operators : Telecom providers require South East Asia market forecasts to plan network infrastructure investments, identify enterprise service opportunities, and develop competitive networking service offerings.
Reasons to Buy this Report
- Regional Market Intelligence : Gain deep insights specific to South East Asia's enterprise networking landscape, including country-level dynamics, competitive positioning, and localized growth opportunities unavailable in global reports.
- Strategic Investment Decisions : Leverage accurate market sizing ($2,100M-$3,712M) and 12.1% CAGR projections to identify high-potential markets within South East Asia for expansion, partnerships, and resource allocation.
- Competitive Advantage : Understand South East Asia-specific trends in 5G deployment, cloud adoption, and digital infrastructure modernization to benchmark against competitors and identify differentiation opportunities.
- Customer Segmentation Insights : Access detailed analysis of South East Asian enterprise segments—manufacturing, finance, retail, telecom—to tailor solutions, messaging, and go-to-market strategies for maximum relevance.
- Risk Mitigation : Identify regional regulatory environments, infrastructure challenges, and market maturity levels across South East Asian countries to develop informed market entry and scaling strategies.
Frequently asked questions
What is the projected market size for enterprise networking in South East Asia by 2030?
South East Asia's enterprise networking market is projected to reach $3,712 million by 2030, growing from $2,100 million in 2025 at a 12.1% CAGR.
What are the primary growth drivers for enterprise networking in South East Asia?
South East Asia's growth is driven by cloud adoption, 5G deployment, remote work infrastructure modernization, e-commerce expansion, and government digital transformation initiatives.
How does South East Asia's enterprise networking growth compare to global trends?
South East Asia's 12.1% CAGR significantly exceeds the global enterprise networking CAGR of 8.6%, positioning the region as a high-growth market.
Which sectors are driving enterprise networking investment in South East Asia?
Financial services, telecommunications, manufacturing, e-commerce, and government sectors are primary drivers of enterprise networking spending in South East Asia.
What networking technologies are gaining traction in South East Asia?
Software-defined networking (SDN), network security solutions, cloud-native architectures, and integrated network management platforms are experiencing strong adoption in South East Asia.
RESEARCH METHODOLOGY
The research study involved four major activities in estimating the enterprise networking market size. Exhaustive secondary research has been done to collect important information about the market and peer markets. The next step was to validate these findings and assumptions and size them with the help of primary research with industry experts across the value chain. Both top-down and bottom-up approaches have been used to estimate the market size. After which, data triangulation was adopted to estimate the market sizes of segments and sub-segments.
Secondary Research
The market size of companies offering enterprise networking devices, software, and services for various subscribers is arrived at based on the secondary data available through paid and unpaid sources and by analyzing the different offerings (devices, software, and services) of major companies in the ecosystem and rating them based on their performance and quality. In the secondary research process, various sources were referred to for identifying and collecting information for this study. The secondary sources included annual reports, press releases and investor presentations of companies, white papers, journals, and certified publications and articles from recognized authors, directories, and databases.
Secondary research was mainly used to obtain key information about the industry’s supply chain, the total pool of key players, market classification, and segmentation according to the industry trends to the bottommost level, regional markets, and key developments from both market- and technology-oriented perspectives, all of which were further validated by primary sources.
Primary Research
In the primary research process, various primary sources from both the supply and demand sides were interviewed to obtain qualitative and quantitative information for the report. The primary sources from the supply side include industry experts, such as chief executive officers (CEOs), vice presidents (VPs), marketing directors, technology and innovation directors, and related key executives from various key companies and organizations providing enterprise networking solutions. The primary sources from the demand side include end users, such as chief information officers (CIOs), consultants, service professionals, technicians and technologists, and managers at public and investor-owned utilities.
In the market engineering process, top-down and bottom-up approaches have been extensively used, along with several data triangulation methods, to perform market estimation and market forecasting for the overall market segments and subsegments listed in the report. Extensive qualitative and quantitative analyses have been performed on the complete market engineering process to list key information/insights throughout the report.
After the complete market engineering (including calculations for market statistics, market breakup, market size estimations, market forecasting, and data triangulation), extensive primary research has been conducted to gather information. Primary research has been conducted to identify the segmentation, industry trends, key players, competitive landscape, and key market dynamics, such as drivers, restraints, opportunities, challenges, industry trends, and key strategies.
Breakdown of Primaries
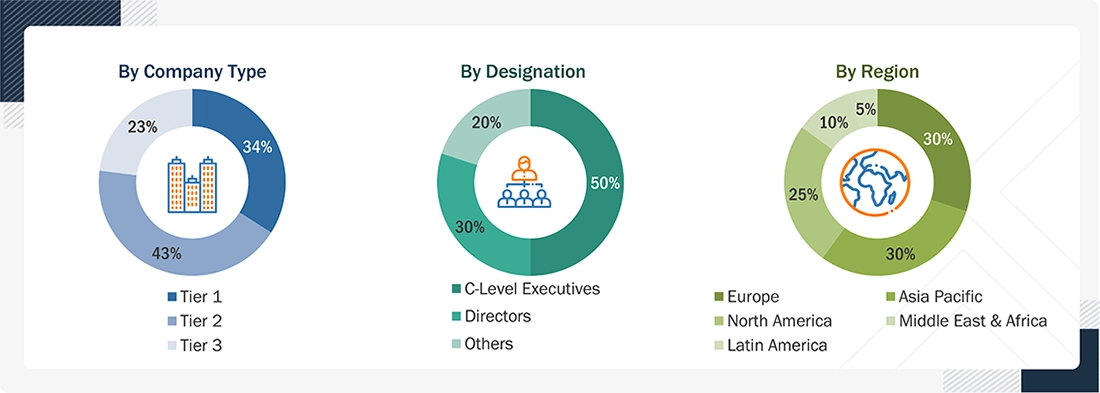
Note 1: Tier 1 companies have revenues of more than USD 10 billion; tier 2 companies’ revenue ranges from USD 1 billion to USD 10 billion; and tier 3 companies’ revenue ranges from USD 500 million to USD 1 billion.
Source: Secondary Literature, Expert Interviews, and MarketsandMarkets Analysis.
To know about the assumptions considered for the study, download the pdf brochure
Market Size Estimation
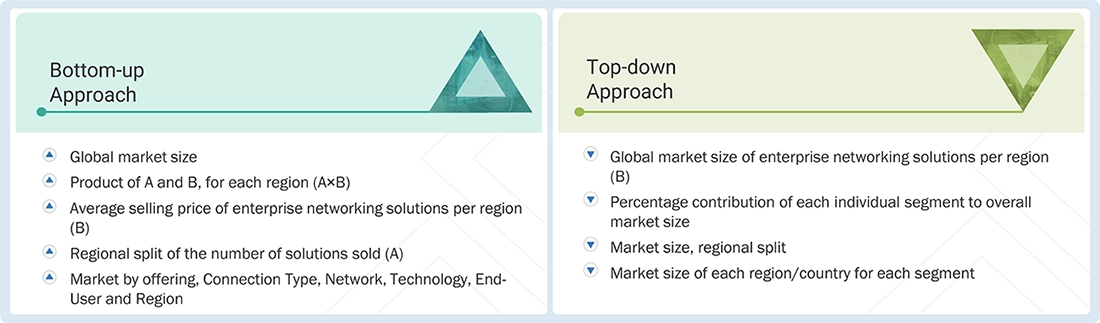
The total size of the enterprise imaging IT market was determined after data triangulation using the two approaches outlined below. After each approach was completed, the results were combined into a weighted average based on the level of assumptions used in each approach.
Enterprise Networking Market: Top-Down and Bottom-Up Approach
Data Triangulation
The size of the enterprise imaging IT market was estimated through segmental extrapolation using the bottom-up approach. The methodology is outlined below.
- Revenue of individual companies was gathered from public sources and databases.
- Shares of leading players in the enterprise imaging IT market were obtained from secondary sources to the extent available. In certain cases, shares of enterprise imaging IT businesses have been ascertained after a detailed analysis of various parameters, including product portfolios, market positioning, selling price, and geographic reach and strength.
- Individual share or revenue estimates were validated through interviews with experts.
- The total revenue in the enterprise imaging IT market was determined by extrapolating the market share data of major companies.
Market Definition
The enterprise imaging IT market comprises software and IT infrastructure solutions that enable seamless management, integration, and sharing of medical images across departments and care settings. It supports unified imaging workflows, enhances clinical collaboration, and improves diagnostic efficiency. This market serves hospitals, diagnostic centers, and integrated delivery networks, with the goal of optimizing image-driven decision-making.
Key Stakeholders
- Vendor neutral archive (VNA) & PACS vendors
- Government bodies
- Healthcare service providers
- Clinical/Physician centers
- Healthcare professionals
- Health IT service providers
- Healthcare associations/institutes
- Ambulatory care centers
- Venture capitalists
- Distributors and resellers
- Maintenance and support service providers
- Integration service providers
- Advocacy groups
- Data security and privacy experts
- Investors and financial institutions
- Industry associations and trade groups
Report Objectives
- To define, describe, and forecast the enterprise imaging IT market by function, modality, application, offering, deployment mode, therapeutic area, end user, and region.
- To provide detailed information regarding the major drivers, restraints, opportunities, and challenges influencing market growth
- To strategically analyze micromarkets1 with respect to individual growth trends, prospects, and contributions to the overall enterprise imaging IT solutions market
- To analyze market opportunities for stakeholders and provide details of the competitive landscape for key players.
- To forecast the size of the enterprise imaging IT solutions market in five main regions (and their respective countries): North America, Europe, Asia Pacific, the Middle East & Africa, and Latin America
- To provide key industry insights, such as supply chain, regulatory, patent, and the Impact of the 2025 US tariff.
- To profile the key players in the market and comprehensively analyze their core competencies2
- To analyze competitive developments, such as solution launches, enhancements, & upgrades, collaborations, partnerships, acquisitions, agreements, and expansions of the leading players in the market
- To benchmark players within the market using the company evaluation matrix, which analyzes market players on various parameters within the broad categories of business strategy, market share, and product offerings.
Available customizations:
With the given market data, MarketsandMarkets offers customizations as per your company’s specific needs. The following customization options are available for the report:
- Company information
- Detailed analysis and profiling of additional market players (up to 5)
Geographic Analysis
- Further breakdown of the Rest of Asia Pacific enterprise imaging IT market into Taiwan, New Zealand, Thailand, Singapore, Malaysia, and other countries
- Further breakdown of the Rest of Europe enterprise imaging IT market into Russia, Austria, Finland, Sweden, Turkey, Norway, Poland, Portugal, Romania, Denmark, and other countries
Get the Full Enterprise Networking Market Report
Full forecast, segment splits, and company analysis for all Enterprise Networking Market.
- US Enterprise Networking Market
- UK Enterprise Networking Market
- China Enterprise Networking Market
- Brazil Enterprise Networking Market
- France Enterprise Networking Market
- Germany Enterprise Networking Market
- Italy Enterprise Networking Market
- Nordics Enterprise Networking Market
- Rest Of Europe Enterprise Networking Market
- Spain Enterprise Networking Market
- India Enterprise Networking Market
- Japan Enterprise Networking Market
- Rest Of Asia Pacific Enterprise Networking Market
- South Korea Enterprise Networking Market
- Mexico Enterprise Networking Market
- Rest Of Latin America Enterprise Networking Market
- Bahrain Enterprise Networking Market
- Ksa Enterprise Networking Market
- Kuwait Enterprise Networking Market
- Rest Of Middle East Enterprise Networking Market
- UAE Enterprise Networking Market
- Canada Enterprise Networking Market
Need a Tailored Report?
Customize this report to your needs
Get 10% FREE Customization
Customize This Report