
Asia Pacific Entertainment Content and Goods Market (2025-2030)

The Asia Pacific Entertainment Content and Goods Market was valued at $52421.1 Million in 2025 and projected to reach to $77812.3 Million by 2030, representing a compound annual growth rate of 8.2%. Asia Pacific's entertainment content and goods market is experiencing unprecedented growth, driven by rising disposable incomes, expanding middle-class populations, and accelerating digital infrastructure development across the region.


| Market Size in | USD 26.32 MN |
| Market Forecast in | |
| CAGR | |
| Forecast Period | |
| Units Considered | Value (USD MN) |
Asia Pacific Entertainment Content and Goods Market Trends and Insights
- In 2025, Asia Pacific's market is estimated at $52,421.1 million, demonstrating the region's substantial economic footprint in the semiconductor and electronics-driven entertainment sector.
- Asia Pacific is projected to grow significantly through 2030, reaching $77,812.3 million, driven by rising consumer spending, digital transformation, and increased adoption of advanced entertainment technologies across the region. The 8.2% compound annual growth rate (CAGR) for Asia Pacific substantially outpaces the global average of 6.2%, reflecting the region's accelerating demand for entertainment content and consumer electronics goods.
- Asia Pacific's growth trajectory is fueled by expanding middle-class populations, smartphone and streaming penetration, and robust semiconductor manufacturing capabilities that support local content delivery infrastructure.
- Between 2025 and 2030, Asia Pacific is expected to capture an increasingly larger share of global entertainment spending, positioning the region as a critical market for content creators, hardware manufacturers, and technology providers..
Key Market Statistics
- CAGR (2025-2030) 8.2% CAGR
- Market Size, 2025 ~USD 52421.1 Million
- Forecast, 2030 ~USD 77812.3 Million
- Geography Asia Pacific
Asia Pacific Entertainment Content and Goods Market Overview
Dominant Market Leader :
China commands the Asia Pacific entertainment content and goods market with $27,158.6 million in 2025, representing over 51% of the region's total market value and driving semiconductor-enabled content consumption across the region.
Rapid Growth Trajectory :
Asia Pacific is projected to grow at 8.2% CAGR from 2025 to 2030, significantly outpacing the global average of 6.2%, reflecting accelerating digital adoption and electronics manufacturing capabilities across the region.
Multi-Country Expansion :
Japan ($16,246 million), India ($14,283.6 million), and South Korea ($6,650.2 million) represent substantial secondary markets, collectively contributing $37,179.8 million and offering diverse growth opportunities across developed and emerging economies.
Market Scale Achievement :
Asia Pacific's market is forecast to reach $77,812.3 million by 2030, representing a $25,391.2 million increase from 2025, demonstrating the region's critical importance to global entertainment content and semiconductor-driven goods distribution.
Asia Pacific Entertainment Content and Goods Market Dynamics
- The semiconductor and electronics sector is catalyzing innovation in content delivery platforms, gaming devices, and smart entertainment systems, particularly in China, Japan, and India.
- Consumer demand for streaming services, gaming consoles, and connected devices continues to surge, supported by improving broadband penetration and 5G rollout initiatives. The region's 8.2% CAGR through 2030 reflects structural advantages including manufacturing expertise, tech-savvy populations, and favorable demographics.
- Investment in local content production, partnerships between international studios and regional platforms, and the emergence of homegrown entertainment companies are reshaping the competitive landscape.
- Asia Pacific is transitioning from a content consumption market to a content creation hub, with implications for semiconductor demand, electronics manufacturing, and intellectual property development across the entertainment value chain..
Market Ecosystem
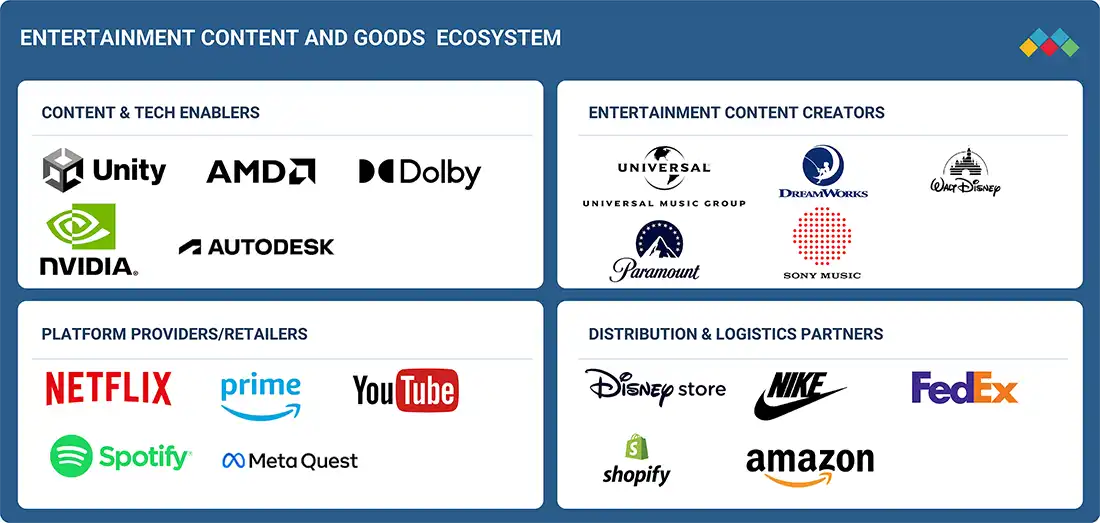
Entertainment Content and Goods Market: COMMERCIAL USE CASES ACROSS INDUSTRIES
| COMPANY | USE CASE DESCRIPTION | BENEFITS |
|---|---|---|
 |
Immersive AR/VR experiences for animated content with synchronized merchandise launches across theme parks, streaming platforms, and retail channels | Cross-platform brand loyalty, seamless content-to-commerce conversion, and enhanced fan lifetime value with 40-50% increase in merchandise sales |
 |
AI-powered artist merchandise personalization with blockchain-based NFT collectibles and direct fan-to-artist monetization through streaming integration | 25-35% revenue increase for artists, reduced intermediary costs, and authentic fan engagement through digital ownership and exclusive content access |
 |
Smart licensing platforms integrating music content with gaming studios, sporting events, and lifestyle brands for cross-industry merchandise collaboration | Enhanced licensing revenue streams, global brand partnerships, and optimized royalty distribution with 30-40% operational cost savings |
 |
D2C monetization platforms with generative content tools for personalized fan experiences and automated merchandise recommendations | Improved artist-fan relationships, streamlined revenue collection, and data-driven product development leading to 20-30% increase in direct sales |
 |
AI-driven animated content production with automated licensing for show-based merchandise and personalized memorabilia through viewer data analytics | Accelerated content-to-market delivery, optimized licensing revenue, and enhanced consumer personalization driving 35-45% merchandise conversion rates |
Logos and trademarks shown above are the property of their respective owners. Their use here is for informational and illustrative purposes only.
Related Ecosystem
Information System And Analytics
- Machine Learning
- Natural Language Processing (NLP)
- Sensors
- Software as A Service (SaaS)
- Data Loss Prevention (DLP)
- International Business Machines Corporation
- MICROSOFT CORPORATION
- Amazon.com, Inc.
- Oracle Corporation
Key Takeaways
- Asia Pacific's entertainment content and goods market is valued at $52.4 billion in 2025 and is forecast to reach $77.8 billion by 2030, representing a 48% increase over the five-year period.
- Asia Pacific's 8.2% CAGR significantly exceeds the global growth rate of 6.2%, indicating the region is outpacing worldwide market expansion and gaining competitive advantage.
- Rising middle-class populations, smartphone adoption, and streaming service expansion are primary growth catalysts driving Asia Pacific's entertainment market acceleration through 2030.
- Asia Pacific's semiconductor and electronics manufacturing infrastructure positions the region as both a content distribution hub and hardware innovation center for global entertainment markets.
Entertainment Content and Goods Market Report Scope
| Report Metric | Details |
|---|---|
| Base Year | 2025 |
| Fastest Growing Segment | LIFESTYLE, FAN GEAR, AND MEMORABILIA (Product Type) |
| Forecast Period | 2025-2030 |
| Growth Rate | CAGR of 6.2% from 2025 to 2030 |
| Largest Segment | LICENSED SPORTSWEAR (Product Type) |
| Market Size Base Year (Billions) | ~USD 177.3 (2025) |
| Revenue Forecast (Billions) | ~USD 239.52 (2030) |
| Segments Covered | Product Type, Content Type, Type |
Asia Pacific Entertainment Content and Goods Market Report Segmentation
3 segment dimensions are covered across the global market.
By Product Type
- Accessories
- Apparel
- Athletic And Fan Accessories
- Licensed Sportswear
- Lifestyle And Home Goods
- Lifestyle, Fan Gear, And Memorabilia
- Music Equipment And Memorabilia
- Sporting Equipment
By Content Type
- Films
- Tv/Ott
By Type
- Animated Content Creation
- Licensed Goods
- Music Artist Goods
Target Audience
- Entertainment Content Producers : Understand Asia Pacific's $52.4B market opportunity and regional preferences to optimize content creation, localization strategies, and distribution partnerships across China, Japan, India, and emerging markets.
- Semiconductor & Electronics Manufacturers : Leverage market intelligence on entertainment-driven device demand to align product roadmaps, manufacturing capacity, and supply chain investments with Asia Pacific's 8.2% growth trajectory through 2030.
- Streaming & Digital Platform Operators : Identify high-growth markets and consumer segments within Asia Pacific to prioritize platform expansion, content investment, and localization efforts in the region's $77.8B 2030 market opportunity.
- Investment & Private Equity Firms : Evaluate Asia Pacific entertainment and electronics companies with data-driven market sizing, growth forecasts, and regional dynamics to inform acquisition, investment, and portfolio strategy decisions.
- Retail & Distribution Networks : Optimize inventory, merchandising, and channel strategies by understanding country-specific market sizes, growth rates, and entertainment goods demand patterns across Asia Pacific's diverse retail landscape.
Countries within Asia Pacific - compare and drill down
| Country | 2025 size (native) |
|---|---|
| China | USD 27158.6 Million |
| Japan | USD 16246 Million |
| India | USD 14283.6 Million |
| South Korea | USD 6650.2 Million |
| Rest Of Asia Pacific | USD 13473.8 Million |
Country market size visualization
Reasons to Buy this Report
- Regional Growth Outperformance : Gain competitive advantage by understanding Asia Pacific's 8.2% CAGR—32% faster than global growth—enabling strategic market entry and expansion planning in the world's fastest-growing entertainment content and goods region.
- Country-Level Market Intelligence : Access granular market sizing for China ($27.2B), Japan ($16.2B), and India ($14.3B), allowing precise resource allocation and localized go-to-market strategies across Asia Pacific's diverse economies and consumer segments.
- Semiconductor-Electronics Nexus Insights : Understand how semiconductor innovation and electronics manufacturing capabilities are driving entertainment content distribution, gaming devices, and smart goods adoption—critical for supply chain and product development decisions.
- 2030 Forecast Roadmap : Plan long-term investments with confidence using detailed projections showing Asia Pacific reaching $77.8B by 2030, identifying emerging opportunities in streaming platforms, gaming hardware, and connected entertainment devices.
- Competitive Positioning Data : Benchmark your organization against regional market dynamics and identify white-space opportunities in underserved segments, enabling data-driven decisions for market share capture in Asia Pacific's expanding entertainment ecosystem.
Frequently asked questions
What is the current market size of entertainment content and goods in Asia Pacific?
Asia Pacific's entertainment content and goods market is estimated at $52,421.1 million in 2025, making it a substantial segment within the global semiconductor and electronics industry.
What is the projected market size for Asia Pacific by 2030?
Asia Pacific's entertainment content and goods market is forecast to reach $77,812.3 million by 2030, representing significant growth from the 2025 baseline.
How does Asia Pacific's growth rate compare to global trends?
Asia Pacific's 8.2% CAGR outpaces the global average of 6.2%, demonstrating that the region is growing faster than the worldwide market and gaining market share.
What factors are driving growth in Asia Pacific's entertainment market?
Key drivers include expanding middle-class consumer bases, increasing smartphone and streaming service penetration, digital infrastructure investment, and strong semiconductor manufacturing capabilities across Asia Pacific.
Why is Asia Pacific important for global entertainment companies?
Asia Pacific represents a high-growth market with substantial consumer spending power, advanced manufacturing capabilities, and strategic positioning as both a content consumer and technology producer in the entertainment sector.
RESEARCH METHODOLOGY
The research study involved four major activities in estimating the size of the entertainment content and goods market. Exhaustive secondary research has been done to collect key information about the market and peer markets. The next step has been to validate these findings and assumptions and size them with the help of primary research with industry experts across the value chain. Both top-down and bottom-up approaches have been used to estimate the market size. The market breakdown and data triangulation have been adopted to estimate the market sizes of segments and sub-segments.
Secondary Research
In the secondary research process, various secondary sources were referred to identify and collect the information required for this study. The secondary sources include annual reports, press releases, investor presentations of companies, white papers, and articles from recognized authors. Secondary research has been mainly done to obtain key information about the market’s value chain, the pool of key market players, market segmentation according to industry trends, regional outlook, and developments from market and technology-oriented perspectives.
The entertainment content and goods market report estimates the global market size using top-down and bottom-up approaches and several other dependent submarkets. The major players in the market were identified using extensive secondary research, and their presence in the market was determined using secondary and primary research. All the percentage shares, splits, and breakdowns have been determined using secondary sources and verified through primary sources.
Primary Research
Extensive primary research has been conducted after understanding the entertainment content and goods market scenario through secondary research. Several primary interviews have been conducted with key opinion leaders from demand- and supply-side vendors across four major regions—North America, Europe, Asia Pacific, and the Rest of the World (RoW). Approximately 25% of the primary interviews have been conducted with the demand-side vendors and 75% with the supply-side vendors. Primary data was collected mainly through telephonic interviews, which comprised 80% of the total primary interviews. Questionnaires and emails have also been used to collect data.
After successful interaction with industry experts, brief sessions were conducted with highly experienced independent consultants to reinforce the findings of our primary research. This, along with the in-house subject matter experts’ opinions, has led us to the findings as described in the report.
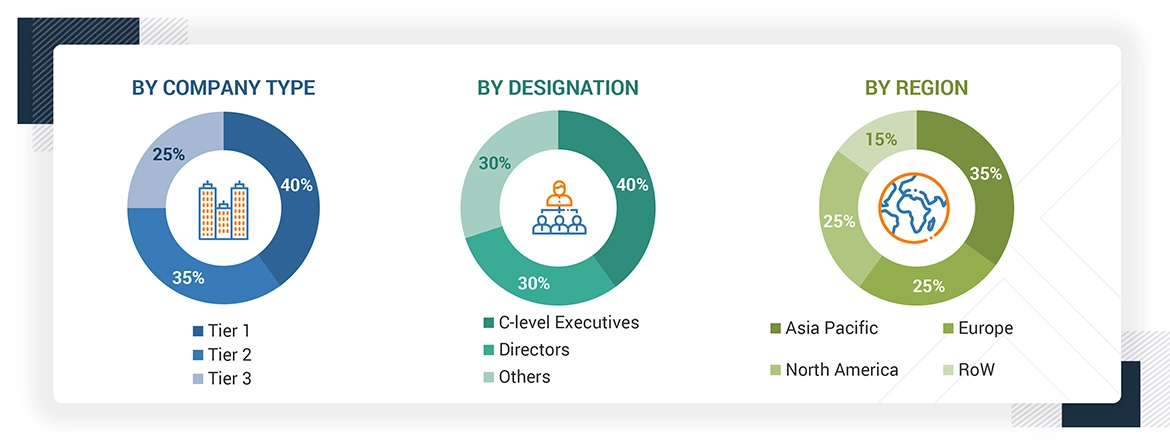
Note: Others include sales, marketing, and product managers.
To know about the assumptions considered for the study, download the pdf brochure
Market Size Estimation
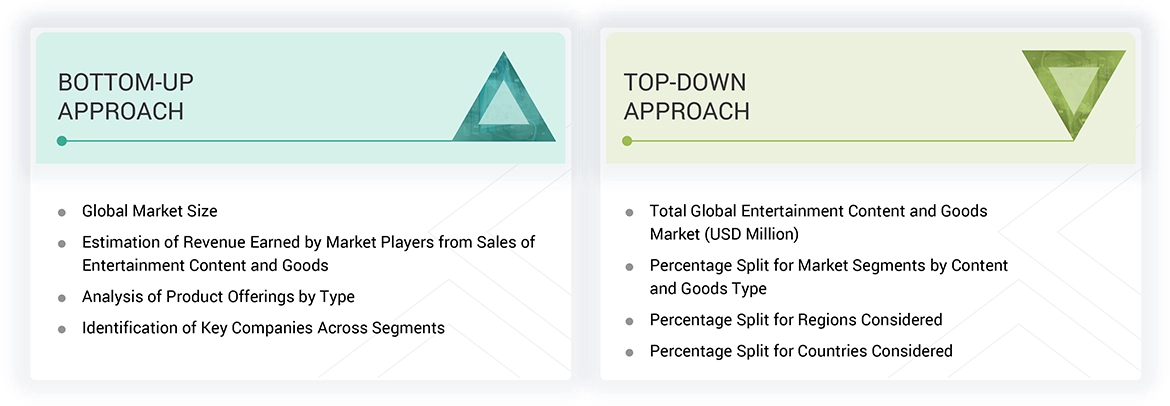
In the market engineering process, top-down and bottom-up approaches and data triangulation methods have been used to estimate and validate the size of the entertainment content and goods market and other dependent submarkets. The research methodology used to estimate the market sizes includes the following:
- Estimating the market size of each key segment within the entertainment content and goods market, namely:
- Music artist goods (merchandise, collectibles, concert-linked items)
- Licensed goods (sporting equipment – licensed) (officially branded merchandise linked to major sports leagues and athletes)
- Animated content creation (film/OTT) (production and distribution of animated content via streaming platforms, cinema releases, and merchandise)
- Breaking down each segment by region—North America, Europe, Asia Pacific, and RoW—followed by detailed country-level estimation based on demand trends, consumption patterns, content popularity, and merchandise penetration rates
- Analyzing region- and country-level consumer behavior, fanbase size, IP monetization strategies, and cultural consumption preferences to derive segment-specific country revenues
- Aggregating the revenues of all segments at the country level to derive total market size by country, followed by aggregation of country-level data to estimate regional market sizes, and finally summing regional values to determine the global market size
- Validating segment-wise assumptions by triangulating with content consumption metrics, digital platform usage, IP franchise growth, and merchandising expansions from public sources, annual reports, streaming trends, and media publications, and finally aligning insights with the domain experts at MarketsandMarkets to ensure robustness and precision in market projections
Entertainment Content and Goods Market : Top-Down and Bottom-Up Approach
Data Triangulation
After arriving at the overall market size by the market size estimation process explained in the earlier section, the entertainment content and goods market has been divided into several segments and subsegments. The data triangulation and market breakdown procedures have been used to complete the overall market engineering process and arrive at the exact statistics for all segments, wherever applicable. The data has been triangulated by studying various factors and trends from both the demand and supply perspectives. Along with data triangulation and market breakdown, the market has been validated through the top-down and bottom-up approaches.
Market Definition
The Entertainment Content and Goods encompasses creating, commercializing, and consuming digital media content and associated branded merchandise derived from intellectual property (IP), artist influence, or licensed franchises. This market captures the intersection of cultural expression, consumer fandom, and monetization strategies across music, sports, animation, and other entertainment domains.
At its core, the market comprises two primary pillars: content creation and goods commercialization. Content creation includes digital formats such as films, TV/OTT series, and animated productions in 2D, 3D, stop-motion, and mixed media styles. These are increasingly delivered through global streaming platforms, forming the narrative foundation for merchandise, fandom, and brand engagement.
Complementing the content layer is a vast and diverse merchandise segment that includes music artist goods, such as printed apparel, accessories, lifestyle items, signed memorabilia, and branded instruments. Similarly, licensed goods related to sports teams, celebrities, esports, and entertainment franchises drive global demand for apparel, collectibles, sporting equipment, and lifestyle accessories. These goods are distributed through online artist stores, tour/event merchandising, e-commerce platforms, and retail partnerships.
The market is driven by rising consumer affinity for pop culture, the growing influence of artist-led branding, and the expanding global reach of content IPs. Fan-based consumption behavior and digital platforms enabling global access to content and merchandise continue to reshape how entertainment is monetized. As such, the market represents a dynamic convergence of media, commerce, and consumer identity.
Key Stakeholders
- IP Creators and Rights Holders
- Branded Merchandise Manufacturers and OEMs
- Licensing and Brand Collaboration Agencies
- Direct-to-Fan and E-commerce Platforms
- Retail Chains, Fashion Collaborators, and Pop-up Stores
- Streaming Platforms and Digital Content Distributors
- Digital Rights Management (DRM) and IP Protection Firms
- Fan Engagement, Loyalty, and Community Management Platforms
- Influencer Marketing and Talent Management Agencies
- Advertising, Branding, and Promotional Service Providers
- Regulatory Authorities and IP Protection Agencies
- Industry Associations and Entertainment Trade Forums
- Research Institutes and Academic Bodies
- Content Consumers, Fans, and Patronage Communities
Report Objectives
- To describe, segment, and forecast the size of the entertainment content and goods market, by music artist goods type, licensed goods type, and animated content creation, in terms of value
- To forecast the size of various segments for four regions: North America, Asia Pacific, Europe, and the Rest of the World (RoW), in terms of value
- To offer detailed information on drivers, restraints, opportunities, and challenges influencing market growth
- To provide a detailed overview of the entertainment content and goods market value chain analysis, pricing analysis, ecosystem analysis, technology analysis, case study analysis, trends/disruptions impacting customer business, and key conferences and events
- To strategically analyze the micromarkets concerning individual growth trends, prospects, and contributions to the overall market
- To analyze opportunities for various stakeholders by identifying the high-growth segments of the market
- To benchmark the key players and analyze their market position in terms of revenue, market share, and core competencies, and a detailed competitive landscape for the market leaders
- To analyze competitive developments, such as product/services launches, expansions, acquisitions, partnerships, collaborations, and agreements, carried out by players in the entertainment content and goods market
Customization Options:
With the given market data, MarketsandMarkets offers customizations according to the specific requirements of companies. The following customization options are available for the report:
Country-wise Information:
- Country-wise breakdown for North America, Europe, Asia Pacific, and Rest of the World
Get the Full Entertainment Content and Goods Market Report
Full forecast, segment splits, and company analysis for all Entertainment Content and Goods Market.
- US Entertainment Content and Goods Market
- Canada Entertainment Content and Goods Market
- Mexico Entertainment Content and Goods Market
- Germany Entertainment Content and Goods Market
- UK Entertainment Content and Goods Market
- France Entertainment Content and Goods Market
- Italy Entertainment Content and Goods Market
- China Entertainment Content and Goods Market
- Japan Entertainment Content and Goods Market
- South Korea Entertainment Content and Goods Market
- India Entertainment Content and Goods Market
- Rest Of Europe Entertainment Content and Goods Market
- Rest Of Asia Pacific Entertainment Content and Goods Market
Need a Tailored Report?
Customize this report to your needs
Get 10% FREE Customization
Customize This Report
