
Japan In-flight Content Market (2024-2029)

The Japan In-flight Content Market was valued at $10.3 Million in 2024 and projected to reach to $14.3 Million by 2029, representing a compound annual growth rate of 6.8%. Japan's in-flight content market is positioned for sustained growth as domestic and international carriers prioritize passenger entertainment modernization.


| Market Size in | USD 26.32 MN |
| Market Forecast in | |
| CAGR | |
| Forecast Period | |
| Units Considered | Value (USD MN) |
Japan In-flight Content Market Trends and Insights
- Japan's aviation sector is increasingly investing in passenger entertainment systems to enhance the travel experience and differentiate service offerings.
- The growth trajectory reflects Japan's commitment to modernizing fleet capabilities and meeting rising passenger expectations for digital content delivery during flights. The Japanese market benefits from the country's advanced technological infrastructure and high passenger volumes across domestic and international routes.
- Japan's airlines are prioritizing in-flight content as a competitive advantage, driving adoption of streaming platforms, live television, and interactive entertainment systems.
- Between 2024 and 2029, Japan is expected to see accelerated investment in content licensing, system upgrades, and partnerships with content providers to support the 6.8% compound annual growth rate..
Key Market Statistics
- CAGR (2024-2029) 6.8% CAGR
- Market Size, 2024 ~USD 10.3 Million
- Forecast, 2029 ~USD 14.3 Million
- Country Japan
Japan In-flight Content Market Overview
Market Valuation :
Japan's in-flight content market is valued at $10.3 million in 2024, with strong growth momentum driven by fleet modernization initiatives across major Japanese carriers.
Robust CAGR Performance :
The market is expanding at a 6.8% CAGR from 2024-2029, outpacing the global average of 6.1%, reflecting Japan's prioritization of passenger experience enhancements.
Forecast Growth Trajectory :
Projected to reach $14.3 million by 2029, representing a 38.8% increase over five years as Japanese airlines invest in next-generation entertainment systems.
Service Differentiation Strategy :
Japanese carriers are leveraging in-flight content as a competitive differentiator, with investments focused on premium passenger experience and fleet modernization across domestic and international routes.
Japan In-flight Content Market Dynamics
- The 6.8% CAGR reflects Japan's aviation sector commitment to enhancing service quality and maintaining competitive advantage in an increasingly crowded market.
- Major Japanese airlines are investing in advanced IFE systems to meet rising passenger expectations and support premium cabin offerings. The forecast expansion to $14.3 million by 2029 is underpinned by fleet renewal cycles, increased international travel demand, and technological advancements in content delivery systems.
- Japan's focus on service excellence and innovation positions the market for continued investment, particularly in high-definition content, personalized entertainment options, and integrated connectivity solutions that align with global aviation trends..
Market Ecosystem
Related Ecosystem
Aviation
- Narrow Body Aircraft
- Wide Body Aircraft
- Military Helicopters
- Special Mission Aircraft
- Fighter Aircraft
- HONEYWELL INTERNATIONAL INC.
- COLLINS AEROSPACE
- Thales group
- Safran group
- HEICO Corporation
Key Takeaways
- Japan's in-flight content market is valued at $10.3 million in 2024 and will reach $14.3 million by 2029, representing a 6.8% CAGR.
- Japan's advanced technological infrastructure and high passenger volumes drive demand for premium in-flight entertainment systems.
- Japanese airlines are leveraging in-flight content as a key competitive differentiator in both domestic and international markets.
- Between 2024 and 2029, Japan will see increased investment in content licensing, system upgrades, and strategic partnerships with content providers.
In-flight Content Market Report Scope
| Report Metric | Details |
|---|---|
| Base Year | 2024 |
| Fastest Growing Segment | PORTABLE DEVICE (Access) |
| Forecast Period | 2024-2029 |
| Growth Rate | CAGR of 6.1% from 2024 to 2029 |
| Largest Segment | STORED (Operation) |
| Market Size Base Year (Billions) | ~USD 0.69 (2024) |
| Revenue Forecast (Billions) | ~USD 0.93 (2029) |
| Segments Covered | Type, Access, Operation, Platform |
Japan In-flight Content Market Report Segmentation
4 segment dimensions are covered across the global market.
By Type
- Game
- Games
- Magazine
- Movie
- Music
- News
- Other Types
- Tv Show
By Access
- Portable Device
- Seatback Display Unit (Sdu)
By Operation
- Stored
- Streamed
By Platform
- Business Aviation
- Commercial Aviation
Target Audience
- Japanese Airline Operators : Carriers need Japan-specific market data to benchmark IFE investments, plan fleet modernization budgets, and evaluate competitive positioning in passenger entertainment offerings.
- In-Flight Entertainment Vendors : IFE system providers require detailed Japan market insights to identify growth opportunities, understand carrier requirements, and develop localized content and technology solutions for Japanese airlines.
- Aerospace & Defence Investors : Investment firms and private equity need Japan market analysis to evaluate portfolio opportunities, assess growth potential in aviation technology, and identify acquisition targets in the IFE sector.
- Content & Media Companies : Media and content providers need Japan-specific demand forecasts to plan content localization strategies, negotiate licensing agreements with carriers, and allocate resources to the growing Japanese market.
- Aviation Consultants & Analysts : Industry consultants require Japan market data to support client advisory work, competitive analysis, and strategic recommendations for airlines and technology providers operating in the region.
Reasons to Buy this Report
- Japan-Specific Market Sizing : Access precise valuation data for Japan's in-flight content market with verified 2024 baseline ($10.3M) and 2029 forecasts ($14.3M), enabling accurate business planning and investment decisions.
- Competitive Growth Intelligence : Understand Japan's 6.8% CAGR outperformance versus global 6.1% average, identifying market dynamics unique to Japanese carriers and regional aviation trends driving above-average expansion.
- Fleet Modernization Insights : Gain detailed understanding of Japanese airline fleet renewal cycles, IFE system upgrade priorities, and technology adoption patterns specific to major carriers operating domestic and international routes.
- Strategic Market Entry Planning : Develop targeted go-to-market strategies for Japan with localized insights on passenger preferences, carrier partnerships, regulatory environment, and competitive positioning within the Asian aviation sector.
- Investment & Expansion Roadmap : Support capital allocation decisions and expansion planning with Japan-focused market data, growth trajectory analysis, and identification of high-potential segments within the $14.3M 2029 market opportunity.
Frequently asked questions
What is the current size of Japan's in-flight content market?
Japan's in-flight content market was valued at $10.3 million in 2024 and is expected to grow to $14.3 million by 2029.
What is the projected growth rate for Japan's in-flight content market?
Japan's in-flight content market is projected to grow at a compound annual growth rate (CAGR) of 6.8% from 2024 to 2029.
What factors are driving growth in Japan's in-flight content market?
Growth in Japan's in-flight content market is driven by advanced technological infrastructure, high passenger volumes, airline competition, and increasing demand for premium entertainment systems.
Which airlines in Japan are investing in in-flight content systems?
Major Japanese carriers are investing in modern in-flight content systems to enhance passenger experience and maintain competitive advantage in both domestic and international routes.
What types of content are most popular on Japan's in-flight systems?
In-flight content in Japan includes streaming platforms, live television, movies, interactive entertainment, and digital services tailored to passenger preferences.
RESEARCH METHODOLOGY
This research study involved the extensive use of secondary sources, directories, and databases, such as the International Air Transport Association (IATA), Federal Aviation Administration (FAA), and CAPA- Center for Aviation to identify and collect relevant information on the in-flight content market. The primary sources included industry experts from the concerned market, preferred suppliers, manufacturers, solution providers, technology developers, alliances, and organizations related to all segments of the industry’s value chain. All primary sources were interviewed to obtain and verify critical qualitative and quantitative information as well as to assess the prospects of the market.
Secondary Research
The market share of the companies offering in-flight content for airlines was procured based on the secondary data available through paid and unpaid sources and by analyzing the product portfolios of major companies and rating them based on their performance and quality. In the secondary research process, sources such as corporate filings; annual reports, press releases, and investor presentations of companies; white papers, journals, and certified publications; articles by recognized authors; and directories & databases were used to identify and collect information for this study.
Secondary research was mainly used to obtain key information about the industry's value and supply chain. The method was also used to identify the essential players by various products, market classifications, and segmentations according to their offerings. Secondary information helped to understand the industry trends related to the type, access, operation, platform and critical developments from the market and technology-oriented perspectives.
Primary Research
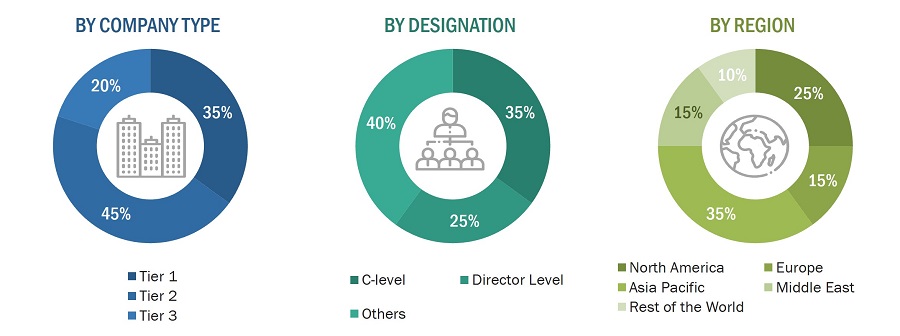
Extensive primary research was conducted after obtaining information about the current scenario of the inflight content market through secondary research. Several primary interviews were conducted with market experts from both demand and supply sides across North America, Europe, Asia Pacific, Middle East and Rest of the World. This primary data was collected through questionnaires, emails, and telephonic interviews. Primary sources from the supply side included various industry experts, such as chief experience officers (CXOs), vice presidents (VPs), directors from business development, marketing, and product development/innovation teams, related key executives from airline cloud providers, independent aviation consultants, aircraft manufactures, integrators and inflight content providers. Interviews were conducted to gather insights such as market statistics, data on revenue collected from the products & services, market breakdowns, market size estimations, market forecasting, and data triangulation. Primary research also helped understand trends related to type, access operation, platform and region.
To know about the assumptions considered for the study, download the pdf brochure
Market Size Estimation
Both top-down and bottom-up approaches were used to estimate and validate the size of the in-flight content market. The research methodology used to estimate the market size also included the following details:
- The key players were identified through secondary research, and their market ranking was determined through primary and secondary research. This included a study of the annual and financial reports of the top market players and extensive interviews of leaders, including chief executive officers (CEOs), directors, and marketing executives.
- All percentage shares, splits, and breakdowns were determined using secondary sources and verified through primary sources. All possible parameters that affect the markets covered in this research study were accounted for, viewed in extensive detail, verified through primary research, and analyzed to obtain the final quantitative and qualitative data. This data was consolidated, enhanced with detailed inputs, analyzed by MarketsandMarkets, and presented in this report.
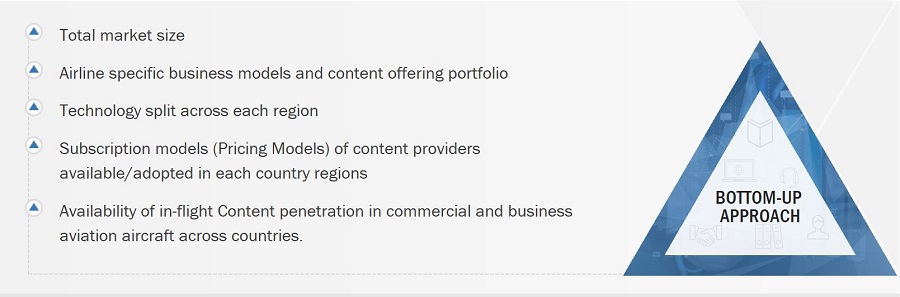
Bottom-Up Approach
The bottom-up approach was employed to arrive at the overall size of the in-flight content market. The growth in the penetration of in-flight content has been tracked through primary avenue such as penetration of Inflight content in the current fleet of aircraft.
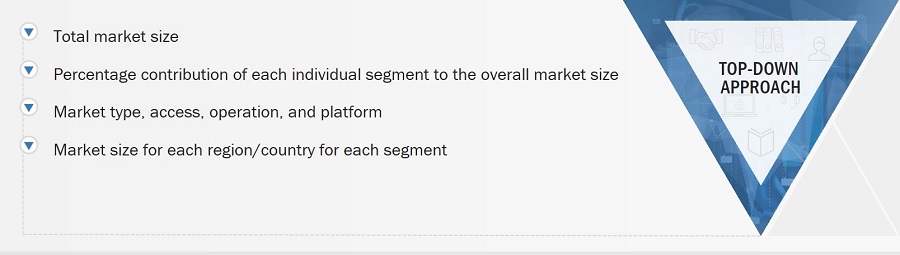
Top-Down Approach
In the top-down approach, the size of the in-flight content market was used to estimate the size of individual markets (mentioned in the market segmentation) through percentage splits from secondary and primary research. For the calculation of the sizes of specific segments, the size of the most appropriate immediate parent market was used to implement the top-down approach.
Data triangulation
After arriving at the overall size of the in-flight content market from the market size estimation process explained above, the total market was split into several segments and subsegments. The data triangulation and market breakdown procedures explained below were implemented, wherever applicable, to complete the overall market engineering process and arrive at the estimated sizes of different market segments and subsegments. The data was triangulated by studying various factors and trends from both the demand and supply sides. Additionally, the market size was validated using both the top-down and bottom-up approaches.
Market Definition
In-flight content refers to a wide range of multimedia entertainment options available for passengers during air travel, including movies, TV shows, music, audiobooks, podcasts, and interactive games, all accessible through the aircraft's in-flight entertainment system. This content selection by airlines aims to enhance the passenger experience during long flights and provide relaxation. In-flight content allows passengers to engage in entertainment and interactive digital games of various genres, from puzzles to immersive adventures, catering to diverse demographics and preferences of different age groups. Airlines invest in sourcing and curating high-quality content to differentiate their services, grow customer loyalty, and elevate the overall in-flight experience for travelers.
Stakeholders
Various stakeholders of the market are listed below:
- Airlines
- In-flight Content Providers
- Internet Service Providers
- Satellite Operators
- Aircraft Manufacturers
- Regulatory Bodies
- Technology Providers
- Content Providers
- Investors
- Passengers
Report Objectives
- To define, describe, segment, and forecast the size of the in-flight content market based on type, access, operation, platform, and region
- To forecast the size of market segments with respect to five major regions, namely North America, Europe, Asia Pacific, the Middle East, and the Rest of the World, along with the major countries in each region
- To identify and analyze key drivers, restraints, opportunities, and challenges influencing the market growth
- To strategically analyze micromarkets1 with respect to individual growth trends, prospects, and their contribution to the overall market
- To analyze opportunities for stakeholders in the market by identifying key trends
- To profile key players and comprehensively analyze their market shares and core competencies2
- To provide a detailed competitive landscape of the in-flight content market, along with a ranking analysis, market share analysis, and revenue analysis of key players
- To identify detailed financial positions, key products, and unique selling points of leading companies in the market
- To analyze the degree of competition in the market by identifying key growth strategies, such as, product/service launches, contracts, and partnerships, adopted by key players
1. Micromarkets are further segments and subsegments of the In-flight Content market.
2. Core competencies of companies were captured in terms of their key developments and strategies adopted to sustain their position in the market.
Available Customizations:
Along with the market data, MarketsandMarkets offers customizations as per the specific needs of companies. The following customization options are available for the report:
Product Analysis
- Product matrix, which gives a detailed comparison of the product portfolio of each company.
Regional Analysis
- Further breakdown of the market segments at the country level
Company Information
- Detailed analysis and profiling of additional market players (up to 5)
Get the Full In-flight Content Market Report
Full forecast, segment splits, and company analysis for all In-flight Content Market.
- Rest Of Asia Pacific In-flight Content Market
- Canada In-flight Content Market
- US In-flight Content Market
- UK In-flight Content Market
- Germany In-flight Content Market
- France In-flight Content Market
- Italy In-flight Content Market
- Spain In-flight Content Market
- China In-flight Content Market
- India In-flight Content Market
- South Korea In-flight Content Market
- Australia In-flight Content Market
- UAE In-flight Content Market
- Saudi Arabia In-flight Content Market
- Qatar In-flight Content Market
- Turkey In-flight Content Market
- Brazil In-flight Content Market
- Mexico In-flight Content Market
- South Africa In-flight Content Market
- Rest Of Europe In-flight Content Market
Need a Tailored Report?
Customize this report to your needs
Get 10% FREE Customization
Customize This Report
