
Asia Pacific Integrated Visual Augmentation System Market (2024-2029)

The Asia Pacific Integrated Visual Augmentation System Market was valued at $334.3 Million in 2024 and projected to reach to $541 Million by 2029, representing a compound annual growth rate of 10.1%. The Asia Pacific Integrated Visual Augmentation System Market is poised for sustained expansion through 2029, driven by aggressive defence modernization programs and increasing military expenditures across the region.


| Market Size in | USD 26.32 MN |
| Market Forecast in | |
| CAGR | |
| Forecast Period | |
| Units Considered | Value (USD MN) |
Asia Pacific Integrated Visual Augmentation System Market Trends and Insights
- Asia Pacific's aerospace and defence sector is increasingly adopting advanced visual augmentation technologies to enhance pilot situational awareness, aircraft navigation, and combat effectiveness.
- The region's growth trajectory reflects rising defence spending across nations including India, Japan, South Korea, and Australia, coupled with modernization of military aviation fleets. Asia Pacific's market expansion is driven by geopolitical tensions, regional security concerns, and accelerating procurement of next-generation fighter aircraft and rotorcraft equipped with integrated visual systems.
- The region's 10.1% CAGR outpaces many mature markets, supported by indigenous defence manufacturing initiatives and technology partnerships with global aerospace leaders.
- By 2029, Asia Pacific is expected to capture an increasingly significant share of global integrated visual augmentation demand, positioning the region as a critical growth engine for the aerospace and defence industry..
Key Market Statistics
- CAGR (2024-2029) 10.1% CAGR
- Market Size, 2024 ~USD 334.3 Million
- Forecast, 2029 ~USD 541 Million
- Geography Asia Pacific
Asia Pacific Integrated Visual Augmentation System Market Overview
Market Valuation & Growth Trajectory :
Asia Pacific's Integrated Visual Augmentation System Market is valued at USD 334.3 million in 2024, with a projected CAGR of 10.1% through 2029, reaching USD 541.0 million. This growth outpaces several developed regions as defence modernization accelerates across the Asia Pacific aerospace sector.
Japan & India Lead Regional Expansion :
Japan dominates with USD 215.4 million in market size, while India emerges as a high-growth market at USD 163.5 million. Together, these two nations represent over 56% of Asia Pacific's total market value, driven by indigenous fighter jet programs and military modernization initiatives.
Pilot Situational Awareness Enhancement :
Asia Pacific defence forces are prioritizing advanced visual augmentation technologies to improve pilot situational awareness and combat effectiveness. Integration with next-generation fighter aircraft and rotorcraft platforms is accelerating adoption across the region's military aviation sectors.
Strategic Regional Defence Investments :
Geopolitical tensions and regional security concerns are driving substantial defence budgets across Asia Pacific nations. Governments are investing heavily in advanced avionics and augmented reality systems to maintain technological superiority in modern aerial warfare scenarios.
Asia Pacific Integrated Visual Augmentation System Market Dynamics
- Japan's advanced aerospace capabilities and India's growing defence manufacturing ecosystem are catalyzing technology adoption and localized production initiatives.
- South Korea and Australia are also investing significantly in next-generation fighter platforms that require sophisticated visual augmentation systems. Regional geopolitical dynamics are accelerating procurement cycles for advanced avionics and augmented reality solutions.
- The market will benefit from technology transfer agreements, joint development programs, and indigenous fighter jet initiatives.
- Rising pilot training demands and the need for enhanced operational capabilities in complex airspace environments will sustain demand through the forecast period, with Asia Pacific capturing an increasingly larger share of global defence technology investments..
Market Ecosystem
Related Ecosystem
Defence Platforms And Systems
- Sensors
- Unmanned Ground Vehicles (UGV)
- Fighter Aircraft
- Special Mission Aircraft
- Antennas
- BAE Systems plc
- Thales group
- LOCKHEED MARTIN CORPORATION
- Northrop Grumman Corporation
- L3Harris Technologies, Inc.
Key Takeaways
- Asia Pacific's Integrated Visual Augmentation System Market is valued at USD 334.3 million in 2024 and will reach USD 541.0 million by 2029, representing a 10.1% CAGR.
- Asia Pacific defence modernization and rising geopolitical tensions are accelerating adoption of advanced visual augmentation technologies across military aviation platforms.
- Key Asia Pacific markets including India, Japan, South Korea, and Australia are driving growth through increased defence procurement and indigenous manufacturing capabilities.
- Asia Pacific's 10.1% CAGR demonstrates the region's emergence as a critical growth hub for integrated visual augmentation systems in the global aerospace and defence sector.
Integrated Visual Augmentation System Market Report Scope
| Report Metric | Details |
|---|---|
| Base Year | 2024 |
| Fastest Growing Segment | COMBAT MISSIONS (Application) |
| Forecast Period | 2024-2029 |
| Growth Rate | CAGR of 11.1% from 2024 to 2029 |
| Largest Segment | HELMET-MOUNTED DISPLAY (Product) |
| Market Size Base Year (Billions) | ~USD 1 (2024) |
| Revenue Forecast (Billions) | ~USD 1.7 (2029) |
| Segments Covered | Product, Technology, Application, End User |
Asia Pacific Integrated Visual Augmentation System Market Report Segmentation
4 segment dimensions are covered across the global market.
By Product
- Helmet-Mounted Display
- Night Vision Device
By Technology
- Augmented Reality
- Mixed Reality
- Virtual Reality
By Application
- Combat Missions
- Simulation & Training
By End User
- Air Force
- Army
- Navy
Target Audience
- Defence Procurement Officials : Government defence ministry personnel and military procurement teams across Asia Pacific require market intelligence to evaluate visual augmentation system vendors, assess technology maturity, and justify budget allocations for next-generation fighter aircraft programs.
- Aerospace & Defence Manufacturers : OEMs and Tier-1 suppliers in Asia Pacific need regional market data to identify growth opportunities, assess competitive positioning, and develop localized product strategies aligned with indigenous fighter jet programs and military modernization initiatives.
- Technology & Avionics Companies : Avionics system integrators and augmented reality technology providers require Asia Pacific-specific insights to understand adoption rates, regulatory requirements, and integration standards for pilot display systems across regional air forces.
- Investment & Private Equity Firms : Investors evaluating opportunities in Asia Pacific's aerospace and defence sector need market sizing, growth forecasts, and competitive analysis to identify acquisition targets and portfolio companies in the visual augmentation systems space.
- Military Aviation Training Organizations : Flight training centers and pilot development programs across Asia Pacific require understanding of visual augmentation technology adoption to update training curricula, procure simulation systems, and prepare pilots for next-generation aircraft platforms.
Countries within Asia Pacific - compare and drill down
| Country | 2025 size (native) |
|---|---|
| India | USD 163.5 Million |
| Japan | USD 215.4 Million |
| South Korea | USD 55.5 Million |
| Australia | USD 67.7 Million |
| Rest Of Asia Pacific | USD 38.8 Million |
Country market size visualization
Reasons to Buy this Report
- Identify High-Growth Markets Within Asia Pacific : Pinpoint which Asia Pacific nations offer the greatest expansion opportunities. Japan and India represent over 56% of regional market value, but emerging markets like South Korea and Australia show accelerating adoption rates for visual augmentation technologies.
- Understand Regional Defence Procurement Cycles : Gain insights into Asia Pacific military modernization timelines and fighter aircraft development programs. Strategic understanding of indigenous jet programs and technology partnerships informs market entry and product positioning strategies.
- Competitive Landscape & Market Positioning : Analyze competitor strategies specific to Asia Pacific's unique regulatory environment, geopolitical factors, and defence procurement processes. Understand how global players are adapting offerings for regional requirements and local partnerships.
- Technology Adoption & Integration Trends : Discover how Asia Pacific defence forces are integrating visual augmentation systems into next-generation platforms. Learn about pilot training requirements, operational doctrine evolution, and technology standardization across the region's air forces.
- Investment & Partnership Opportunities : Identify joint venture prospects, technology transfer agreements, and manufacturing partnerships within Asia Pacific's growing aerospace and defence ecosystem. Understand local content requirements and government incentives for defence technology development.
Frequently asked questions
What is the current market size of Integrated Visual Augmentation Systems in Asia Pacific?
The Asia Pacific Integrated Visual Augmentation System Market was valued at USD 334.3 million in 2024 and is projected to grow to USD 541.0 million by 2029.
What is the projected growth rate for Asia Pacific's Integrated Visual Augmentation System Market?
Asia Pacific's Integrated Visual Augmentation System Market is expected to grow at a compound annual growth rate (CAGR) of 10.1% from 2024 to 2029.
Which countries in Asia Pacific are driving market growth?
Key Asia Pacific markets driving growth include India, Japan, South Korea, and Australia, supported by rising defence budgets and military modernization initiatives.
What factors are accelerating adoption of visual augmentation systems in Asia Pacific?
Geopolitical tensions, regional security concerns, defence modernization programs, and procurement of next-generation fighter aircraft and rotorcraft are primary growth drivers in Asia Pacific.
How does Asia Pacific's growth compare to the global market?
Asia Pacific's 10.1% CAGR is competitive with the global market's 11.1% CAGR, positioning the region as a significant contributor to worldwide integrated visual augmentation system demand.
RESEARCH METHODOLOGY
The study involved four major activities in estimating the current size of the The Integrated Visual Augmentation System (IVAS) Market. Exhaustive secondary research was done to collect information on the The Integrated Visual Augmentation System (IVAS) Market, its adjacent markets, and its parent market. The next step was to validate these findings, assumptions, and sizing with industry experts across the value chain through primary research. Demand-side analyses were carried out to estimate the overall size of the market. After that, market breakdown and data triangulation procedures were used to estimate the sizes of different segments and subsegments of the The Integrated Visual Augmentation System (IVAS) Market.
Secondary Research
In the secondary research process, various sources were referred to for identifying and collecting information for this study. The secondary sources included government sources, such as SIPRI; corporate filings such as annual reports, press releases, and investor presentations of companies; white papers, journals, and certified publications; and articles from recognized authors, directories, and databases.
Primary Research
Extensive primary research was conducted after acquiring information regarding the the Integrated Visual Augmentation System (IVAS) Market scenario through secondary research. Several primary interviews were conducted with market experts from both the demand and supply sides across major countries of North America, Europe, Asia Pacific, the Middle East, and the Rest of the World, which includes Africa and Latin America. Primary data was collected through questionnaires, emails, and telephonic interviews.
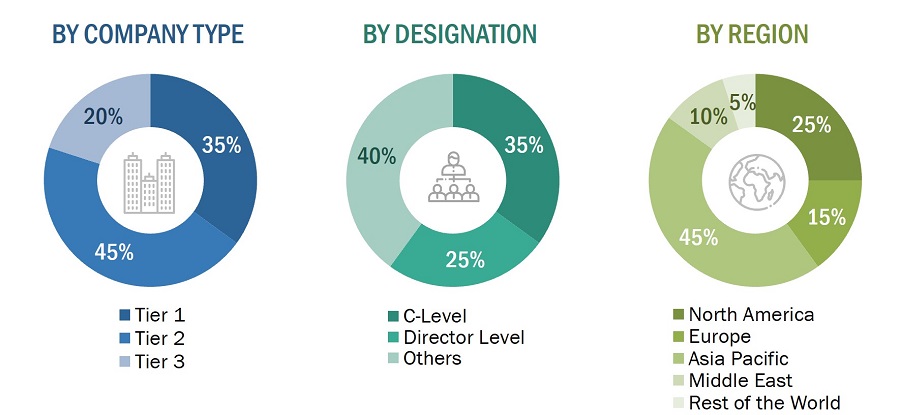
To know about the assumptions considered for the study, download the pdf brochure
Market Size Estimation
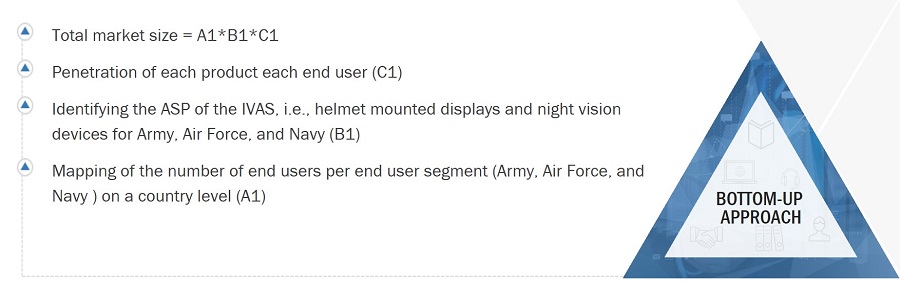
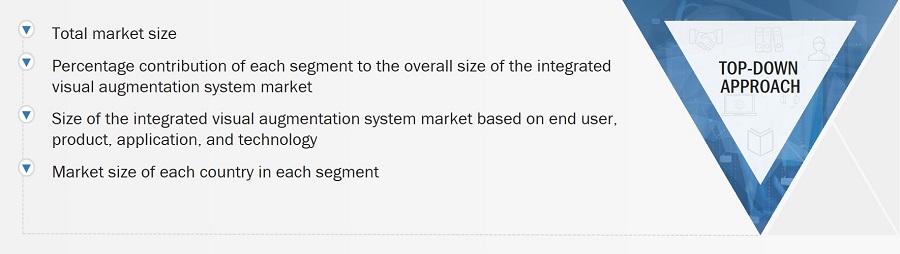
The top-down and bottom-up approaches were used to estimate and validate the size of the Integrated Visual Augmentation System Market. The research methodology used to estimate the size of the market includes the following details.
Key players in the Integrated Visual Augmentation System Market were identified through secondary research, and their market share was determined through primary and secondary research. This included a study of the annual and financial reports of the top market players and extensive interviews with leaders such as directors, engineers, marketing executives, and other stakeholders of leading companies operating in the Integrated Visual Augmentation System Market.
All percentage shares, splits, and breakdowns were determined using secondary sources and verified through primary sources. All possible parameters that affect the markets covered in this research study were accounted for, viewed in extensive detail, verified through primary research, and analyzed to obtain the final quantitative and qualitative data on the Integrated Visual Augmentation System market. This data was consolidated, enhanced with detailed inputs, analyzed by MarketsandMarkets, and presented in this report.
Integrated Visual Augmentation System Market Size: Bottom-up Approach
Integrated Visual Augmentation System Market Size: Top-Down Approach
Data Triangulation
After arriving at the overall market size, the total market was split into several segments and subsegments. The data triangulation and market breakdown procedures explained below were implemented, wherever applicable, to complete the overall market engineering process and arrive at the estimated market numbers for the market segments and subsegments. The data was triangulated by studying various factors and trends from the demand and supply sides. Along with this, the market size was validated using the top-down and bottom-up approaches.
Market Definition
The Integrated Virtual Augmented System (IVAS) market integrates virtual reality (VR) and augmented reality (AR) technologies into a single system that improves situational awareness for military personnel. IVAS incorporates helmet-mounted displays (HMDs), night vision devices (NVDs), and AR/VR systems, among other wearable technologies, to create practical, interactive experiences that combine digital content with the real-world setting. This technology is used in various applications including combat missions, simulations, and training exercises.
Market Stakeholders
- Army
- Navy
- Air Force
- Special Forces
- Traing and Simulation Troops
Report Objectives
- To define, describe, and forecast the Integrated Virtual Augmented System (IVAS) market size based on end-user, application, technology,product and Region.
- To forecast the size of different segments of the market with respect to five major regions: North America, Europe, Asia Pacific, the Middle East, and the Rest of the World, along with their respective key countries
- To identify and analyze key drivers, restraints, opportunities, and challenges influencing the market’s growth
- To identify industry trends and technology trends currently prevailing in the market
- To analyze micromarkets1 with respect to their individual growth trends, prospects, and contribution to the overall market
- To profile companies operating in the market based on their product portfolios, market share, and key growth strategies
- To analyze the degree of competition among players in the market by identifying and analyzing their business revenues, products offered, and recent developments and ranking them based on these parameters
- To analyze competitive developments such as deals, new product launches/developments, and partnerships/acquisitions undertaken by key market players
- To strategically profile key players and comprehensively analyze their share and core competencies in the market
Available Customizations
MarketsandMarkets offers the following customizations for this market report:
- Additional country-level analysis of the Integrated Virtual Augmented System (IVAS) market
- Profiling of other market players (up to 5)
Product Analysis
- Product matrix, which provides a detailed comparison of the product portfolio of each company in the Integrated Virtual Augmented System (IVAS)
Get the Full Integrated Visual Augmentation System Market Report
Full forecast, segment splits, and company analysis for all Integrated Visual Augmentation System Market.
- Canada Integrated Visual Augmentation System Market
- US Integrated Visual Augmentation System Market
- UK Integrated Visual Augmentation System Market
- France Integrated Visual Augmentation System Market
- Germany Integrated Visual Augmentation System Market
- Italy Integrated Visual Augmentation System Market
- India Integrated Visual Augmentation System Market
- Japan Integrated Visual Augmentation System Market
- South Korea Integrated Visual Augmentation System Market
- Australia Integrated Visual Augmentation System Market
- Saudi Arabia Integrated Visual Augmentation System Market
- UAE Integrated Visual Augmentation System Market
- Israel Integrated Visual Augmentation System Market
- Rest Of Europe Integrated Visual Augmentation System Market
- Rest Of Asia Pacific Integrated Visual Augmentation System Market
- GCC Countries Integrated Visual Augmentation System Market
- Türkiye Integrated Visual Augmentation System Market
Need a Tailored Report?
Customize this report to your needs
Get 10% FREE Customization
Customize This Report
