
Asia Pacific LEO Satellite Market (2025-2030)

The Asia Pacific LEO Satellite Market was valued at $4053.2 Million in 2025 and projected to reach to $6211.1 Million by 2030, representing a compound annual growth rate of 8.9%. The Asia Pacific LEO satellite market is positioned for sustained growth, driven by expanding digital infrastructure needs across developing economies and increasing government support for space technology initiatives.


| Market Size in | USD 26.32 MN |
| Market Forecast in | |
| CAGR | |
| Forecast Period | |
| Units Considered | Value (USD MN) |
Asia Pacific LEO Satellite Market Trends and Insights
- Asia Pacific's growth trajectory reflects increasing demand for satellite-based connectivity, earth observation, and communication services across the region's rapidly developing economies.
- The 8.9% compound annual growth rate demonstrates Asia Pacific's significant but measured pace of adoption compared to global market dynamics. Asia Pacific's LEO satellite sector is driven by government initiatives, commercial space investments, and the region's geographic diversity requiring advanced satellite infrastructure.
- Key markets within Asia Pacific include India, China, Japan, and Southeast Asian nations, each pursuing indigenous satellite programs and partnerships.
- By 2030, Asia Pacific is expected to capture an increasingly important share of global LEO satellite applications, supported by expanding broadband coverage, IoT connectivity, and disaster management capabilities tailored to the region's unique requirements..
Key Market Statistics
- CAGR (2025-2030) 8.9% CAGR
- Market Size, 2025 ~USD 4053.2 Million
- Forecast, 2030 ~USD 6211.1 Million
- Geography Asia Pacific
Asia Pacific LEO Satellite Market Overview
Market Valuation & Growth :
Asia Pacific LEO satellite market valued at $4,053.2 million in 2025, expanding to $6,211.1 million by 2030, representing an 8.9% CAGR—demonstrating robust regional demand for satellite connectivity solutions.
China's Market Leadership :
China dominates Asia Pacific with $3,445.1 million market size, driven by government-backed satellite initiatives, space infrastructure investments, and growing commercial satellite constellation deployments across the region.
Emerging Connectivity Demand :
Rapid urbanization and digital transformation across Asia Pacific economies are fueling demand for LEO satellite-based broadband, IoT connectivity, and remote area coverage in underserved regions.
Strategic Regional Players :
India ($935.8M), Japan ($540.8M), and South Korea ($361.3M) represent significant growth opportunities, with increasing investments in indigenous satellite programs and space technology development.
Asia Pacific LEO Satellite Market Dynamics
- Countries like China, India, and Japan are investing heavily in indigenous satellite constellations to enhance regional connectivity, earth observation capabilities, and communication resilience.
- The region's 8.9% CAGR reflects strong demand from telecommunications providers, government agencies, and emerging commercial operators seeking cost-effective satellite solutions. Key growth catalysts include rising demand for rural broadband connectivity, disaster management applications, and IoT services across Asia Pacific's diverse geographies.
- Strategic partnerships between regional players and international satellite operators are accelerating market penetration.
- As spectrum allocation improves and regulatory frameworks mature, the Asia Pacific LEO satellite market is expected to capture increasing share of global satellite investments, positioning the region as a critical hub for next-generation satellite communications and earth observation services..
Market Ecosystem
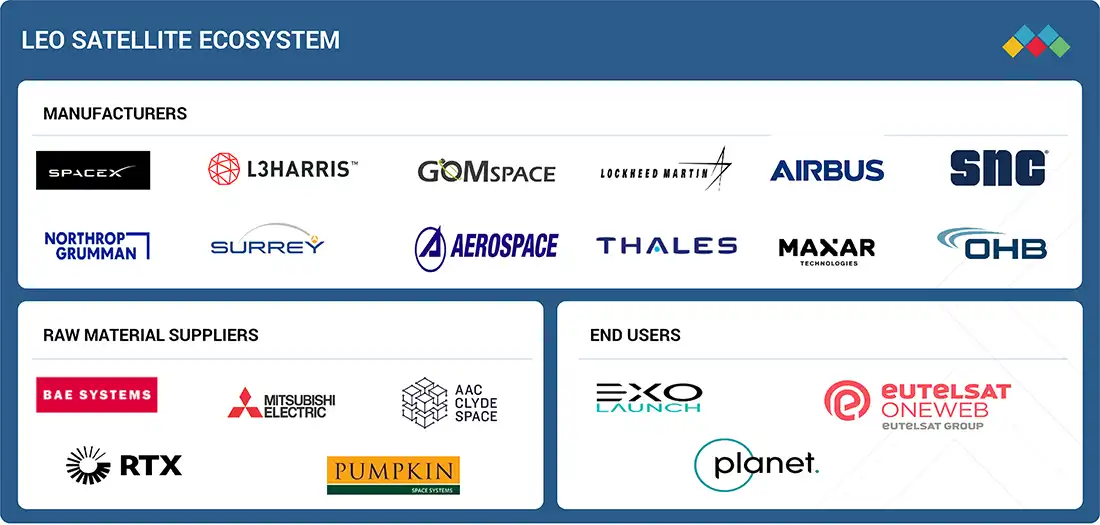
LEO satellite market: COMMERCIAL USE CASES ACROSS INDUSTRIES
| COMPANY | USE CASE DESCRIPTION | BENEFITS |
|---|---|---|
 |
IoT satellites with SDR payloads | Enables real-time IoT connectivity and sensor data relay in remote areas |
 |
RF monitoring constellation | Provides global RF spectrum mapping and accurate signal detection |
 |
Ionosphere measurement nanosatellites | Delivers precision data on magnetic and electric fields |
 |
Earth observation satellites | Offers daily imagery for agriculture, climate, and defense |
 |
Nanosatellites for weather and tracking | Tracks weather, ships (AIS), and aircraft (ADS-B) |
 |
SAR Earth observation satellites | Provides all-weather, high-resolution radar imagery |
Logos and trademarks shown above are the property of their respective owners. Their use here is for informational and illustrative purposes only.
Related Ecosystem
Space
- C-Band
- Small Satellite
- Antennas
- Ka-Band
- Microsatellite
- AIRBUS
- L3Harris Technologies, Inc.
- Thales group
- Northrop Grumman Corporation
- LOCKHEED MARTIN CORPORATION
Key Takeaways
- Asia Pacific LEO satellite market valued at $4,053.2 million in 2025, growing to $6,211.1 million by 2030 at 8.9% CAGR
- Asia Pacific's growth is driven by government space programs, commercial investments, and demand for regional connectivity solutions
- Asia Pacific encompasses diverse markets including India, China, Japan, and Southeast Asia, each with distinct satellite application needs
- Asia Pacific's LEO satellite sector supports broadband expansion, IoT deployment, and disaster management across the geographically dispersed region
LEO Satellite Market Report Scope
| Report Metric | Details |
|---|---|
| Base Year | 2025 |
| Fastest Growing Segment | LASER/OPTICAL (Frequency) |
| Forecast Period | 2025–2030 |
| Growth Rate | CAGR of 11.9% from 2025 to 2030 |
| Largest Segment | COMMERCIAL (End Use) |
| Market Size Base Year (Billions) | ~USD 11.79 (2025) |
| Revenue Forecast (Billions) | ~USD 20.69 (2030) |
| Segments Covered | Satellite Mass, Type, Subsystem, Propulsion, Payload, Application, End Use, Frequency |
Asia Pacific LEO Satellite Market Report Segmentation
8 segment dimensions are covered across the global market.
By Satellite Mass
- Cubesats
- Large Satellites
- Medium Satellites
- Small Satellites
By Type
- Academic & Research Institutions
- Attitude & Orbital Control Systems
- Command & Data Handling Systems
- Communication Payloads/Transponders
- Departments Of Defense & Intelligence Agencies
- Electrical Power Systems
- Energy Industry
- Hyperspectral And Multispectral Imagers
- Media & Entertainment
- Micro Satellites (11–100 Kg)
- Mini Satellites (101–500 Kg)
- Nano Satellites (1–10 Kg)
- National Mapping & Topographic Agencies
- National Space Agencies
- Optical And Infrared
- Others (Ais)
- Propulsion
- Radar Payloads
- Satellite Operators/Owners
- Scientific Research & Development
- Search & Rescue Entities
- Smallsats (501–1,000 Kg)
- Structures
- Telemetry, Tracking, & Command (Tt&C)
- Thermal Systems
By Subsystem
- Payloads
- Satellite Antennas
- Satellite Buses
- Solar Panels
By Propulsion
- Chemical Propulsion
- Electric Propulsion
- Hybrid Propulsion
By Payload
- Software-Defined Payloads
- Traditional Payloads
By Application
- Communication
- Earth Observation & Remote Sensing
- Scientific Research
- Technology
By End Use
- Commercial
- Dual Use
- Government & Military
By Frequency
- C-Band
- Hf/Vhf/Uhf-Band
- Ka-Band
- Ku-Band
- L-Band
- Laser/Optical
- Q/V-Band
- S-Band
- X-Band
Target Audience
- Satellite Operators & Constellation Developers : Need Asia Pacific-specific market data to identify deployment opportunities, assess regional demand for LEO services, and develop localized business strategies for constellation expansion.
- Telecommunications & ISP Providers : Require detailed market insights to evaluate LEO satellite partnerships, plan broadband service offerings, and understand competitive positioning across Asia Pacific's connectivity landscape.
- Government & Space Agencies : Utilize market analysis to inform national space policy, allocate funding for indigenous satellite programs, and benchmark regional capabilities against competitors in Asia Pacific.
- Investment & Private Equity Firms : Need comprehensive regional market data to identify high-growth opportunities, assess portfolio companies' market positioning, and evaluate LEO satellite sector investments across Asia Pacific.
- Technology & Equipment Manufacturers : Require market forecasts and regional demand analysis to plan product development, supply chain strategies, and sales expansion for LEO satellite ground equipment and components.
Key Companies in the Asia Pacific LEO Satellite Market
| Company | HQ | Ownership | Strongest segments |
|---|---|---|---|
| EUTELSAT COMMUNICATIONS S.A. | France | ||
| SATELLOGIC | United States | Public Company | Optical payload data & analytics,Satellite bus & space systems (sales and support),Constellation-as-a-service & sovereign constellations, |
| TERRAN ORBITAL CORPORATION | United States | Private Company | Satellite Bus – Command & Data Handling,Satellite Bus – Electric Power System,Payload – Optical / Infrared / Radar, |
| SPIRE GLOBAL INC. | United States | Public Company | Space Reconnaissance (defense, intelligence, national security),Aviation (satellite-based aircraft tracking),Weather and Climate (data and predictive analytics), |
| RAYTHEON TECHNOLOGIES CORPORATION | United States | Public Company | Payload – Radar,Payload – Infrared,Payload – Optical, |
| PLANET LABS, INC | United States | Public Company | Optical payload data (SuperDove, SkySat, Pelican),Hyperspectral payload data (Tanager),Earth Observation platform and analytics (APIs, browser apps), |
| SPACE EXPLORATION TECHNOLOGIES CORP. | United States | Public Company | Satellite Bus (Command & Data Handling, Electric Power System),Payload (Optical, Infrared, Radar),Solar Panel, |
| SPACEX | United States | Public Company | Satellite Bus (Command & Data Handling, Electric Power System),Payload (Broadband-focused RF payloads, including phased arrays),Solar Panels, |
| LOCKHEED MARTIN CORPORATION | United States | Public Company | Satellite Bus – Command & Data Handling,Satellite Bus – Electric Power System,Payload – Optical / Infrared / Radar, |
| NORTHROP GRUMMAN | United States | Public Company | Satellite Bus (Command & Data Handling, Electric Power System),Payload (Optical, Infrared, Radar),Solar Panel, |
| L3HARRIS TECHNOLOGIES, INC. | United States | Public Company | Satellite Bus – Command & Data Handling,Satellite Bus – Electric Power System,Payload – Optical, |
| PLANET LABS PBC | United States | Public Company | Optical payload data subscriptions (Dove/SuperDove),High-resolution tasked imagery (SkySat),Value-added analytics and monitoring services, |
| MAXAR TECHNOLOGIES | United States | Private Company | Payload-derived data (optical, radar) and analytics platforms,Mission software, C2, and digital twin solutions,Satellite bus, solar panel, and antenna-related activities, |
| GOMSPACE | Denmark | Public Company | Satellite Bus (Command & Data Handling, Electric Power System, AOCS, structures),Payloads (mission payloads across optical, RF, and specialized sensors),Power, Communication Systems, Solar Panels, and Antennas, |
| MITSUBISHI ELECTRIC CORPORATION | Japan | Public Company | Satellite Bus – Command & Data Handling,Satellite Bus – Electric Power System,Payload – Optical, |
| CHINA AEROSPACE SCIENCE AND TECHNOLOGY CORPORATION | China | Private Company | Satellite Bus – Command & Data Handling,Satellite Bus – Electric Power System,Payload – Optical, |
EUTELSAT COMMUNICATIONS S.A.
Eutelsat Communications S.A. is a French satellite operator providing telecommunications and broadcasting services through a fleet of geostationary satellites.
SATELLOGIC
Satellogic is a United States-based public company founded in 2010 with 154 employees that operates in the satellite imagery and Earth observation sector.
TERRAN ORBITAL CORPORATION
Terran Orbital Corporation is a United States-based private company founded in 2013 with 660 employees specializing in satellite manufacturing and space systems.
SPIRE GLOBAL INC.
Spire Global Inc. is a United States-based public company founded in 2012 with 375 employees providing satellite-based data and analytics for maritime, aviation, and weather applications.
RAYTHEON TECHNOLOGIES CORPORATION
Raytheon Technologies Corporation is a United States-based public company founded in 1934 with 180,000 employees providing aerospace and defense technologies and services.
PLANET LABS, INC
Planet Labs, Inc. is a United States-based public company founded in 2010 with 973 employees operating a constellation of Earth imaging satellites for global monitoring and analysis.
SPACE EXPLORATION TECHNOLOGIES CORP.
Space Exploration Technologies Corp. is a United States-based public company founded in 2002 with 21,000 employees developing rockets and spacecraft for commercial and government missions.
SPACEX
SpaceX is a United States-based public company founded in 2002 with 22,000 employees designing and manufacturing rockets and spacecraft for commercial and government space missions.
LOCKHEED MARTIN CORPORATION
Lockheed Martin Corporation is a United States-based public company founded in 1912 with 123,000 employees providing aerospace, defense, and security solutions.
NORTHROP GRUMMAN
Northrop Grumman is a United States-based public company founded in 1939 with 95,000 employees providing aerospace, defense, and security technologies and services.
L3HARRIS TECHNOLOGIES, INC.
L3Harris Technologies, Inc. is a United States-based public company founded in 1895 with 45,000 employees specializing in aerospace, defense, and security solutions.
PLANET LABS PBC
Planet Labs PBC is a United States-based public company founded in 2010 operating Earth imaging satellites for global monitoring and geospatial intelligence.
MAXAR TECHNOLOGIES
Maxar Technologies is a United States-based private company founded in 1957 with 4,600 employees specializing in satellite imagery, geospatial intelligence, and space infrastructure.
GOMSPACE
GOMSPACE is a Denmark-based public company founded in 2007 with 208 employees manufacturing small satellites and spacecraft subsystems.
MITSUBISHI ELECTRIC CORPORATION
Mitsubishi Electric Corporation is a Japan-based public company founded in 1921 with 150,386 employees providing electrical equipment, electronics, and space systems.
CHINA AEROSPACE SCIENCE AND TECHNOLOGY CORPORATION
China Aerospace Science and Technology Corporation is a China-based private company founded in 1956 engaged in aerospace and space technology development and manufacturing.
Countries within Asia Pacific - compare and drill down
| Country | 2025 size (native) |
|---|---|
| China | USD 3445.1 Million |
| India | USD 935.8 Million |
| Japan | USD 540.8 Million |
| South Korea | USD 361.3 Million |
| Australia | USD 409.6 Million |
| Rest Of Asia Pacific | USD 518.5 Million |
Country market size visualization
Reasons to Buy this Report
- Regional Market Segmentation : Detailed breakdown of Asia Pacific LEO satellite market by country, including China ($3.4B), India ($935.8M), and Japan ($540.8M), enabling targeted investment and expansion strategies.
- Growth Trajectory Analysis : Comprehensive 5-year forecast (2025-2030) with 8.9% CAGR projections specific to Asia Pacific, supporting strategic planning and resource allocation decisions for market entry and scaling.
- Competitive Landscape Intelligence : Identify emerging regional players, government-backed initiatives, and partnership opportunities across Asia Pacific's diverse satellite ecosystem and regulatory environments.
- Demand Driver Insights : Understand region-specific connectivity gaps, rural broadband requirements, disaster management needs, and IoT applications driving LEO satellite adoption across Asia Pacific markets.
- Investment & Risk Assessment : Evaluate market maturity, regulatory frameworks, and growth potential across individual Asia Pacific countries to optimize portfolio allocation and minimize regional market risks.
Frequently asked questions
What is the current size of the Asia Pacific LEO satellite market?
The Asia Pacific LEO satellite market is valued at $4,053.2 million in 2025 and is projected to reach $6,211.1 million by 2030.
What is the growth rate of the Asia Pacific LEO satellite market?
Asia Pacific's LEO satellite market is expected to grow at a compound annual growth rate (CAGR) of 8.9% from 2025 to 2030.
Which countries are driving growth in Asia Pacific's LEO satellite market?
Key markets within Asia Pacific include India, China, Japan, and Southeast Asian nations, each pursuing indigenous satellite programs and commercial partnerships.
What are the primary applications of LEO satellites in Asia Pacific?
Asia Pacific LEO satellites are deployed for broadband connectivity, earth observation, IoT services, disaster management, and communication infrastructure across the region.
How does Asia Pacific's LEO satellite market compare to global growth?
Asia Pacific's 8.9% CAGR reflects steady regional growth, demonstrating measured adoption relative to the global market's 11.9% CAGR through 2030.
RESEARCH METHODOLOGY
This research study on the LEO satellite market involved extensive use of secondary sources, directories, and databases such as Hoovers, Bloomberg BusinessWeek, and Factiva to identify and collect information relevant to the market. The primary sources considered included industry experts, as well as service providers, manufacturers, solution providers, technology developers, alliances, and organizations related to all segments of the value chain of this market. In-depth interviews with primary respondents, including key industry participants, subject matter experts, industry consultants, and C-level executives, were conducted to obtain and verify critical qualitative and quantitative information pertaining to the LEO satellite market and assess its growth prospects.
Secondary Research
The secondary sources referred to for this research study on the LEO satellite market included the financial statements of companies offering delivery drone software, drone transportation and logistics services, transportation and logistics solution providers, and various trade, business, and professional associations. The secondary data was collected and analyzed to arrive at the overall size of the LEO satellite market, which was validated by primary respondents.
Primary Research
In the primary research process, various sources from the supply and demand sides were interviewed to obtain qualitative and quantitative information on the market. Primary sources from the supply side included CXOs, VPs, directors, regional managers, business development and product development teams, distributors, and vendors. Meanwhile, stakeholders from the demand side included telecommunication companies, government and defense agencies, broadcasting services, and others willing to adopt LEO satellites. These interviews were conducted to gather insights such as market statistics, data on revenue collected from the products and services, market breakdowns, market size estimations, market size forecasting, and data triangulation. These interviews also helped analyze the market by satellite mass, application, end use, subsystem, and frequency segments for five key regions
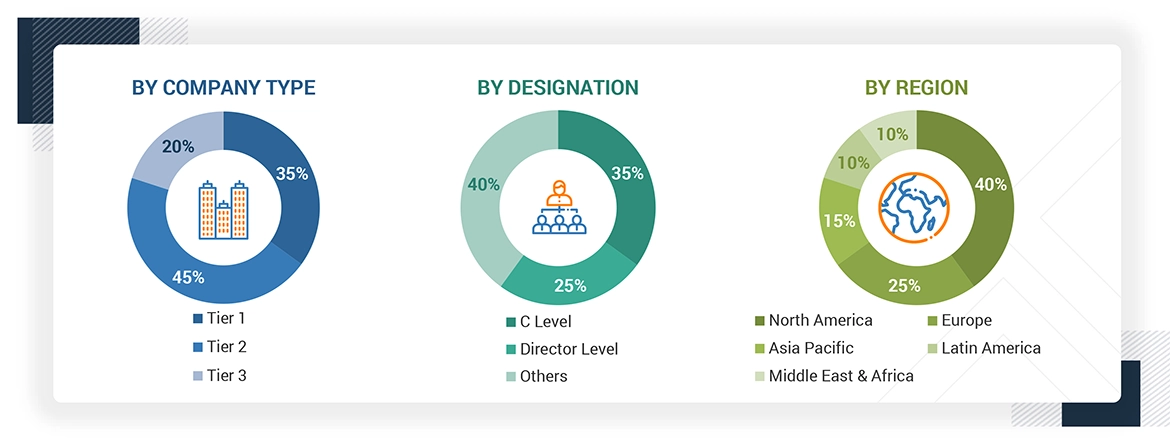
Note: Tier 1 = Company revenue over USD 1 billion, Tier 2 = Company revenue between USD 100 million and USD 1 billion, and Tier 3 = Company revenue less than USD 100 million.
To know about the assumptions considered for the study, download the pdf brochure
Market Size Estimation
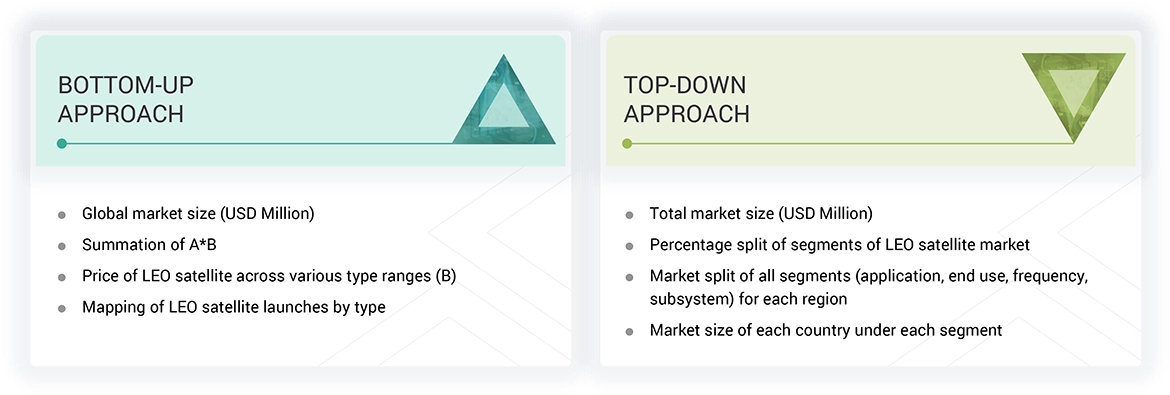
Both top-down and bottom-up approaches were used to estimate and validate the total size of the LEO satellite market. These methods were also used to calculate the size of various segments and subsegments of the market. The research methodology used to estimate the market size includes the following details:
- The key players were identified through secondary research, and their market ranking was determined through primary and secondary research. This included a study of the annual and financial reports of the top market players and extensive interviews of leaders, including CEOs, directors, and marketing executives.
- All percentage shares, splits, and breakdowns were determined using secondary sources and verified through primary sources. All possible parameters that affect the markets covered in this research study were accounted for, viewed in extensive detail, verified through primary research, and analyzed to obtain the final quantitative and qualitative data. This data was consolidated, enhanced with detailed inputs, analyzed by MarketsandMarkets, and presented in this report.
LEO Satellite Market : Top-Down and Bottom-Up Approach
Data Triangulation
After arriving at the overall size of the LEO satellite market from the market size estimation process explained above, the total market was split into several segments and subsegments. To complete the overall market engineering process and arrive at the exact statistics for various market segments and subsegments, data triangulation and market breakdown procedures explained below were implemented, wherever applicable. The data was triangulated by studying different factors and trends from both the demand and supply sides. The market size was also validated using both top-down and bottom-up approaches.
Market Definition
LEO satellites, or low Earth orbit satellites, are designed to operate in orbits that are relatively close to Earth, typically at altitudes of up to 2,000 kilometers (1,200 miles). These satellites are widely used for commercial communication, Earth observation, remote sensing, navigation, surveillance, meteorology, and scientific research. One defining feature of LEO satellites is their flexibility in orbit paths; unlike geostationary satellites that must orbit along the equator, LEO satellites can operate in tilted orbital planes, which allows for a greater variety of routes and coverage. This characteristic contributes to their popularity and utility across various sectors, including defense, civil, commercial, and governmental uses.
Key Stakeholders
- Satellite component manufacturers
- Satellite manufacturers
- Satellite integrators
- Launch service providers
- Government and civil organizations related to LEO satellite market
- Small satellite companies
- Payload suppliers
- Scientific institutions
- Meteorological organizations
- Component suppliers
- Technologists
- R&D staff
Report Objectives
- To define, describe, segment, and forecast the LEO satellite market based on satellite mass, subsystem, end use, application, frequency, and region
- To forecast the sizes of market segments with respect to five major regions: North America, Europe, Asia Pacific, the Middle East & Africa, and Latin America, along with major countries in each region
- To identify and analyze key drivers, restraints, opportunities, and challenges influencing market growth
- To analyze micromarkets with respect to individual growth trends, prospects, and their contribution to the overall market
- To analyze opportunities in the market for stakeholders by identifying market trends
- To profile key market players and comprehensively analyze their market shares and core competencies
- To analyze the degree of competition in the market by identifying key growth strategies, such as acquisitions, contracts, investments, new installations & upgrades, and partnerships, adopted by leading market players
- To identify detailed financial positions, key products, and unique selling points of leading companies in the market
Customizations options
Along with the market data, MarketsandMarkets offers customizations to meet the specific needs of companies. The following customization options are available for the report:
Product Analysis
- Product matrix, which gives a detailed comparison of the product portfolio of each company
Regional Analysis
- Further breakdown of the market segments at the country level
Company Information
- Detailed analysis and profiling of up to five additional market players
Get the Full LEO Satellite Market Report
Full forecast, segment splits, and company analysis for all LEO Satellite Market.
- US LEO Satellite Market
- Canada LEO Satellite Market
- UK LEO Satellite Market
- Germany LEO Satellite Market
- France LEO Satellite Market
- Italy LEO Satellite Market
- Russia LEO Satellite Market
- China LEO Satellite Market
- India LEO Satellite Market
- Japan LEO Satellite Market
- South Korea LEO Satellite Market
- Australia LEO Satellite Market
- Mexico LEO Satellite Market
- Argentina LEO Satellite Market
- Israel LEO Satellite Market
- Rest Of Europe LEO Satellite Market
- Rest Of Asia Pacific LEO Satellite Market
- Rest Of Latin America LEO Satellite Market
- GCC LEO Satellite Market
Need a Tailored Report?
Customize this report to your needs
Get 10% FREE Customization
Customize This Report
