
Asia Pacific ModelOps Market (2024-2029)

The Asia Pacific ModelOps Market was valued at $1543 Million in 2024 and projected to reach to $9494.6 Million by 2029, representing a compound annual growth rate of 43.8%. The Asia Pacific ModelOps market is positioned for transformative growth through 2029, fueled by widespread enterprise adoption of AI and machine learning technologies across manufacturing, finance, and technology sectors.


| Market Size in | USD 26.32 MN |
| Market Forecast in | |
| CAGR | |
| Forecast Period | |
| Units Considered | Value (USD MN) |
Asia Pacific ModelOps Market Trends and Insights
- Asia Pacific's 43.8% compound annual growth rate significantly outpaces global trends, driven by rapid digital transformation and increased adoption of machine learning operations across the region.
- Enterprise organizations in Asia Pacific are prioritizing ModelOps solutions to streamline model deployment, governance, and lifecycle management as AI initiatives scale. Asia Pacific's dominance in technology innovation and cloud infrastructure investment positions the region as a critical hub for ModelOps expansion.
- Major economies within Asia Pacific are investing heavily in AI talent, regulatory frameworks, and enterprise automation capabilities.
- The forecast period through 2029 reflects Asia Pacific's accelerating demand for integrated platforms that enable continuous model monitoring, version control, and cross-functional collaboration between data science and operations teams..
Key Market Statistics
- CAGR (2024-2029) 43.8% CAGR
- Market Size, 2024 ~USD 1543 Million
- Forecast, 2029 ~USD 9494.6 Million
- Geography Asia Pacific
Asia Pacific ModelOps Market Overview
Exceptional Regional Growth :
Asia Pacific's ModelOps market is expanding at 43.8% CAGR, significantly outpacing the global growth rate of 40.2%, driven by accelerated digital transformation initiatives across the region.
Market Valuation Trajectory :
The region's market is valued at $1,543.0 million in 2024 and is projected to reach $9,494.6 million by 2029, representing a 516% increase over the five-year forecast period.
Enterprise ML Adoption Surge :
Organizations across Asia Pacific are rapidly adopting machine learning operations to optimize AI model deployment, governance, and lifecycle management at enterprise scale.
China's Market Dominance :
China leads the Asia Pacific region with a market size of $16,759.5 million, followed by Japan at $1,524.3 million and South Korea at $1,338.7 million, establishing the region as a global ModelOps powerhouse.
Asia Pacific ModelOps Market Dynamics
- Countries including China, Japan, South Korea, and India are investing heavily in AI infrastructure and talent development, creating robust demand for ModelOps solutions that streamline model development, deployment, and monitoring. Regional factors including government AI initiatives, increasing cloud adoption, and the emergence of local ModelOps vendors are accelerating market expansion.
- Organizations are prioritizing operational efficiency and risk mitigation in their ML initiatives, driving investment in comprehensive ModelOps platforms.
- This momentum positions Asia Pacific as the fastest-growing region globally, with enterprises recognizing ModelOps as critical infrastructure for competitive advantage..
Market Ecosystem
Related Ecosystem
Software And Services
- Natural Language Processing (NLP)
- Machine Learning
- Supply Chain Management
- Predictive Analytics
- Image Sensors
- International Business Machines Corporation
- MICROSOFT CORPORATION
- Oracle Corporation
- SAP SE
- Amazon.com, Inc.
Analytics
- Natural Language Processing (NLP)
- Machine Learning
- Supply Chain Management
- Predictive Analytics
- Image Sensors
- International Business Machines Corporation
- MICROSOFT CORPORATION
- Oracle Corporation
- SAP SE
Cloud Computing
- Software as A Service (SaaS)
- Natural Language Processing (NLP)
- Platform as A Service (PaaS)
- Machine Learning
- Supply Chain Management
- International Business Machines Corporation
- MICROSOFT CORPORATION
- Oracle Corporation
- Amazon.com, Inc.
Key Takeaways
- Asia Pacific ModelOps market will grow from $1,543.0M (2024) to $9,494.6M (2029), representing a 43.8% CAGR.
- Asia Pacific's growth rate exceeds the global average, reflecting the region's accelerated AI and machine learning adoption.
- Enterprise digital transformation initiatives across Asia Pacific are driving demand for ModelOps governance and deployment automation.
- Asia Pacific's investment in cloud infrastructure and AI talent creates a competitive advantage for ModelOps solution providers.
ModelOps Market Report Scope
| Report Metric | Details |
|---|---|
| Base Year | 2024 |
| Fastest Growing Segment | SMES (Organization Size) |
| Forecast Period | 2024-2029 |
| Growth Rate | CAGR of 40.2% from 2024 to 2029 |
| Largest Segment | MACHINE LEARNING (Technology) |
| Market Size Base Year (Billions) | ~USD 5.45 (2024) |
| Revenue Forecast (Billions) | ~USD 29.5 (2029) |
| Segments Covered | Offering, Type, Deployment Mode, Model Type, Application, Vertical, Service, Component, Organization Size, Hardware, Services, Technology, Business Function |
Asia Pacific ModelOps Market Report Segmentation
13 segment dimensions are covered across the global market.
By Offering
- Hardware
- Platforms
- Services
- Software
By Type
- Automated Machine Learning (Automl) Platforms
- Consulting
- Deployment & Integration
- Development & Experimentation Platforms
- Discriminative AI
- Generative AI
- Model Explainability & Interpretability Tools
- Monitoring & Observability Tools
- Other Types
- Performance Tracking & Management Platforms
- Serving & Deployment Tools
- Support & Maintenance
By Deployment Mode
- Cloud
- On-Premises
By Model Type
- Agent-Based Models
- Bring Your Own Models
- Graph-Based Models
- Linguistic Models
- ML Models
- Other Model Types
- Rule & Heuristic Models
By Application
- Batch Scoring
- Continuous Integration/Continuous Deployment
- Dashboard & Reporting
- Governance, Risk, & Compliance
- Model Lifecycle Management
- Monitoring & Alerting
- Other Applications
- Parallelization & Distributed Computing
By Vertical
- Agriculture
- Automotive, Transportation & Logistics
- Bfsi
- Energy & Utilities
- Government & Defense
- Healthcare & Life Sciences
- Healthcare& Life Sciences
- It & Ites
- It/Ites
- Manufacturing
- Media & Entertainment
- Other Verticals
- Retail & E-Commerce
- Retail & Ecommerce
- Telecom
- Telecommunications
- Transportation & Logistics
By Service
- Consulting
- Deployment & Integration
- Support & Maintenance
By Component
- Platforms
- Services
By Organization Size
- Large Enterprises
- Smes
By Hardware
- AI Accelerators
- Memory
- Networking Hardware
- Processors
By Services
- Managed Services
- Professional Services
By Technology
- Computer Vision
- Context-Aware AI
- Machine Learning
- Natural Language Processing
By Business Function
- Cybersecurity
- Finance & Accounting
- Human Resources
- Marketing & Sales
- Operations
Target Audience
- Enterprise Technology Leaders : CIOs and technology executives in Asia Pacific need detailed market intelligence to evaluate ModelOps investments, benchmark against regional peers, and align ML operations with business objectives.
- ModelOps Solution Providers : Vendors and software companies require Asia Pacific market data to identify growth opportunities, assess competitive positioning, and develop region-specific go-to-market strategies.
- Investment & Private Equity Firms : Investors evaluating opportunities in the Asia Pacific tech sector need comprehensive market sizing and growth forecasts to assess portfolio companies and identify acquisition targets.
- Management Consultants : Consulting firms advising enterprises on digital transformation and AI strategy require Asia Pacific ModelOps market insights to support client recommendations and validate business cases.
- Government & Policy Organizations : Regional government bodies and policy makers need market intelligence to inform AI infrastructure investments, regulatory frameworks, and technology adoption initiatives across Asia Pacific.
Countries within Asia Pacific - compare and drill down
| Country | 2025 size (native) |
|---|---|
| China | USD 16759.5 Million |
| Japan | USD 1524.3 Million |
| South Korea | USD 1338.7 Million |
| India | USD 1129.9 Million |
| Anz | USD 1025.4 Million |
| Rest Of Asia Pacific | USD 302.1 Million |
Country market size visualization
Reasons to Buy this Report
- Regional Market Sizing & Forecasts : Obtain precise market valuations for Asia Pacific and individual countries including China, Japan, South Korea, India, and ANZ with detailed 2024-2029 projections to inform strategic planning.
- Competitive Landscape Intelligence : Understand the competitive dynamics specific to Asia Pacific, including local vendors, regional partnerships, and market consolidation trends shaping the ModelOps ecosystem.
- Growth Driver Analysis : Identify region-specific catalysts including digital transformation initiatives, government AI policies, cloud adoption rates, and enterprise ML maturity levels driving 43.8% CAGR growth.
- Country-Level Opportunity Assessment : Evaluate market potential across major Asia Pacific economies with differentiated insights on adoption rates, investment priorities, and sector-specific demand patterns.
- Strategic Market Entry Guidance : Leverage Asia Pacific-focused insights to develop market entry strategies, identify partnership opportunities, and prioritize resource allocation across the region's high-growth markets.
Frequently asked questions
What is the projected size of the Asia Pacific ModelOps market in 2029?
The Asia Pacific ModelOps market is projected to reach $9,494.6 million by 2029, growing from $1,543.0 million in 2024.
What is the CAGR for the Asia Pacific ModelOps market?
Asia Pacific's ModelOps market is expected to grow at a compound annual growth rate of 43.8% between 2024 and 2029.
Why is Asia Pacific experiencing faster ModelOps growth than the global average?
Asia Pacific's rapid digital transformation, substantial cloud infrastructure investment, and growing AI talent pool are driving ModelOps adoption faster than global trends.
Which industries in Asia Pacific are driving ModelOps demand?
Financial services, technology, telecommunications, and e-commerce sectors in Asia Pacific are leading ModelOps adoption to optimize AI model deployment and governance.
What are the key challenges for ModelOps adoption in Asia Pacific?
Regulatory fragmentation across Asia Pacific countries, skills gaps in MLOps expertise, and varying cloud infrastructure maturity levels present adoption challenges.
RESEARCH METHODOLOGY
The research study for the ModelOps Market involved extensive secondary sources, directories, and several journals. Primary sources were mainly industry experts from the core and related industries, preferred modelOps platforms providers, third-party service providers, consulting service providers, end users, and other commercial enterprises. In-depth interviews with primary respondents, including key industry participants and subject matter experts, were conducted to obtain and verify critical qualitative and quantitative information and assess the market’s prospects.
Secondary Research
The market size of companies offering modelOps platforms and services was determined based on secondary data from paid and unpaid sources. It was also arrived at by analyzing the product portfolios of major companies and rating the companies based on their performance and quality.
In the secondary research process, various sources were referred to for identifying and collecting information for this study. Secondary sources included annual reports, press releases, and investor presentations of companies; white papers, journals, and certified publications; and articles from recognized authors, directories, and databases. The data was also collected from other secondary sources, such as journals, government websites, blogs, and vendor websites. Additionally, modelOps spending of various countries was extracted from the respective sources. Secondary research was mainly used to obtain key information related to the industry’s value chain and supply chain to identify key players based on platforms, services, market classification, and segmentation according to offerings of major players, industry trends related to offering, data type, data processing, vertical, and region, and key developments from both market- and technology-oriented perspectives
Primary Research
In the primary research process, various primary sources from both the supply and demand sides were interviewed to obtain qualitative and quantitative information on the market. The primary sources from the supply side included various industry experts, including Chief Experience Officers (CXOs); Vice Presidents (VPs); directors from business development, marketing, and modelOps expertise; related key executives from modelOps platform vendors, System Integrators (SIs), professional service providers, and industry associations; and key opinion leaders.
Primary interviews were conducted to gather insights, such as market statistics, revenue data collected from platforms and services, market breakups, market size estimations, market forecasts, and data triangulation. Primary research also helped understand various trends related to technologies, applications, deployments, and regions. Stakeholders from the demand side, such as Chief Information Officers (CIOs), Chief Technology Officers (CTOs), Chief Strategy Officers (CSOs), and end users using modelOps, were interviewed to understand the buyer’s perspective on suppliers, products, service providers, and their current usage of modelOps platform and services which would impact the overall ModelOps Market.
The following is the breakup of primary profiles:
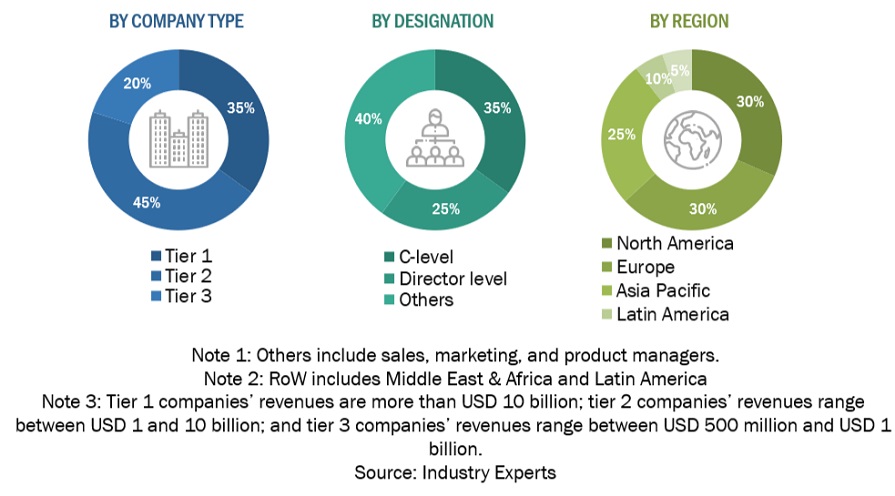
To know about the assumptions considered for the study, download the pdf brochure
Market Size Estimation
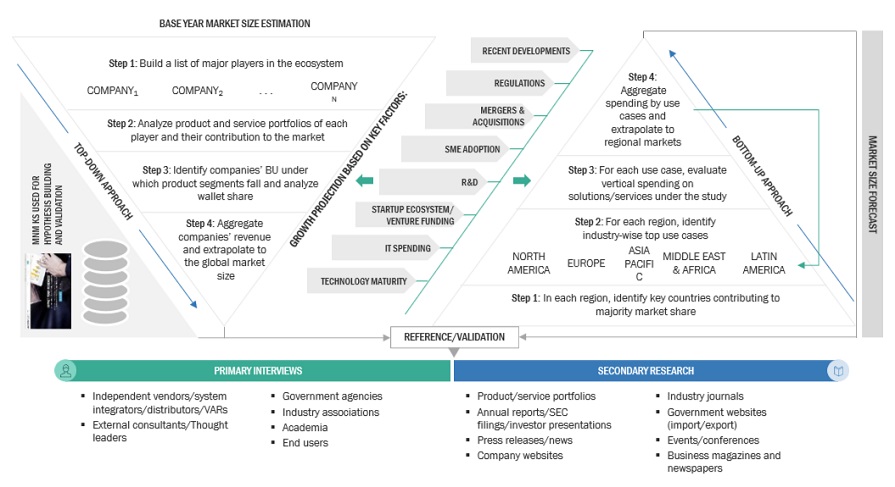
Multiple approaches were adopted for estimating and forecasting the ModelOps Market. The first approach estimates market size by summating companies’ revenue generated by selling platforms and services.
Market Size Estimation Methodology-Top-down approach
In the top-down approach, an exhaustive list of all the vendors offering platforms and services in the ModelOps Market was prepared. The revenue contribution of the market vendors was estimated through annual reports, press releases, funding, investor presentations, paid databases, and primary interviews. Each vendor’s offerings were evaluated based on the breadth of offering, data type, data processing, vertical, and region. The aggregate of all the companies’ revenue was extrapolated to reach the overall market size. Each subsegment was studied and analyzed for its global market size and regional penetration. The markets were triangulated through both primary and secondary research. The primary procedure included extensive interviews for key insights from industry leaders, such as CIOs, CEOs, VPs, directors, and marketing executives. The market numbers were further triangulated with the existing MarketsandMarkets repository for validation.
Market Size Estimation Methodology-Bottom-up approach
The bottom-up approach identified the adoption rate of modelOps offerings among different end users in key countries, with their regions contributing the most to the market share. For cross-validation, the adoption of the modelOps platform and services among industries, along with different use cases concerning their regions, was identified and extrapolated. Use cases identified in the different areas were given weightage for the market size calculation.
Based on the market numbers, the regional split was determined by primary and secondary sources. The procedure included the analysis of the ModelOps Market’s regional penetration. Based on secondary research, the regional spending on Information and Communications Technology (ICT), socio-economic analysis of each country, strategic vendor analysis of major modelOps platforms providers, and organic and inorganic business development activities of regional and global players were estimated. With the data triangulation procedure and data validation through primaries, the exact values of the overall ModelOps Market size and segments’ size were determined and confirmed using the study.
Top-down and Bottom-up approaches
To know about the assumptions considered for the study, Request for Free Sample Report
Data Triangulation
The market was split into several segments and subsegments after arriving at the overall market size using the market size estimation processes as explained above. To complete the overall market engineering process and arrive at the exact statistics of each market segment and subsegment, data triangulation and market breakup procedures were employed, wherever applicable. The overall market size was then used in the top-down procedure to estimate the size of other individual markets via percentage splits of the market segmentation.
Market Definition
According to SAS Institute, ModelOps refers to the systematic process through which analytical models are transferred from the data science team to the IT production team, ensuring a consistent cycle of deployment and updates. It is a crucial element in effectively leveraging AI models, yet only a few companies are currently utilizing this approach.
ModelOps (Model Operations) refers to the practices and tools used to streamline production deployment, monitoring, management, and governance of machine learning models. It focuses on ensuring models are reliable, scalable, and maintainable, bridging the gap between data science and IT operations to facilitate continuous delivery and integration of models.
Stakeholders
- ModelOps Market Platform Providers
- ModelOps Market Service Providers
- End-user Industries
- System Integrators (SIs)
- Business Intelligence Solution Providers
- Technology Providers
- Value-added Resellers (VARs)
- Government And Regulatory Bodies
Report Objectives
- To define, describe, and predict the ModelOps Market by offering, model type, application, vertical, and region
- To describe and forecast the ModelOps Market, in terms of value, by region—North America, Europe, Asia Pacific, Middle East & Africa, and Latin America
- To provide detailed information regarding major factors influencing the market growth (drivers, restraints, opportunities, and challenges)
- To strategically analyze micro markets with respect to individual growth trends, prospects, and contributions to the overall ModelOps Market
- To profile key players and comprehensively analyze their market positions in terms of ranking and core competencies, along with detailing the competitive landscape for market leaders
- To analyze competitive developments such as joint ventures, mergers and acquisitions, product developments, and ongoing research and development (R&D) in the ModelOps Market
- To provide the illustrative segmentation, analysis, and projection of the main regional markets
Available Customizations
With the given market data, MarketsandMarkets offers customizations per the company’s specific needs. The following customization options are available for the report:
Product Analysis
- The product matrix provides a detailed comparison of the product portfolio of each company.
Geographic Analysis as per Feasibility
- Further breakup of the North American ModelOps Market
- Further breakup of the European ModelOps Market
- Further breakup of the Asia Pacific ModelOps Market
- Further breakup of the Middle East & Africa ModelOps Market
- Further breakup of the Latin America ModelOps Market
Company Information
- Detailed analysis and profiling of additional market players (up to five)
Get the Full ModelOps Market Report
Full forecast, segment splits, and company analysis for all ModelOps Market.
- Germany ModelOps Market
- Italy ModelOps Market
- Rest Of Europe ModelOps Market
- Spain ModelOps Market
- Anz ModelOps Market
- India ModelOps Market
- Japan ModelOps Market
- Rest Of Asia Pacific ModelOps Market
- South Korea ModelOps Market
- Argentina ModelOps Market
- Brazil ModelOps Market
- Mexico ModelOps Market
- Rest Of Latin America ModelOps Market
- Egypt ModelOps Market
- Ksa ModelOps Market
- Qatar ModelOps Market
- South Africa ModelOps Market
- UAE ModelOps Market
- Canada ModelOps Market
- US ModelOps Market
- UK ModelOps Market
- China ModelOps Market
- France ModelOps Market
Need a Tailored Report?
Customize this report to your needs
Get 10% FREE Customization
Customize This Report
