
US Near-Eye Display Market (2025-2030)

The US Near-Eye Display Market was valued at $38.8 Million in 2025 and projected to reach to $387.3 Million by 2030, representing a compound annual growth rate of 58.5%. The US near-eye display market stands at an inflection point, driven by accelerating consumer adoption of AR/VR devices and enterprise digital transformation initiatives.


| Market Size in | USD 26.32 MN |
| Market Forecast in | |
| CAGR | |
| Forecast Period | |
| Units Considered | Value (USD MN) |
US Near-Eye Display Market Trends and Insights
- This represents a compound annual growth rate of 58.5%, significantly outpacing global market expansion.
- The US market is driven by strong demand from consumer electronics, augmented reality applications, and enterprise solutions across multiple sectors. US adoption of near-eye display technology is accelerating due to advances in miniaturization, improved optical performance, and declining component costs.
- The US maintains a competitive advantage through innovation in semiconductor manufacturing and software integration.
- Between 2025 and 2030, the US market is expected to capture substantial share of global near-eye display demand, supported by major technology companies and emerging startups investing heavily in AR/VR ecosystems. The US near-eye display sector benefits from robust venture capital funding, established supply chains, and early consumer adoption rates.
- Market expansion is fueled by applications in gaming, enterprise training, healthcare, and spatial computing.
- The US trajectory demonstrates the region's leadership in next-generation display technologies and immersive computing platforms..
Key Market Statistics
- CAGR (2025-2030) 58.5% CAGR
- Market Size, 2025 ~USD 38.8 Million
- Forecast, 2030 ~USD 387.3 Million
- Country US
US Near-Eye Display Market Overview
Explosive US Growth Trajectory :
The US near-eye display market is projected to grow from $38.8 million in 2025 to $387.3 million by 2030, representing a 58.5% CAGR—more than double the global growth rate of 25.1%.
AR/VR Consumer Adoption Surge :
Strong demand from US consumer electronics manufacturers and augmented reality applications is driving market expansion, with major tech companies investing heavily in next-generation wearable display technologies.
Enterprise Solution Penetration :
US enterprises across manufacturing, healthcare, and logistics sectors are rapidly adopting near-eye displays for workforce training, remote assistance, and operational efficiency improvements.
Tech Hub Innovation Leadership :
Silicon Valley and major US tech corridors are accelerating R&D in micro-display technologies, creating a competitive advantage and attracting significant venture capital investment in the sector.
US Near-Eye Display Market Dynamics
- Major technology companies are launching competitive products, while startups are innovating in micro-display optics and form factors.
- The market's 58.5% CAGR reflects strong tailwinds from gaming, social media, and industrial applications.
- By 2030, near-eye displays are expected to become mainstream consumer devices, with significant penetration in enterprise sectors including healthcare, manufacturing, and field service operations, positioning the US as a global innovation leader..
Market Ecosystem
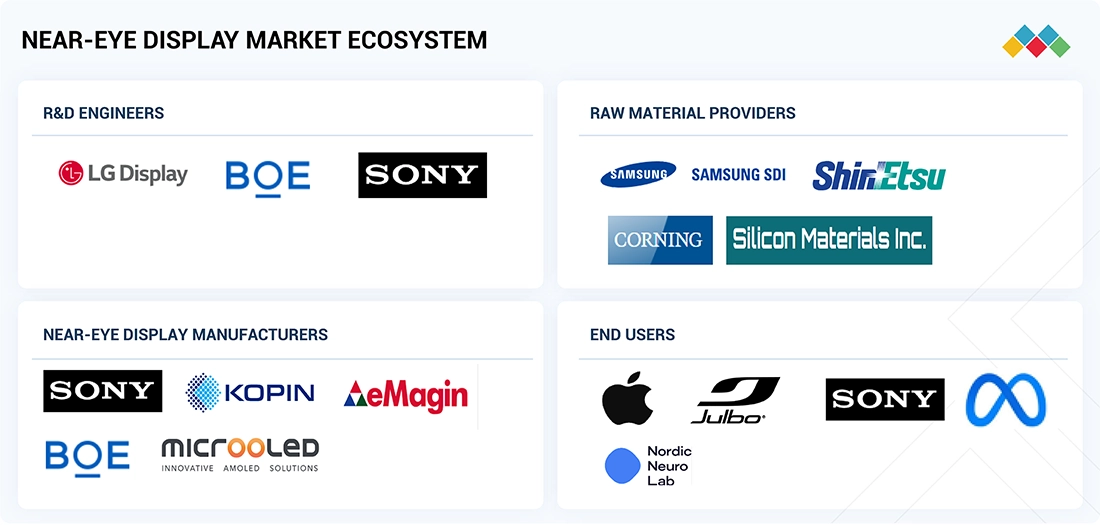
Near-Eye Display Market Trends: COMMERCIAL USE CASES ACROSS INDUSTRIES
| COMPANY | USE CASE DESCRIPTION | BENEFITS |
|---|---|---|
 |
Incorporates OLED microdisplay panels in electronic viewfinders (EVFs) of digital cameras, enabling high brightness, contrast, and color accuracy for precise image framing | Delivers sharp visuals, fast response times, and improved user experience for professional photography and videography. |
 |
Utilizes high-resolution micro-OLED panels in Vision Pro headsets to enable lifelike AR and VR visuals for spatial computing and immersive content interaction | Provides superior image clarity, wide color gamut, and enhanced visual realism, improving comfort and immersion |
 |
Uses Si-OLED display panels in Moverio smart glasses to project transparent, high-brightness AR visuals for industrial and enterprise operations | Ensures clear image projection, energy efficiency, and stable performance in varying light environments |
 |
Integrates micro-OLED panels in HoloLens headsets to deliver high-definition mixed-reality overlays and precise holographic visualization for enterprise use | Enables accurate 3D visualization, minimizes motion blur, and enhances user engagement during extended operation |
 |
Employs OLED panels in Vive VR headsets to achieve high refresh rates and wide field-of-view visuals for immersive VR environments | Offers low latency, smooth motion rendering, and deeper visual immersion for gaming and simulation applications |
Logos and trademarks shown above are the property of their respective owners. Their use here is for informational and illustrative purposes only.
Related Ecosystem
Display Technology
Key Takeaways
- The US near-eye display market will grow from $38.8M (2025) to $387.3M (2030) at a 58.5% CAGR, demonstrating exceptional market momentum.
- US market growth is driven by consumer demand for AR/VR devices, enterprise applications, and spatial computing innovations.
- The US benefits from strong semiconductor manufacturing capabilities, venture capital investment, and early technology adoption.
- By 2030, the US near-eye display market is positioned as a critical component of the broader immersive computing ecosystem.
Near-Eye Display Market Report Scope
| Report Metric | Details |
|---|---|
| Base Year | 2025 |
| Fastest Growing Segment | MICROLED (Technology) |
| Forecast Period | 2025–2030 |
| Growth Rate | CAGR of 25.1% from 2025 to 2030 |
| Largest Segment | VR & MR (Device Type) |
| Market Size Base Year (Billions) | ~USD 2.17 (2025) |
| Revenue Forecast (Billions) | ~USD 6.65 (2030) |
| Segments Covered | Technology, Device Type, Vertical, Resolution |
US Near-Eye Display Market Report Segmentation
4 segment dimensions are covered across the global market.
By Technology
- Amoled
- Laser Beam Scanning
- Lcos
- Micro Led
- Microled
- Oledos
- Tft Lcd
By Device Type
- Ar
- Evf
- Evfs
- Vr & Mr
By Vertical
- Automotive
- Consumer
- Education
- Industrial & Enterprise
- Medical
- Military, Aerospace, & Defense
- Military, Defense, And Aerospace
- Other Verticals
- Retail & Hospitality
- Sports & Entertainment
By Resolution
- Fhd
- Hd
- Higher Than Fhd
- Lower Than Hd
Target Audience
- Technology Hardware Manufacturers : US-based and international OEMs need market sizing and competitive intelligence to develop near-eye display products and plan US market entry strategies.
- Enterprise Solution Providers : Companies building AR/VR applications for US enterprises require market data to validate demand, identify vertical opportunities, and forecast adoption rates.
- Venture Capital & Private Equity : Investors evaluating near-eye display startups and technology companies need US market projections and growth metrics to assess investment opportunities and exit potential.
- Strategic Business Planners : Corporate strategy teams at tech companies need detailed US market analysis to inform product roadmaps, M&A decisions, and resource allocation for AR/VR initiatives.
- Market Research & Consulting Firms : Research organizations and consultants require granular US market data to support client advisory work, competitive benchmarking, and industry trend reporting.
Key Companies in the US Near-Eye Display Market
| Company | HQ | Ownership | Strongest segments |
|---|---|---|---|
| SONY GROUP CORPORATION | Japan | Public Company | Electronic Viewfinders (EVFs) and camera near-eye modules,VR & MR device near-eye displays,AR device near-eye displays, |
| SEIKO EPSON CORPORATION | Japan | Public Company | AR Devices (smart glasses and optical engines),VR & MR Device Components,Electronic Viewfinders (EVFs), |
| BOE TECHNOLOGY GROUP CO., LTD. | China | Public Company | TFT LCD near-eye (VR, EVF, low-end MR),AMOLED near-eye (VR & MR headsets),Microdisplays (LCOS, OLEDOS) for AR and EVF, |
| SEEYA TECHNOLOGY | China | Public Company | AR Devices (OLEDoS-based),VR & MR Devices (OLEDoS-based),Electronic Viewfinders (EVFs), |
| KOPIN CORPORATION | United States | Public Company | TFT LCD microdisplays,LCOS / ferroelectric LCOS,OLED / OLEDOS, |
| HIMAX TECHNOLOGIES, INC. | Taiwan | Public Company | AR Devices (LCoS microdisplays, wafer-level optics, WiseEye-enabled modules),VR & MR Devices (OLED/TFT drivers, timing controllers),Electronic Viewfinders (EVFs) and industrial near-eye modules, |
| YUNNAN OLIGHTEK OPTO-ELECTRONIC TECHNOLOGY CO., LTD. | China | Private Company | AMOLED microdisplays for EVFs and optical viewfinders,AMOLED microdisplays for AR/MR/VR near-eye devices,AMOLED driver boards and modules, |
| LG DISPLAY CO., LTD. | South Korea | Public Company | TFT LCD near-eye panels,AMOLED near-eye panels,LCOS / OLEDOS microdisplays, |
| WISECHIP SEMICONDUCTOR INC. | Taiwan | Public Company | Monochrome / area-color and mini-OLED near-eye modules,Full-color and round/touch OLEDs for AR/VR peripherals,Transparent, bendable, and wide-temperature OLEDs, |
| OMNIVISION | United States | Private Company | AR Devices,VR & MR Devices,Electronic Viewfinders (EVFs), |
SONY GROUP CORPORATION
Sony Group Corporation is a Japanese public company founded in 1946 with 94,900 employees. The company operates as a diversified multinational conglomerate.
SEIKO EPSON CORPORATION
Seiko Epson Corporation is a Japanese public company founded in 1942 with 74,619 employees. The company operates in manufacturing and technology sectors.
BOE TECHNOLOGY GROUP CO., LTD.
BOE Technology Group Co., Ltd. is a Chinese public company founded in 1993 with 109,895 employees. The company is a major technology manufacturer.
SEEYA TECHNOLOGY
Seeya Technology is a Chinese public company founded in 2016. The company operates in the technology sector.
KOPIN CORPORATION
Kopin Corporation is a United States-based public company founded in 1984 with 145 employees. The company operates in the technology sector.
HIMAX TECHNOLOGIES, INC.
Himax Technologies, Inc. is a Taiwanese public company founded in 2001 with 2,200 employees. The company operates in the semiconductor and technology sectors.
YUNNAN OLIGHTEK OPTO-ELECTRONIC TECHNOLOGY CO., LTD.
Yunnan Olightek Opto-Electronic Technology Co., Ltd. is a Chinese private company founded in 2008 with 138 employees. The company operates in opto-electronic technology.
LG DISPLAY CO., LTD.
LG Display Co., Ltd. is a South Korean public company founded in 1985 with 25,057 employees. The company is a major display technology manufacturer.
WISECHIP SEMICONDUCTOR INC.
Wisechip Semiconductor Inc. is a Taiwanese public company founded in 2005 with 298 employees. The company operates in the semiconductor industry.
OMNIVISION
OmniVision is a United States-based private company founded in 1995 with 2,176 employees. The company operates in the technology and imaging sectors.
Reasons to Buy this Report
- Market-Specific Growth Intelligence : Gain detailed insights into the US market's 58.5% CAGR trajectory, understanding regional drivers and competitive dynamics that differ significantly from global trends.
- Segment & Application Analysis : Access comprehensive breakdowns of US consumer electronics, AR applications, and enterprise solution segments with market sizing and growth projections through 2030.
- Competitive Landscape Mapping : Identify key US-based players, emerging startups, and technology leaders shaping the near-eye display ecosystem with strategic positioning and market share analysis.
- Investment & Expansion Strategy : Make informed decisions on market entry, product development, and partnership opportunities with data-driven insights specific to US regulatory, consumer, and enterprise requirements.
- Technology Trend Forecasting : Stay ahead of micro-display innovations, form factor evolution, and emerging use cases in US markets for gaming, healthcare, manufacturing, and consumer applications.
Frequently asked questions
What is the current size of the US near-eye display market?
The US near-eye display market is valued at $38.8 million in 2025 and is projected to reach $387.3 million by 2030.
What is the growth rate of the US near-eye display market?
The US near-eye display market is growing at a compound annual growth rate (CAGR) of 58.5% from 2025 to 2030.
What are the primary drivers of growth in the US near-eye display market?
Key drivers include consumer demand for AR/VR applications, enterprise training solutions, gaming innovations, healthcare applications, and spatial computing advancements.
Which industries are adopting near-eye display technology in the US?
Major adopting sectors include consumer electronics, gaming, enterprise training, healthcare, defense, and spatial computing platforms.
How does the US near-eye display market compare to global growth?
The US market is growing at 58.5% CAGR, significantly faster than the global market's 25.1% CAGR, reflecting strong regional demand and innovation leadership.
RESEARCH METHODOLOGY
The research study involved four major activities in estimating the size of the near-eye display market. Exhaustive secondary research has been done to collect important information about the market and peer markets. The next step has been to validate these findings, assumptions, and sizing with the help of primary research with industry experts across the value chain. Both top-down and bottom-up approaches have been used to estimate the market size. The market breakdown and data triangulation techniques have been adopted to estimate the market sizes of segments and subsegments
Secondary Research
In the secondary research process, various secondary sources have been referred to for identifying and collecting information required for this study. The secondary sources include annual reports, press releases, investor presentations of companies, white papers, and articles from recognized authors. Secondary research has been done to obtain key information about the market’s value chain, the pool of key market players, market segmentation according to industry trends, regional outlook, and developments from both market and technology perspectives.
The near-eye display market report estimates the global market size using both top-down and bottom-up approaches and several other dependent submarkets. The major players in the market have been identified using extensive secondary research, and their presence in the market has been determined using secondary and primary research. All the percentage share splits and breakdowns have been determined using secondary sources and verified through primary sources.
Primary Research
Extensive primary research has been conducted after understanding the near-eye display market scenario through secondary research. Several primary interviews have been conducted with key opinion leaders from both demand- and supply-side vendors across four major regions—North America, Europe, Asia Pacific, and Rest of the World (RoW). Approximately 25% of the primary interviews have been conducted with the demand-side vendors and 75% with the supply-side vendors. Primary data has been collected mainly through telephonic interviews, which consist of 80% of the total primary interviews; questionnaires and emails have also been used to collect the data.
After successfully interacting with industry experts, brief sessions have been conducted with highly experienced independent consultants to reinforce our primary research findings. This, along with the opinions of the in-house subject-matter experts, has led us to the findings described in the report.
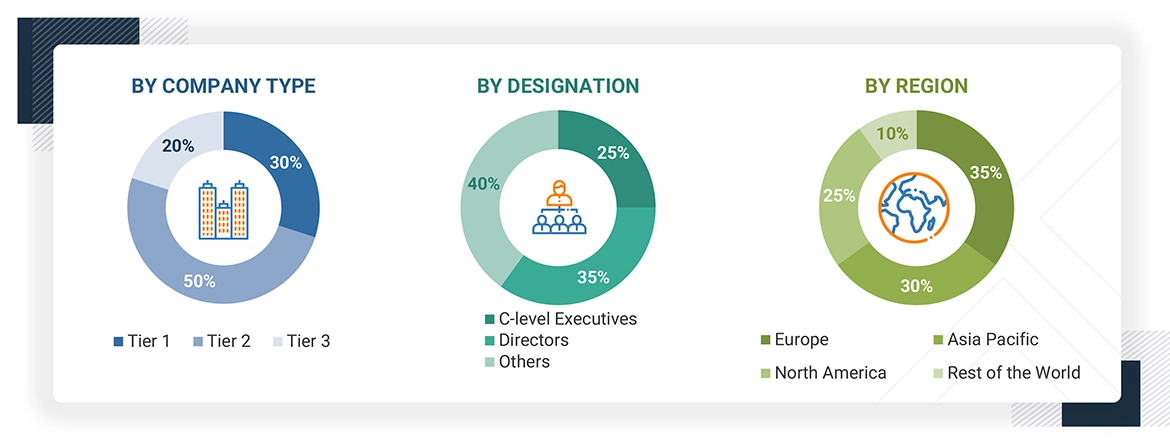
Note: Other designations include sales, marketing, and product managers.
The three tiers of the companies are based on their total revenues as of 2024: Tier 1: >USD 1 billion, Tier 2: USD 500 million-1 billion, and Tier 3: USD 500 million.
To know about the assumptions considered for the study, download the pdf brochure
Market Size Estimation
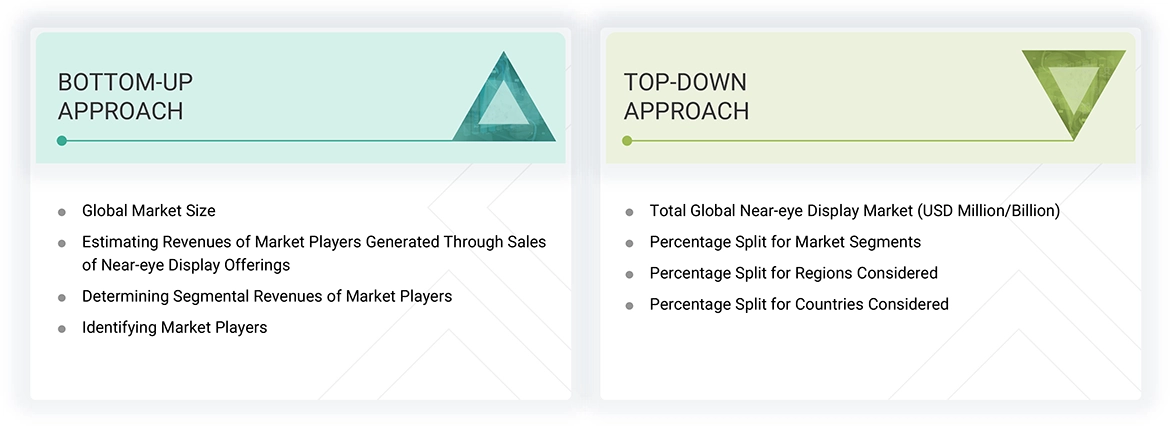
In the market engineering process, both top-down and bottom-up approaches, along with data triangulation methods, have been used to estimate and validate the size of the near-eye display market and other dependent submarkets. The research methodology used to estimate the market sizes includes the following:
- Identifying top-line investments and spending in the ecosystem and considering segment-level splits and major market developments
- Identifying different stakeholders in the near-eye display market that influence the entire market, along with participants across the supply chain
- Analyzing major manufacturers in the near-eye display market and studying their product portfolio
- Analyzing trends related to the adoption of near-eye display products
- Tracking recent and upcoming market developments, including investments, R&D activities, product launches, expansions, acquisitions, partnerships, collaborations, agreements, and investments, as well as forecasting the market size based on these developments and other critical parameters
- Carrying out multiple discussions with key opinion leaders to identify the adoption trends of near-eye displays
- Segmenting the overall market into various other market segments
- Validating the estimates at every level through discussions with key opinion leaders, such as chief executives (CXOs), directors, and operation managers, and finally with the domain experts at MarketsandMarkets
Near-Eye Display Market : Top-Down and Bottom-Up Approach
Data Triangulation
After arriving at the overall market size by the market size estimation process explained in the earlier section, the overall near-eye display market has been divided into several segments and subsegments. The data triangulation and market breakdown procedures have been used to complete the overall market engineering process and arrive at the exact statistics for all segments, wherever applicable. The data has been triangulated by studying various factors and trends from both the demand- and supply-side perspectives. Along with data triangulation and market breakdown, the market has been validated by top-down and bottom-up approaches.
Market Definition
Near-eye displays are advanced microdisplay technologies designed to be placed close to the user’s eyes, delivering immersive and vivid visual experiences in near-eye devices. Near-eye displays are used in augmented reality (AR) glasses, virtual reality (VR) head-mounted displays, mixed reality (MR) devices, and electronic viewfinders (EVFs). They provide high pixel density, low latency, lightweight, and the ability to project 2D or 3D content directly into the wearer's field of view, adding to interaction with digital environments.
The near-eye display market has been segmented by technology, device type, and vertical. Based on technology, the market has been segmented into OLED-on-Silicon (OLEDoS), Liquid Crystal on Silicon (LCoS), microLED, TFT LCD, AMOLED, and laser beam scanning, which present distinct advantages such as brightness, power efficiency, contrast, and resolution specific to certain applications. Displays based on these technologies are used in devices such as AR glasses, VR & MR HMDs, and electronic viewfinders (EVFs), and these devices are utilized in various verticals from consumer electronics to military, aerospace & defense, industrial & enterprise, retail & hospitality, medical, education, sports & entertainment, and more. Near-eye displays make it possible for immersive, high-resolution imagery and real-time interaction, so they play a critical role in uses such as training, simulation, remote guidance, gaming, and professional purposes in various industries.
Key Stakeholders
- Raw material suppliers
- Technology investors
- Original equipment manufacturers (OEMs)
- System integrators
- Distributors, resellers, and traders
- Research institutions and organizations
- Near-eye display forums, alliances, consortia, and associations
- Market research and consulting firms
- End users
Report Objectives
- To describe and forecast the overall near-eye display market, by technology, device type, resolution, and vertical, in terms of value
- To forecast the market for device type, in terms of volume
- To describe different components of near-eye displays, namely image generators, optical combiners, and imaging optics
- To describe the brightness levels of near-eye displays having less than 500 nits, 500 to 1,000 nits, and more than 1,000 nits
- To evaluate the market for four key regions: North America, Europe, Asia Pacific, and the Rest of the World, in terms of value
- To provide detailed information regarding the drivers, restraints, opportunities, and challenges influencing the growth of the market
- To give a detailed overview of the supply chain of the near-eye display ecosystem, along with the average selling prices of display technologies
- To strategically analyze the ecosystem, Porter's five forces, tariffs and regulations, patent landscape, trade landscape, trends and disruptions impacting customer business, technology landscape, key stakeholders & buying criteria, key conferences & events, and case studies pertaining to the market under study.
- To strategically analyze micromarkets with regard to individual growth trends, prospects, and contributions to the overall market
- To analyze opportunities in the market for stakeholders and provide a competitive landscape of the market
- To analyze competitive developments such as product launches, expansions, partnerships, collaborations, and agreements in the market
- To strategically profile the key players in the market and comprehensively analyze their market ranking and core competencies
- To strategically analyze the impact of the 2025 US tariff on the near-eye display market
- To analyze the impact of AI/Gen AI on the near-eye display market
Available Customizations:
With the given market data, MarketsandMarkets offers customizations according to the specific requirements of companies. The following customization options are available for the report:
Country-wise Information:
- Country-wise breakdown for North America, Europe, Asia Pacific, and Rest of the World
Company Information:
- Detailed analysis and profiling of additional market players (up to five)
Get the Full Near-Eye Display Market Report
Full forecast, segment splits, and company analysis for all Near-Eye Display Market.
- Canada Near-Eye Display Market
- Mexico Near-Eye Display Market
- Germany Near-Eye Display Market
- UK Near-Eye Display Market
- France Near-Eye Display Market
- Spain Near-Eye Display Market
- Italy Near-Eye Display Market
- Nordics Near-Eye Display Market
- Poland Near-Eye Display Market
- Rest Of Europe Near-Eye Display Market
- China Near-Eye Display Market
- Japan Near-Eye Display Market
- South Korea Near-Eye Display Market
- India Near-Eye Display Market
- Australia Near-Eye Display Market
- Indonesia Near-Eye Display Market
- Thailand Near-Eye Display Market
- Vietnam Near-Eye Display Market
- Malaysia Near-Eye Display Market
- Rest Of Asia Pacific Near-Eye Display Market
- Saudi Arabia Near-Eye Display Market
- UAE Near-Eye Display Market
- Qatar Near-Eye Display Market
- Kuwait Near-Eye Display Market
- Oman Near-Eye Display Market
- Bahrain Near-Eye Display Market
- Rest Of Middle East Near-Eye Display Market
- South Africa Near-Eye Display Market
- Rest Of African Countries Near-Eye Display Market
- South America Near-Eye Display Market
- Africa Near-Eye Display Market
- Middle East Near-Eye Display Market
Need a Tailored Report?
Customize this report to your needs
Get 10% FREE Customization
Customize This Report
