
Near-Eye Display Market Size, Share & Trends, 2025 To 2030

Near-Eye Display Market Size, Share, Growth & Trends by Augmented Reality (AR) Devices, Virtual Reality (VR) & Mixed Reality (MR) Devices, Electronic Viewfinders (EVFs), TFT LCD, AMOLED, LCOS, OLEDOS, MicroLED, Laser Beam Scanning and Region - Global Forecast to 2030


NEAR-EYE DISPLAY MARKET SIZE, SHARE & TRENDS
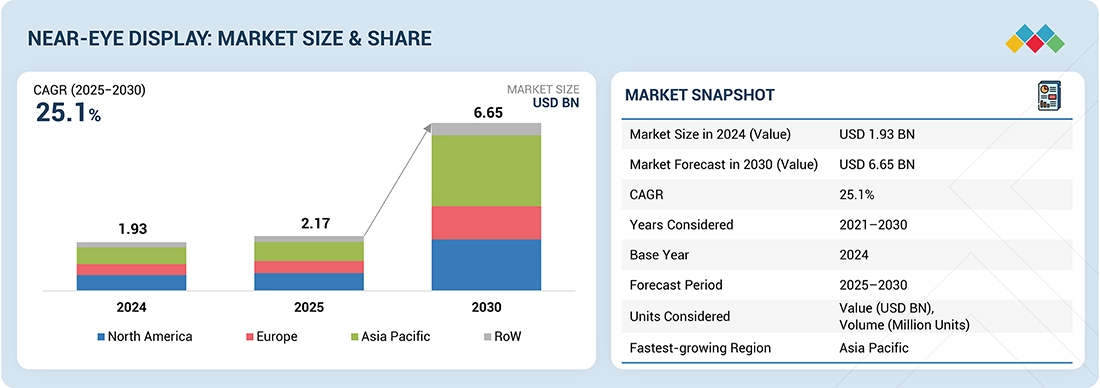
According to Marketsandmarkets, the global near-eye display market size was valued at USD 2.17 billion in 2025 and is projected to reach USD 6.65 billion in 2030, growing at a CAGR of 25.1% from 2025 to 2030. Increasing demand for immersive technologies to improve user experience, rapid advancements in OLEDoS technology, growing adoption of near-eye displays in healthcare and defense, advancements in microdisplay technology, and rising demand for advanced AR and VR are the main drivers of market expansion. Additionally, ongoing innovations and increased investments in developing advanced displays create significant opportunities for market players.
MARKET SNAPSHOT TABLE
| REPORT METRIC | DETAILS |
|---|---|
| Market Size in 2025 (Value) | USD 2.17 Billion |
| Market Forecast in 2030 (Value) | USD 6.65 Billion |
| Growth Rate | CAGR of 25.1% from 2025-2030 |
| Years Considered | 2021-2030 |
| Base Year | 2024 |
| Forecast Period | 2025-2030 |
| Units Considered | Value (USD Million/Billion), Volume (Million Units) |
| Report Coverage | Revenue forecast, company ranking, competitive landscape, growth factors, and trends |
| Top Companies |
|
| Growth Drivers |
|
| Segments Covered |
|
| Regional Scope | North America, Europe, Asia Pacific, Rest of the World |
Market Size & Forecast
• 2025 Market Size: USD 2.17 billion
• 2030 Projected Market Size: USD 6.65 billion
• CAGR (2025-2030): 25.1%
• Consumer segment: Holds the largest share
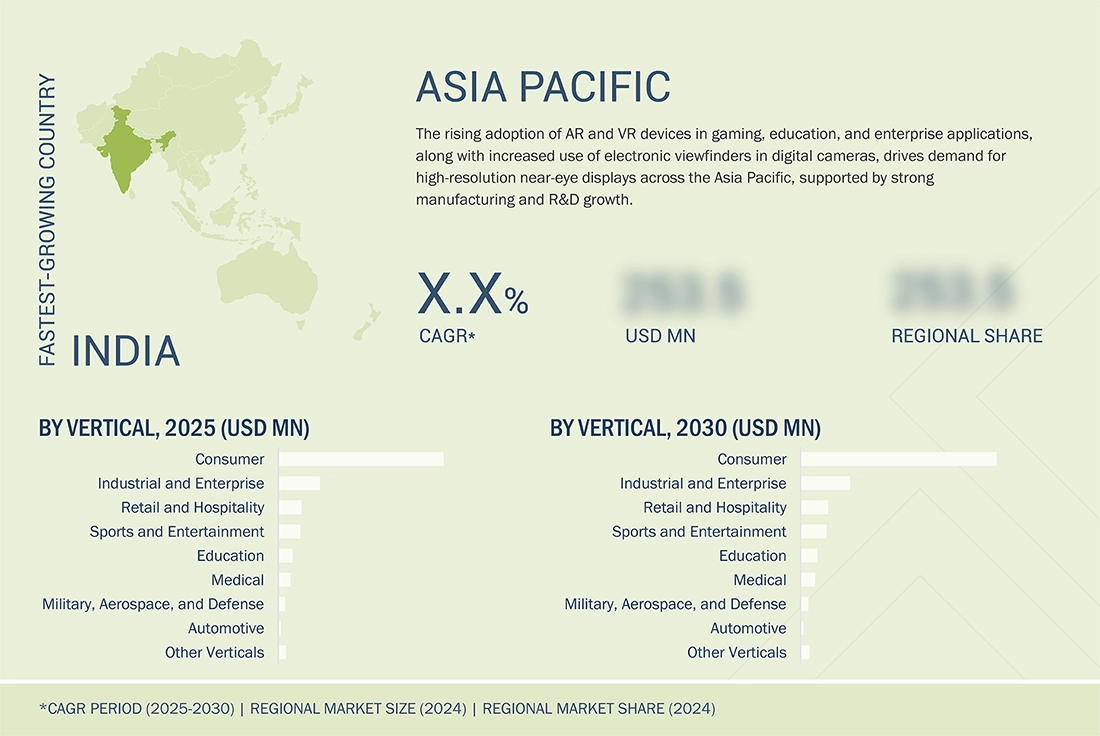
• Asia Pacific: Fastest-growing region
KEY TAKEAWAYS
-
BY TECHNOLOGYThe market is divided into TFT LCD, AMOLED, LCOS, OLEDoS, MicroLED, and Laser Beam Scanning. OLEDoS holds the largest share in 2024, thanks to its excellent pixel density, high contrast ratio, and compact design ideal for AR and VR headsets. The increasing use of OLEDoS microdisplays in next-generation mixed reality devices and premium consumer electronics is driving its leadership.
-
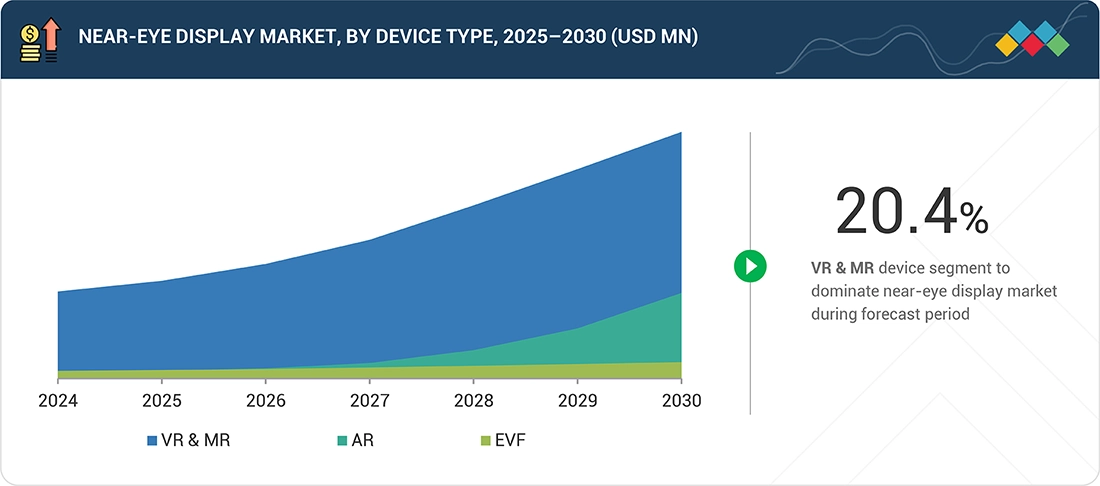
BY DEVICE TYPEThe market is divided into AR, VR & MR, and EVFs. VR & MR devices hold the largest share in 2024, due to their widespread use in gaming, entertainment, and enterprise simulation. Increasing adoption of immersive visualization tools for training, design, and remote collaboration is driving up demand for VR and MR headsets.
-
BY RESOLUTIONThe market is segmented into lower-than-HD, HD, FHD, and higher-than-FHD. HD resolution will dominate the market in 2024, as it offers a balanced trade-off between display performance, cost, and power efficiency. Manufacturers are increasingly integrating HD panels into near-eye devices to ensure visual clarity while maintaining lightweight form factors and longer battery life.
-
BY VERTICALThe market is segmented into consumer, automotive, military, aerospace & defense, industrial & enterprise, retail & hospitality, medical, education, sports & entertainment, and other verticals. The consumer segment holds the largest share in 2024, driven by the surging adoption of AR and VR headsets for gaming, streaming, and interactive experiences. Rising consumer spending on immersive technologies and advancements in wearable displays are accelerating market growth in this segment.
-
BY REGIONThe market is segmented into North America, Europe, Asia Pacific, and Rest of the World. Asia Pacific led the market in 2024, attributed to strong electronics manufacturing ecosystems in China, Japan, and South Korea, coupled with increasing investments in AR/VR technologies. Expanding local production of OLED and microLED components and high consumer demand for advanced display devices are key regional growth drivers.
-
COMPETITIVE LANDSCAPEKey players include Sony Group Corporation (Japan), Seiko Epson Corporation (Japan), BOE Technology Group Co., Ltd. (China), SeeYA Technology (China), and eMagin Corporation (US). These companies focus on developing high-resolution microdisplays, advanced OLED and microLED technologies, and compact form factors for AR, VR, and MR devices. Strategic collaborations with AR/VR headset manufacturers and continuous innovation in OLEDoS and MicroLED architectures strengthen their market presence and technological leadership.
The near-eye display industry is expected to grow significantly in the upcoming years, driven by the rising adoption of AR, VR, and MR devices in consumer, business, and defense sectors. The need for compact, high-resolution, and energy-efficient microdisplays is increasing as manufacturers incorporate advanced technologies like OLEDoS and MicroLED. Increased investments in metaverse platforms, immersive gaming, and industrial training are also boosting market growth. With its capacity to provide realistic visual experiences, improve spatial awareness, and support next-generation wearable devices, near-eye display technology is becoming a vital part of the growing extended reality (XR) ecosystem worldwide.
Source: Secondary Research, Interviews with Experts, MarketsandMarkets Analysis
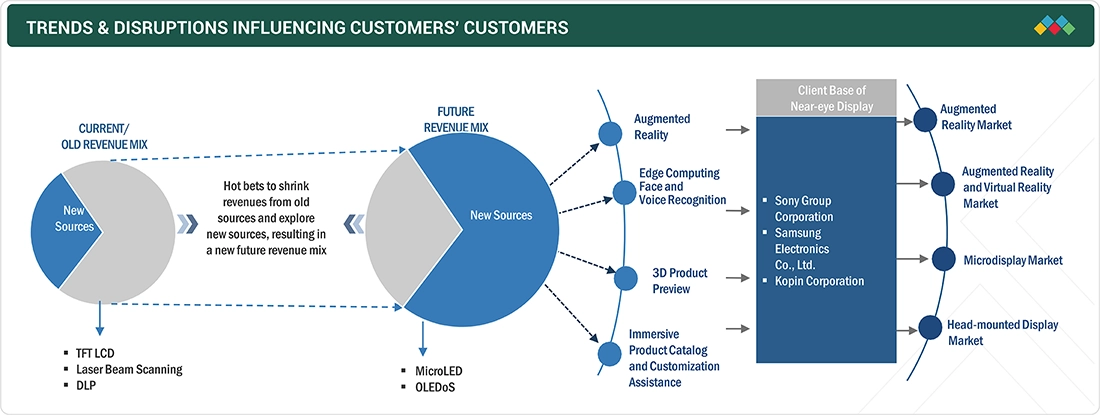
TRENDS & DISRUPTIONS IMPACTING CUSTOMERS' CUSTOMERS
The emergence of the metaverse is reshaping the near-eye display market size, shifting demand from traditional technologies such as TFT-LCD, laser beam scanning, and DLP toward advanced solutions like MicroLED and OLEDoS (OLED-on-Silicon). This transition reflects an industry-wide shift toward more compact, energy-efficient, and immersive display technologies optimized for augmented and virtual reality environments. Companies focusing on enhancing user experience are accelerating innovations in AR interfaces, facial and voice interaction, and 3D visualization. Leading players such as Sony Group Corporation (Japan), Samsung Electronics (South Korea), and Kopin Corporation (US) are investing heavily to capture emerging opportunities across the AR/VR, microdisplay, and head-mounted display segments. As this technological disruption unfolds, it is compelling industry participants to make agile decisions and capitalize on new revenue streams driven by next-generation immersive ecosystems.
Source: Secondary Research, Interviews with Experts, MarketsandMarkets Analysis
NEAR-EYE DISPLAY MARKET DYNAMICS
Level
-
Rising demand for AR and VR devices

-
Growing adoption of OLEDoS in AR/VR devices

Level
-
Limited content ecosystem

-
Health issues associated with excessive use of AR and VR devices

Level
-
Growing focus of market players on filing patents and spending more on R&D activities

-
Increasing investments by technology giants in development of innovative near-eye display products

Level
-
Developing power-efficient near-eye displays with high resolution and brightness

-
Mass production and yield issues

Source: Secondary Research, Interviews with Experts, MarketsandMarkets Analysis
Driver: Rising demand for AR and VR devices
The adoption of AR and VR is boosting demand for near-eye displays that offer highly immersive experiences across various industries. Technologies like OLEDoS and LCOS support high-resolution, low-latency visuals, improving gaming, entertainment, industrial training, healthcare, and education. Smart glasses enhance worker safety and productivity, while XR tools make learning more engaging. As hardware gets lighter and provides higher resolutions, near-eye displays are key to delivering convenient, immersive digital experiences in both consumer and business markets.
Restraint: Limited content ecosystem
Market growth is limited by the lack of compelling XR content for AR and VR devices. Although hardware technologies like OLED-on-Silicon and LCOS have advanced quickly, content development lags behind, restricting user engagement. This gap is particularly noticeable in education, corporate training, and healthcare, where customized experiences are essential. Creating content is time-consuming, expensive, and technically difficult, and the absence of standard platforms further slows adoption, hindering the long-term growth of near-eye display technologies.
Opportunity: Increasing investments by technology giants in development of innovative near-eye display products
The near-eye display market growth is set for substantial growth as leading tech companies heavily invest in next-generation display products to support the increasing adoption of AR and VR devices. Firms like Meta, Apple, and Microsoft are improving device capabilities, boosting demand for high-performance microdisplays. Panel makers such as Sony and Samsung are advancing OLED and MicroLED technologies to enhance resolution, brightness, power efficiency, and color accuracy, enabling immersive experiences in gaming, healthcare, and enterprise use. Strategic acquisitions, like Samsung’s purchase of Magion, further boost innovation and expand supply chains, supporting rapid development cycles and wider hardware adoption across consumer and industrial markets.
Challenge: Technical and usability challenges associated with HMDs
Despite rapid innovation, the near-eye display market growth faces technical and usability challenges that limit broader adoption of head-mounted displays (HMDs) in AR and VR. Balancing high performance with comfort remains difficult, as users demand wide fields of view, high-resolution imagery, and lightweight designs. Battery efficiency, consistent image quality, and thermal management are ongoing concerns. Manufacturers face low production yields, voltage variation issues on silicon substrates, and high R&D costs, making the mass production of high-performance microdisplays technically complex and resource-intensive.
Near-Eye Display Market Trends: COMMERCIAL USE CASES ACROSS INDUSTRIES
| COMPANY | USE CASE DESCRIPTION | BENEFITS |
|---|---|---|
 |
Incorporates OLED microdisplay panels in electronic viewfinders (EVFs) of digital cameras, enabling high brightness, contrast, and color accuracy for precise image framing | Delivers sharp visuals, fast response times, and improved user experience for professional photography and videography. |
 |
Utilizes high-resolution micro-OLED panels in Vision Pro headsets to enable lifelike AR and VR visuals for spatial computing and immersive content interaction | Provides superior image clarity, wide color gamut, and enhanced visual realism, improving comfort and immersion |
 |
Uses Si-OLED display panels in Moverio smart glasses to project transparent, high-brightness AR visuals for industrial and enterprise operations | Ensures clear image projection, energy efficiency, and stable performance in varying light environments |
 |
Integrates micro-OLED panels in HoloLens headsets to deliver high-definition mixed-reality overlays and precise holographic visualization for enterprise use | Enables accurate 3D visualization, minimizes motion blur, and enhances user engagement during extended operation |
 |
Employs OLED panels in Vive VR headsets to achieve high refresh rates and wide field-of-view visuals for immersive VR environments | Offers low latency, smooth motion rendering, and deeper visual immersion for gaming and simulation applications |
Logos and trademarks shown above are the property of their respective owners. Their use here is for informational and illustrative purposes only.
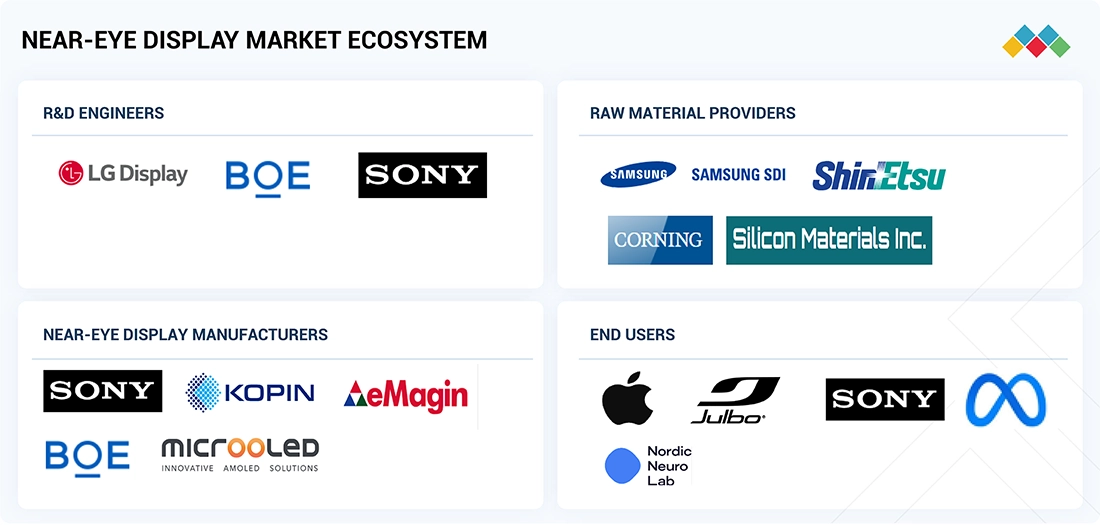
NEAR-EYE DISPLAY MARKET ECOSYSTEM
Major companies in the near-eye display market share with a strong global presence include Sony Group Corporation (Japan), Seiko Epson Corporation (Japan), BOE Technology Group Co., Ltd. (China), SeeYA Technology (China), eMagin (US), Kopin Corporation (US), Himax Technologies (Taiwan), MICROOLED Technologies (France), HOLOEYE Photonics AG (Germany), and Yunnan OLiGHTEK Opto-Electronic Technology Co., Ltd. (China). The near-eye display ecosystem consists of R&D engineers, raw material providers, near-eye display manufacturers, and end users.
Logos and trademarks shown above are the property of their respective owners. Their use here is for informational and illustrative purposes only.
NEAR-EYE DISPLAY MARKET GROWTH SEGMENTS
Source: Secondary Research, Interviews with Experts, MarketsandMarkets Analysis
Near-Eye Display Market Growth, By Technology
The OLEDoS segment held the largest market share in 2024, thanks to its superior pixel density, high contrast, and compact design suitable for AR, VR, and MR devices. These displays deliver low-latency, high-resolution visuals that are essential for immersive experiences in gaming, industrial training, healthcare, and education. The adoption of MicroLED and LCOS technologies is also increasing, driven by the rising demand for brighter, energy-efficient, and lightweight displays. Hardware advances are complemented by improvements in optical modules, sensor integration, and software compatibility, which enhance usability, interactivity, and overall user satisfaction across different applications.
Near-eye Display Market, By Device Type
The VR & MR segment captured the largest share in 2024, driven by growing adoption of immersive headsets across gaming, corporate training, industrial simulation, and virtual collaboration. These devices depend on advanced near-eye displays to provide realistic visuals and smooth interaction. AR devices are gaining popularity, especially in field operations, healthcare, and education, offering contextual information and real-time support. Ongoing enhancements in ergonomics, display resolution, and reduced latency are boosting adoption, while headset manufacturers are integrating software platforms for spatial mapping, content management, and interactive experiences across various industries.
Near-eye Display Market, By Resolution
The HD segment led the market in 2024, providing an ideal mix of visual clarity, power efficiency, affordability, and device weight. HD resolution panels are commonly used in both consumer and enterprise applications, from gaming and entertainment to industrial training, remote assistance, and educational simulations. Demand for higher resolutions like FHD and above is rising in premium VR headsets, smart glasses, and enterprise-grade devices. Advances in pixel density, refresh rates, optics, and color accuracy are creating more immersive and realistic visual experiences while ensuring comfort and long-lasting usability for different user groups and applications.
Near-eye Display Market, By Vertical
The consumer segment held the largest share in 2024, driven by widespread use of AR/VR headsets for gaming, streaming, immersive entertainment, and social experiences. Growing consumer interest in wearable displays, along with increased investments in the metaverse and interactive content, supports the deployment of high-performance near-eye displays. The industrial, healthcare, and educational sectors are also expanding their use of AR/VR for workforce training, remote assistance, and interactive learning. Manufacturers are improving display technologies, ergonomics, device integration, and software compatibility to meet the specific needs of different industries, enhancing usability, engagement, and long-term adoption.
NEAR-EYE DISPLAY MARKET REGION
Asia Pacific to be fastest-growing region in global near-eye display market trends during forecast period
Asia Pacific is projected to become the fastest-growing region in the near-eye display market trends . The rising adoption of AR, VR, and MR devices across China, Japan, South Korea, and India is fueling strong demand for high-performance microdisplays and advanced wearable technology. Government initiatives supporting smart manufacturing, digital education, and immersive training programs are speeding up adoption. China’s electronics manufacturing ecosystem, South Korea’s gaming and entertainment industries, Japan’s emphasis on consumer electronics, and India’s expanding enterprise XR deployments are further boosting regional growth. Strategic collaborations among device manufacturers, display technology providers, and content creators are enhancing Asia Pacific’s leadership in the near-eye display market growth.
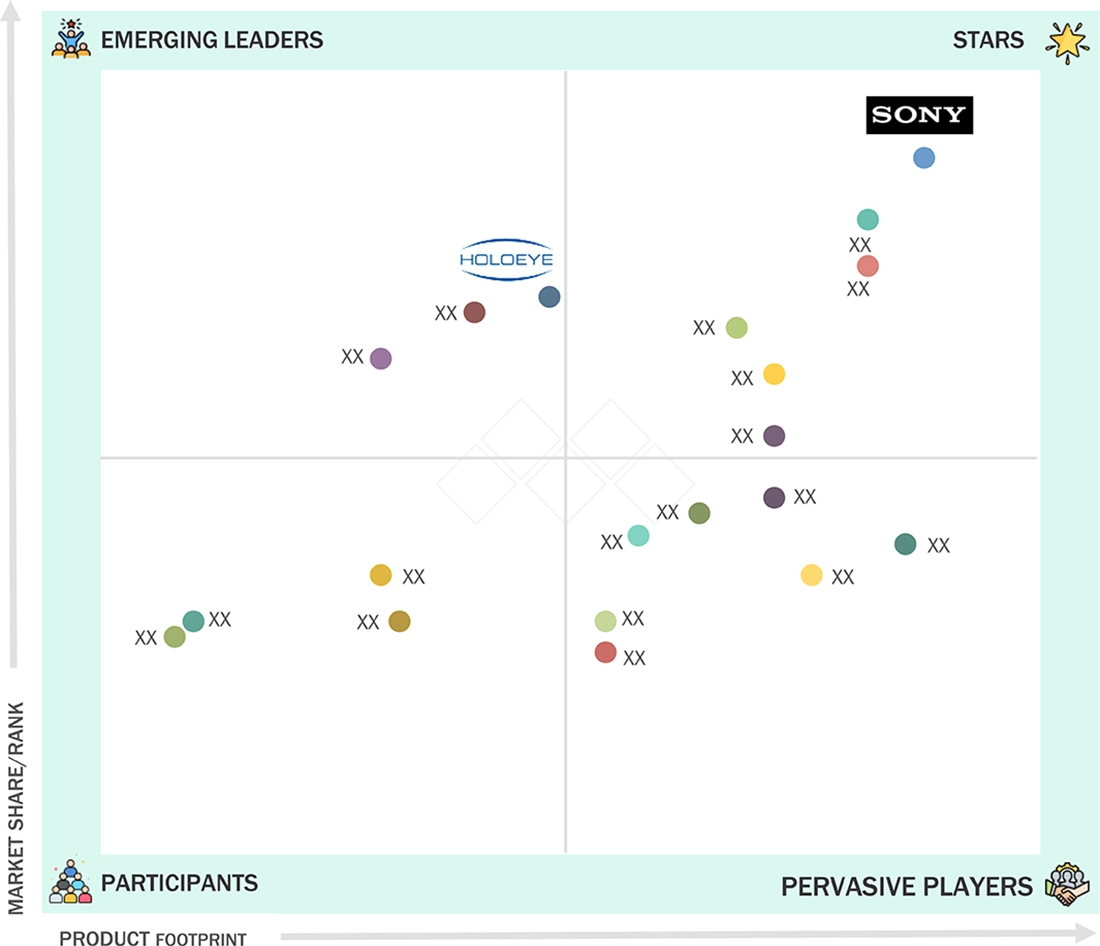
Near-Eye Display Market: COMPANY EVALUATION MATRIX
In the near-eye display market landscape, Sony Group Corporation (Star) leads with its strong market presence, offering high-performance microdisplays, OLED, and MicroLED technologies. Sony’s end-to-end ecosystem, combined with its global reach and strategic partnerships with AR/VR device manufacturers, positions it as a dominant force driving widespread adoption of near-eye display technologies. HOLOEYE Photonics AG (Emerging Leader) is quickly gaining traction with its advanced LCOS and spatial light modulator solutions for AR, VR, and industrial applications. While Sony dominates through hardware excellence and industry connections, HOLOEYE demonstrates strong potential to move into the leaders’ quadrant by scaling its photonics innovations and expanding adoption across consumer, enterprise, and industrial XR segments.
Source: Secondary Research, Interviews with Experts, MarketsandMarkets Analysis
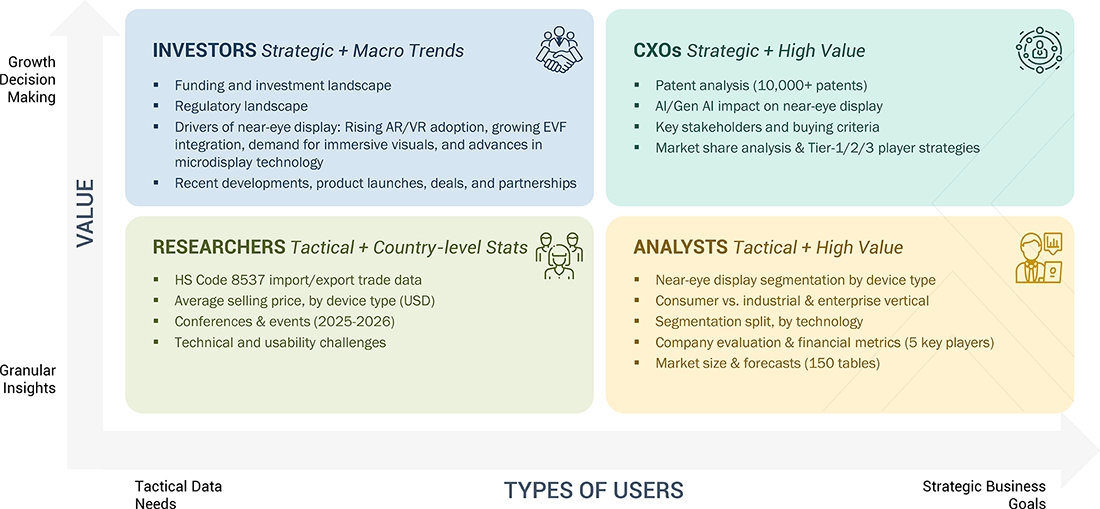
WHAT IS IN IT FOR YOU: Near-Eye Display Market REPORT CONTENT GUIDE
DELIVERED CUSTOMIZATIONS
We have successfully delivered the following deep-dive customizations:
| CLIENT REQUEST | CUSTOMIZATION DELIVERED | VALUE ADDS |
|---|---|---|
| AR/VR Headset Manufacturers |
|
|
| Enterprise Training Solutions Providers |
|
|
| Display Component Suppliers |
|
|
| AR/VR Software & Content Developers |
|
|
| Investors & Venture Capital Firms |
|
|
RECENT DEVELOPMENTS
- September 2024 : Sony Semiconductor Solutions Corporation launched the ECX350F, a 0.44-type Full HD OLED Microdisplay featuring pixels measuring 5.1 µm and up to 10,000 cd/m² of peak brightness. The display is designed for AR glasses and introduces a new OLED structure and microlenses for increased miniaturization and brightness.
- June 2023 : Kopin Corporation launched its 2K x 2K ultra-bright monochrome MicroLED display. Kopin's 1-inch diagonal 2K x 2K MicroLED display (2048 x 2048 resolution) was developed to meet the high-performance requirements of defense and AR applications.
- May 2023 : eMagin released an advanced version of its WUXGA (1920x1200 pixels) microdisplay, featuring 15,000 cd/m² full-color brightness and employing its direct patterning display (dPd) technology. This surpassed its 2021 performance of 10,000 cd/m². The new high-brightness, high-contrast, high-resolution OLED-on-Silicon microdisplay supports consumer, industrial, medical, and military applications.
Table of Contents
 Exclusive indicates content/data unique to MarketsandMarkets and not available with any competitors.
Methodology
The research study involved four major activities in estimating the size of the near-eye display market. Exhaustive secondary research has been done to collect important information about the market and peer markets. The next step has been to validate these findings, assumptions, and sizing with the help of primary research with industry experts across the value chain. Both top-down and bottom-up approaches have been used to estimate the market size. The market breakdown and data triangulation techniques have been adopted to estimate the market sizes of segments and subsegments
Secondary Research
In the secondary research process, various secondary sources have been referred to for identifying and collecting information required for this study. The secondary sources include annual reports, press releases, investor presentations of companies, white papers, and articles from recognized authors. Secondary research has been done to obtain key information about the market’s value chain, the pool of key market players, market segmentation according to industry trends, regional outlook, and developments from both market and technology perspectives.
The near-eye display market report estimates the global market size using both top-down and bottom-up approaches and several other dependent submarkets. The major players in the market have been identified using extensive secondary research, and their presence in the market has been determined using secondary and primary research. All the percentage share splits and breakdowns have been determined using secondary sources and verified through primary sources.
Primary Research
Extensive primary research has been conducted after understanding the near-eye display market scenario through secondary research. Several primary interviews have been conducted with key opinion leaders from both demand- and supply-side vendors across four major regions—North America, Europe, Asia Pacific, and Rest of the World (RoW). Approximately 25% of the primary interviews have been conducted with the demand-side vendors and 75% with the supply-side vendors. Primary data has been collected mainly through telephonic interviews, which consist of 80% of the total primary interviews; questionnaires and emails have also been used to collect the data.
After successfully interacting with industry experts, brief sessions have been conducted with highly experienced independent consultants to reinforce our primary research findings. This, along with the opinions of the in-house subject-matter experts, has led us to the findings described in the report.

Note: Other designations include sales, marketing, and product managers.
The three tiers of the companies are based on their total revenues as of 2024: Tier 1: >USD 1 billion, Tier 2: USD 500 million-1 billion, and Tier 3: USD 500 million.
To know about the assumptions considered for the study, download the pdf brochure
Market Size Estimation
In the market engineering process, both top-down and bottom-up approaches, along with data triangulation methods, have been used to estimate and validate the size of the near-eye display market and other dependent submarkets. The research methodology used to estimate the market sizes includes the following:
- Identifying top-line investments and spending in the ecosystem and considering segment-level splits and major market developments
- Identifying different stakeholders in the near-eye display market that influence the entire market, along with participants across the supply chain
- Analyzing major manufacturers in the near-eye display market and studying their product portfolio
- Analyzing trends related to the adoption of near-eye display products
- Tracking recent and upcoming market developments, including investments, R&D activities, product launches, expansions, acquisitions, partnerships, collaborations, agreements, and investments, as well as forecasting the market size based on these developments and other critical parameters
- Carrying out multiple discussions with key opinion leaders to identify the adoption trends of near-eye displays
- Segmenting the overall market into various other market segments
- Validating the estimates at every level through discussions with key opinion leaders, such as chief executives (CXOs), directors, and operation managers, and finally with the domain experts at MarketsandMarkets
Near-Eye Display Market : Top-Down and Bottom-Up Approach

Data Triangulation
After arriving at the overall market size by the market size estimation process explained in the earlier section, the overall near-eye display market has been divided into several segments and subsegments. The data triangulation and market breakdown procedures have been used to complete the overall market engineering process and arrive at the exact statistics for all segments, wherever applicable. The data has been triangulated by studying various factors and trends from both the demand- and supply-side perspectives. Along with data triangulation and market breakdown, the market has been validated by top-down and bottom-up approaches.
Market Definition
Near-eye displays are advanced microdisplay technologies designed to be placed close to the user’s eyes, delivering immersive and vivid visual experiences in near-eye devices. Near-eye displays are used in augmented reality (AR) glasses, virtual reality (VR) head-mounted displays, mixed reality (MR) devices, and electronic viewfinders (EVFs). They provide high pixel density, low latency, lightweight, and the ability to project 2D or 3D content directly into the wearer's field of view, adding to interaction with digital environments.
The near-eye display market has been segmented by technology, device type, and vertical. Based on technology, the market has been segmented into OLED-on-Silicon (OLEDoS), Liquid Crystal on Silicon (LCoS), microLED, TFT LCD, AMOLED, and laser beam scanning, which present distinct advantages such as brightness, power efficiency, contrast, and resolution specific to certain applications. Displays based on these technologies are used in devices such as AR glasses, VR & MR HMDs, and electronic viewfinders (EVFs), and these devices are utilized in various verticals from consumer electronics to military, aerospace & defense, industrial & enterprise, retail & hospitality, medical, education, sports & entertainment, and more. Near-eye displays make it possible for immersive, high-resolution imagery and real-time interaction, so they play a critical role in uses such as training, simulation, remote guidance, gaming, and professional purposes in various industries.
Key Stakeholders
- Raw material suppliers
- Technology investors
- Original equipment manufacturers (OEMs)
- System integrators
- Distributors, resellers, and traders
- Research institutions and organizations
- Near-eye display forums, alliances, consortia, and associations
- Market research and consulting firms
- End users
Report Objectives
- To describe and forecast the overall near-eye display market, by technology, device type, resolution, and vertical, in terms of value
- To forecast the market for device type, in terms of volume
- To describe different components of near-eye displays, namely image generators, optical combiners, and imaging optics
- To describe the brightness levels of near-eye displays having less than 500 nits, 500 to 1,000 nits, and more than 1,000 nits
- To evaluate the market for four key regions: North America, Europe, Asia Pacific, and the Rest of the World, in terms of value
- To provide detailed information regarding the drivers, restraints, opportunities, and challenges influencing the growth of the market
- To give a detailed overview of the supply chain of the near-eye display ecosystem, along with the average selling prices of display technologies
- To strategically analyze the ecosystem, Porter's five forces, tariffs and regulations, patent landscape, trade landscape, trends and disruptions impacting customer business, technology landscape, key stakeholders & buying criteria, key conferences & events, and case studies pertaining to the market under study.
- To strategically analyze micromarkets with regard to individual growth trends, prospects, and contributions to the overall market
- To analyze opportunities in the market for stakeholders and provide a competitive landscape of the market
- To analyze competitive developments such as product launches, expansions, partnerships, collaborations, and agreements in the market
- To strategically profile the key players in the market and comprehensively analyze their market ranking and core competencies
- To strategically analyze the impact of the 2025 US tariff on the near-eye display market
- To analyze the impact of AI/Gen AI on the near-eye display market
Available Customizations:
With the given market data, MarketsandMarkets offers customizations according to the specific requirements of companies. The following customization options are available for the report:
Country-wise Information:
- Country-wise breakdown for North America, Europe, Asia Pacific, and Rest of the World
Company Information:
- Detailed analysis and profiling of additional market players (up to five)
Key Questions Addressed by the Report
What is the current market size of the global Near-Eye Display market?
The global Near-Eye Display market was valued at USD 1.93 billion in 2024. Growing adoption of AR, VR, and MR devices, along with advancements in microdisplay technologies, is driving market expansion. (MarketsandMarkets)
What is the forecasted size of the Near-Eye Display market by 2030?
The Near-Eye Display market is projected to grow from USD 2.17 billion in 2025 to USD 6.65 billion by 2030. (MarketsandMarkets)
What is the expected CAGR of the Near-Eye Display market during 2025–2030?
The global Near-Eye Display market is expected to grow at a CAGR of 25.1% from 2025 to 2030, driven by increasing demand for immersive AR/VR experiences and advanced wearable display solutions. (MarketsandMarkets)
What are the major growth drivers for the Near-Eye Display industry?
Key growth drivers include rising adoption of AR, VR, and MR devices, advancements in OLEDoS and MicroLED technologies, increasing use in healthcare and defense, demand for immersive gaming, and investments in extended reality (XR) technologies. (MarketsandMarkets)
What are the key trends shaping the Near-Eye Display market?
Major trends include development of high-resolution microdisplays, lightweight wearable displays, OLED-on-Silicon (OLEDoS) technology, MicroLED displays, AI-enabled immersive experiences, and compact AR glasses. (MarketsandMarkets)
Which companies are the leading players in the Near-Eye Display market?
Major companies operating in the Near-Eye Display market include Sony Group Corporation, Seiko Epson Corporation, BOE Technology Group Co., Ltd., SeeYA Technology, eMagin Corporation, Kopin Corporation, and Himax Technologies, Inc. (MarketsandMarkets)
Which industries are driving demand for Near-Eye Display solutions?
Major industries adopting near-eye displays include consumer electronics, automotive, healthcare, military & defense, aerospace, industrial & enterprise, education, retail, hospitality, sports, and entertainment sectors. (MarketsandMarkets)
Which technology segment is expected to dominate the Near-Eye Display market?
OLED-on-Silicon (OLEDoS) technology is expected to hold a leading position due to its high pixel density, excellent contrast ratio, compact design, and suitability for AR and VR headsets. (MarketsandMarkets)
Which device type segment dominates the Near-Eye Display market?
VR and MR devices hold a significant market share due to increasing adoption in gaming, entertainment, enterprise training, simulation, remote collaboration, and immersive visualization applications. (MarketsandMarkets)
Which region is expected to lead the Near-Eye Display market?
Asia Pacific is expected to hold the largest market share and register strong growth during the forecast period due to the presence of major display manufacturers, strong electronics ecosystems in China, Japan, and South Korea, and increasing investments in AR/VR technologies. (MarketsandMarkets)
Need a Tailored Report?
Customize this report to your needs
Get 10% FREE Customization
Customize This ReportPersonalize This Research
- Triangulate with your Own Data
- Get Data as per your Format and Definition
- Gain a Deeper Dive on a Specific Application, Geography, Customer or Competitor
- Any level of Personalization
Let Us Help You
- What are the Known and Unknown Adjacencies Impacting the Near-Eye Display Market
- What will your New Revenue Sources be?
- Who will be your Top Customer; what will make them switch?
- Defend your Market Share or Win Competitors
- Get a Scorecard for Target Partners

Custom Market Research Services
We Will Customise The Research For You, In Case The Report Listed Above Does Not Meet With Your Requirements
Get 10% Free CustomisationTESTIMONIALS

Tetsuya Ohhira
Business Development Manager-Technology Business
Nikon Corporation,
Leading Japanese MNC specializing in optics and imaging productswww.nikon.com
MarketsandMarkets™ response
is quick. Their attitude is flexible and positive. Analyst Insights are globally considered and
significant. Client Services quickly respond to our inquiry and demand. Their wide range of global
surveys help us make our strategic plan.
We hope Knowledge Store will be easier to search
for a report.
VP - Marketing & Business Development
Leading Provider of Process Control Solutions
We engaged with MarketsandMarkets on a study to perform an analysis and recommend a Go-To-Market strategy for metrology and process control in the semiconductor market. The study was tailored to our targets and needs with well-defined milestones. Our overall experience with the MarketsandMarkets team was very good throughout the project in all aspects including the analysis methodologies used, the quality and depth of primary and secondary data sets, the professionalism and flexibility of the team and the ability to meet the target schedule and milestones. We want to thank MarketsandMarkets team for a job well done.
Growth opportunities and latent adjacency in Near-Eye Display Market


Arthur
Apr, 2026
Are the market trends and adoption rates segmented by industry verticals like AR, VR, healthcare, and military?.
Chad
Apr, 2026
The regional market analysis provides clarity on emerging markets and investment opportunities..