
North America Occupancy Sensor Market (2024-2029)

The North America Occupancy Sensor Market was valued at $1051.4 Million in 2024 and projected to reach to $1992.2 Million by 2029, representing a compound annual growth rate of 11.2%. North America's occupancy sensor market is poised for sustained expansion through 2029, driven by accelerating digital transformation in commercial real estate and residential smart home adoption.


| Market Size in | USD 26.32 MN |
| Market Forecast in | |
| CAGR | |
| Forecast Period | |
| Units Considered | Value (USD MN) |
North America Occupancy Sensor Market Trends and Insights
- This 11.2% compound annual growth rate reflects North America's strong adoption of smart building technologies and energy-efficient solutions across commercial and residential sectors.
- North America leads in technological innovation and regulatory support for occupancy-based automation, driving widespread deployment in office buildings, retail spaces, and hospitality venues. The North America occupancy sensor market benefits from increasing demand for IoT-enabled facilities management and sustainability initiatives.
- North America's mature infrastructure and high capital investment in building automation systems position the region as a key growth engine.
- Between 2024 and 2029, North America will see accelerated integration of occupancy sensors with HVAC systems, lighting controls, and security applications, supported by favorable energy codes and corporate sustainability commitments..
Key Market Statistics
- CAGR (2024-2029) 11.2% CAGR
- Market Size, 2024 ~USD 1051.4 Million
- Forecast, 2029 ~USD 1992.2 Million
- Geography North America
North America Occupancy Sensor Market Overview
Market Valuation & Growth :
North America's occupancy sensor market reached $1,051.4 million in 2024 and is projected to grow to $1,992.2 million by 2029, representing an 11.2% CAGR. This growth trajectory reflects strong regional demand for intelligent building automation solutions.
Smart Building Adoption :
North America leads in smart building technology adoption, driven by stringent energy efficiency regulations, sustainability mandates, and increasing corporate focus on reducing operational costs. Commercial real estate and office spaces are primary growth drivers.
Technological Innovation Hub :
The region serves as a global innovation center for occupancy sensor technologies, with major manufacturers and tech companies headquartered in the US and Canada. Advanced IoT integration and AI-powered analytics are accelerating market expansion.
Regulatory & Sustainability Drivers :
Stringent building codes, LEED certification requirements, and net-zero energy initiatives across North America are compelling building owners and facility managers to invest in occupancy-based lighting and HVAC control systems.
North America Occupancy Sensor Market Dynamics
- The region's mature infrastructure, coupled with increasing energy costs and environmental consciousness, creates favorable conditions for sensor deployment across office buildings, retail spaces, and hospitality venues.
- Government incentives for energy efficiency retrofits and the growing prevalence of integrated building management systems further support market growth.
- The US dominates the regional market, while Canada and Mexico present emerging opportunities as smart building awareness increases..
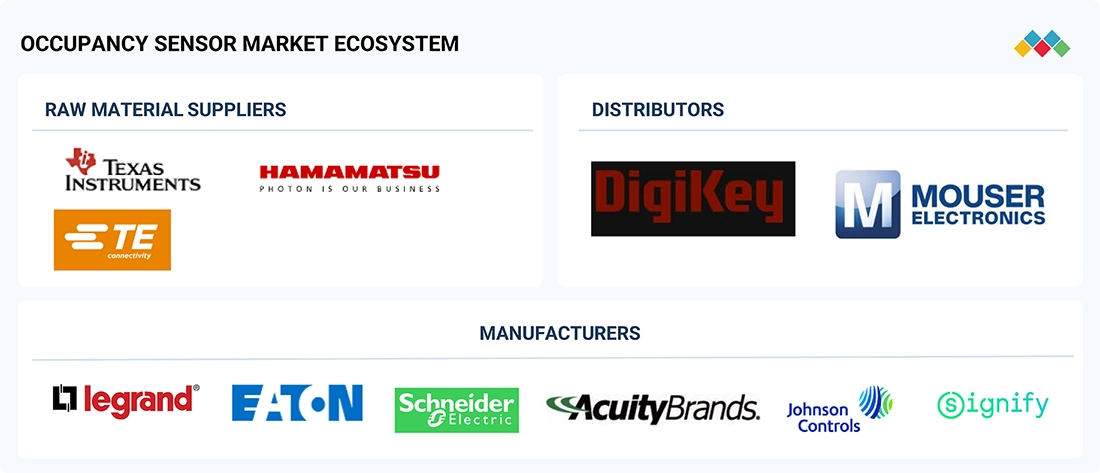
Market Ecosystem
OCCUPANCY SENSOR MARKET SIZE, SHARE & ANALYSIS: COMMERCIAL USE CASES ACROSS INDUSTRIES
| COMPANY | USE CASE DESCRIPTION | BENEFITS |
|---|---|---|
 |
Deployment of PIR, ultrasonic, and dual-technology occupancy sensors in commercial buildings, office spaces, and educational institutions. | Enhances energy efficiency by automating lighting and HVAC, reduces operational costs, and improves overall building comfort. |
 |
Integration of smart occupancy sensors with building management systems (BMS) for real-time monitoring of space usage and automated environmental control | Improves space optimization, increases energy savings, and enables intelligent facility management through data-driven insights. |
 |
Use of wired and wireless occupancy sensors in industrial facilities and commercial lighting systems for automated control and safety compliance. | Reduces energy waste in large facilities, enhances worker safety, and supports compliance with energy and building codes |
 |
Advanced occupancy and presence sensors integrated into HVAC, security, and smart building platforms for industrial, commercial, and healthcare environments | Increases operational efficiency, enables predictive building control, and enhances comfort with precise occupancy-based adjustments. |
 |
Deployment of networked lighting control sensors and ceiling-mounted occupancy detectors in retail, office, and residential applications. | Delivers high energy savings, supports smart lighting ecosystems, and enhances user experience with seamless automation. |
Logos and trademarks shown above are the property of their respective owners. Their use here is for informational and illustrative purposes only.
Related Ecosystem
Sensors And Control
- Sensors
- Image Sensors
- Temperature Sensors
- Pressure Sensors
- Flow Sensors
- BAUMER ELECTRIC AG
- HONEYWELL INTERNATIONAL INC.
- Stmicroelectronics
- Lenovo
- Texas Instruments Incorporated
Digitalization And Iot
- Sensors
- Remote Monitoring
- Supply Chain Management
- Passenger Information System (PIS)
- Platform as A Service (PaaS)
- International Business Machines Corporation
- Cisco Systems, Inc.
- MICROSOFT CORPORATION
- Oracle Corporation
- SAP SE
Key Takeaways
- North America occupancy sensor market grows from $1,051.4M (2024) to $1,992.2M (2029) at 11.2% CAGR
- North America leads in smart building adoption driven by energy efficiency mandates and IoT integration
- North America's commercial real estate sector is primary growth driver for occupancy sensor deployment
- North America benefits from strong regulatory support and corporate sustainability commitments through 2029
Occupancy Sensor Market Report Scope
| Report Metric | Details |
|---|---|
| Base Year | 2024 |
| Fastest Growing Segment | OUTDOOR (Operation) |
| Forecast Period | 2024–2029 |
| Growth Rate | CAGR of 11.2% from 2024 to 2029 |
| Largest Segment | INDOOR (Operation) |
| Market Size Base Year (Billions) | ~USD 2.75 (2024) |
| Revenue Forecast (Billions) | ~USD 4.68 (2029) |
| Segments Covered | Type, Installation Type, Operation, Technology, Coverage Area, Network Connectivity, Protocol, Application, End Use, Residential Building Type, Commercial Building Type |
North America Occupancy Sensor Market Report Segmentation
11 segment dimensions are covered across the global market.
By Type
- Ceiling-Mounted
- Desk
- Wall-Mounted
By Installation Type
- New
- Retrofit
By Operation
- Indoor
- Outdoor
By Technology
- Dual Technology
- Other Technologies
- Pir
- Ultrasonic
By Coverage Area
- 180–360°
- 90–179°
- Less Than 90°
By Network Connectivity
- Wired
- Wireless
By Protocol
- Enocean
- Other Protocols
- Wi-Fi
- Z-Wave
- Zigbee
By Application
- Hvac Systems
- Lighting Systems
- Other Applications
- Security And Surveillance Systems
By End Use
- Commercial Building
- Commercial Buildings
- Residential Buildings
By Residential Building Type
- Apartments
- Independent Homes
By Commercial Building Type
- Educational Institutions
- Healthcare Facilities
- Industrial Facilities
- Offices
- Other Commercial Building Types
Target Audience
- Building Automation Manufacturers : Manufacturers need North America-specific market data to develop region-tailored products, identify distribution channels, and benchmark competitive positioning in this high-growth market.
- Commercial Real Estate Developers : Real estate firms require insights into occupancy sensor ROI, energy savings potential, and tenant demand for smart building features to justify capital investments in North American properties.
- Facility Management Companies : Facility managers need market intelligence on sensor technologies, integration capabilities, and cost-benefit analyses to recommend solutions to building owners and optimize operational efficiency.
- Technology Investors & PE Firms : Investors require detailed North America market forecasts, growth drivers, competitive dynamics, and exit opportunities to evaluate investment potential in occupancy sensor and smart building companies.
- Energy Efficiency Consultants : Consultants need regional market data, regulatory requirements, and technology trends to advise clients on occupancy sensor implementations and energy management strategies across North America.
Key Companies in the North America Occupancy Sensor Market
| Company | HQ | Ownership | Strongest segments |
|---|---|---|---|
| LENOVO | China | Public Company | Wall and ceiling mount–linked controllers (indoor),Desk-level and workspace management deployments,Outdoor and edge signage / kiosk deployments, |
| FIRST SENSOR AG | Germany | Public Company | Sensor chips and components for occupancy detection (PIR, ultrasonic, dual-tech),Integrated sensor systems for intelligent buildings and industrial automation,Custom sensor manufacturing and design services for occupancy-enabled devices, |
| LEGRAND | France | Public Company | Wall Mount Occupancy Sensors,Ceiling Mount Occupancy Sensors,Desk and Workstation Sensors, |
| JOHNSON CONTROLS INC. | Ireland | Public Company | Ceiling mount indoor sensors (PIR, ultrasonic, dual-technology),Wall mount indoor sensors,Desk and workstation-level sensors, |
| EATON | Ireland | Public Company | Wall Mount Sensors,Ceiling Mount Sensors,Desk and Task Sensors, |
| HONEYWELL INTERNATIONAL INC. | United States | Public Company | Wall Mount Occupancy Sensors,Ceiling Mount Occupancy Sensors,Desk and Task-level Sensors, |
| SCHNEIDER ELECTRIC | Canada | Public Company | Wall Mount Sensors,Ceiling Mount Sensors,Desk and Task-level Sensors, |
| ACUITY BRANDS, INC. | United States | Public Company | Wall-mount indoor PIR sensors,Ceiling-mount indoor PIR and dual-technology sensors,Outdoor occupancy and daylight sensors, |
| HUBBELL | United States | Public Company | Wall Mount Sensors,Ceiling Mount Sensors,Desk / Task Sensors, |
| SIEMENS | Germany | Public Company | Ceiling Mount Indoor Sensors,Wall Mount Indoor Sensors,Desk and Workspace Sensors, |
LENOVO
Lenovo is a public company founded in 1984 and based in China.
FIRST SENSOR AG
First Sensor AG is a public company founded in 1991 and based in Germany, with 538 employees.
LEGRAND
Legrand is a public company founded in 1865 and based in France, with 35,410 employees.
JOHNSON CONTROLS INC.
Johnson Controls Inc. is a public company founded in 1885 and based in Ireland, with 87,000 employees.
EATON
Eaton is a public company founded in 1911 and based in Ireland, with 97,303 employees.
HONEYWELL INTERNATIONAL INC.
Honeywell International Inc. is a public company founded in 1885 and based in the United States, with 101,000 employees.
SCHNEIDER ELECTRIC
Schneider Electric is a public company founded in 1836 and based in Canada, with 158,122 employees.
ACUITY BRANDS, INC.
Acuity Brands, Inc. is a public company founded in 2001 and based in the United States, with 13,800 employees.
HUBBELL
Hubbell is a public company founded in 1888 and based in the United States, with 18,200 employees.
SIEMENS
Siemens is a public company founded in 1847 and based in Germany, with 310,312 employees.
Countries within North America - compare and drill down
| Country | 2025 size (native) |
|---|---|
| US | USD 1538 Million |
| Canada | USD 318.8 Million |
| Mexico | USD 135.5 Million |
Country market size visualization
Reasons to Buy this Report
- Regional Market Segmentation : Gain detailed insights into North America's three major markets—US, Canada, and Mexico—with country-specific valuations, growth rates, and market dynamics to inform localized business strategies.
- Competitive Landscape Analysis : Understand the competitive positioning of occupancy sensor manufacturers and solution providers operating in North America, including market share distribution and strategic initiatives.
- Technology & Application Trends : Access comprehensive data on emerging technologies, integration with IoT platforms, AI analytics, and application trends across commercial, residential, and industrial sectors in North America.
- Investment & Growth Opportunities : Identify high-growth segments, emerging verticals, and geographic pockets within North America offering the strongest ROI potential for investors, manufacturers, and solution providers.
- Regulatory & Policy Insights : Stay informed on energy codes, building standards, sustainability mandates, and government incentives driving occupancy sensor adoption across North American markets.
Frequently asked questions
What is the current size of the occupancy sensor market in North America?
North America's occupancy sensor market was valued at $1,051.4 million in 2024 and is expected to grow to $1,992.2 million by 2029.
What is the projected growth rate for occupancy sensors in North America?
North America's occupancy sensor market is projected to grow at a compound annual growth rate (CAGR) of 11.2% from 2024 to 2029.
Which sectors drive occupancy sensor adoption in North America?
North America's primary adoption sectors include commercial office buildings, retail spaces, hospitality venues, and facilities with energy management priorities.
What factors support occupancy sensor growth in North America?
North America's growth is supported by energy efficiency regulations, IoT integration trends, corporate sustainability goals, and smart building technology investments.
How much will the North America occupancy sensor market grow by 2029?
North America's occupancy sensor market is expected to nearly double, growing by approximately $940.8 million from 2024 to 2029.
RESEARCH METHODOLOGY
The study used four major activities to estimate the market size of the occupancy sensor. Exhaustive secondary research was conducted to gather information on the market and its peer and parent markets. The next step was to validate these findings, assumptions, and sizing with industry experts across the value chain through primary research. Both top-down and bottom-up approaches were employed to estimate the total market size. Finally, market breakdown and data triangulation methods were utilized to estimate the market size for different segments and subsegments.
Secondary Research
The research methodology used to estimate and forecast the size of the occupancy sensor market began with the acquisition of data related to the revenues of key vendors in the market through secondary research. Various secondary sources have been referred to in the secondary research process for identifying and collecting information for this study. Secondary sources include annual reports, press releases, and investor presentations of companies; white papers, journals, certified publications, and articles by recognized authors; websites; directories; and databases. Secondary research has mainly been used to obtain key information about the value chain of the occupancy sensor market, key players, market classification, and segmentation according to the industry trends to the bottom-most level, geographic markets, and key developments from both market and technology-oriented perspectives. Secondary data has been collected and analyzed to determine the overall market size, further validated through primary research. The secondary research referred to for this research study involves the Semiconductor Industry Association (SIA), Electronic System Design Alliance (ESD Alliance), Institute of Electrical and Electronics Engineers (IEEE), Taiwan Semiconductor Industry Association (TSIA), European Semiconductor Industry Association (ESIA), and Korea Semiconductor Industry Association (KSIA). Moreover, the study involved extensive use of secondary sources, directories, and databases, such as Hoovers, Bloomberg Businessweek, Factiva, and OneSource, to identify and collect valuable information for a technical, market-oriented, and commercial study of the occupancy sensor market. Vendor offerings have been taken into consideration to determine market segmentation.
Primary Research
In the primary research, various primary sources from both the supply and demand sides have been interviewed to obtain the qualitative and quantitative information relevant to this report. Primary sources from the supply side include the key industry participants, subject-matter experts (SMEs), and C-level executives and consultants from various key companies and organizations in the occupancy sensor ecosystem. After the complete market engineering (including calculations for the market statistics, the market breakdown, the market size estimations, the market forecasting, and the data triangulation), extensive primary research has been conducted to verify and validate the critical market numbers obtained. Extensive qualitative and quantitative analyses have been performed during the market engineering process to list key information/insights throughout the report. Extensive primary research has been conducted after understanding the occupancy sensor market scenario through secondary research. Several primary interviews have been conducted with market experts from the demand and supply-side players across key regions, namely, North America, Europe, Asia Pacific, and the Rest of the World (Middle East, Africa, and South America). Various primary sources from both the supply and demand sides of the market have been interviewed to obtain qualitative and quantitative information. Following is the breakdown of the primary respondents.
Primary data has been collected through questionnaires, emails, and telephonic interviews. In the canvassing of primaries, various departments within organizations, such as sales, operations, and administration, were covered to provide a holistic viewpoint in our report. After interacting with industry experts, brief sessions were conducted with highly experienced independent consultants to reinforce the findings from our primaries. This and the in-house subject matter experts’ opinions have led us to the findings described in the remainder of this report.
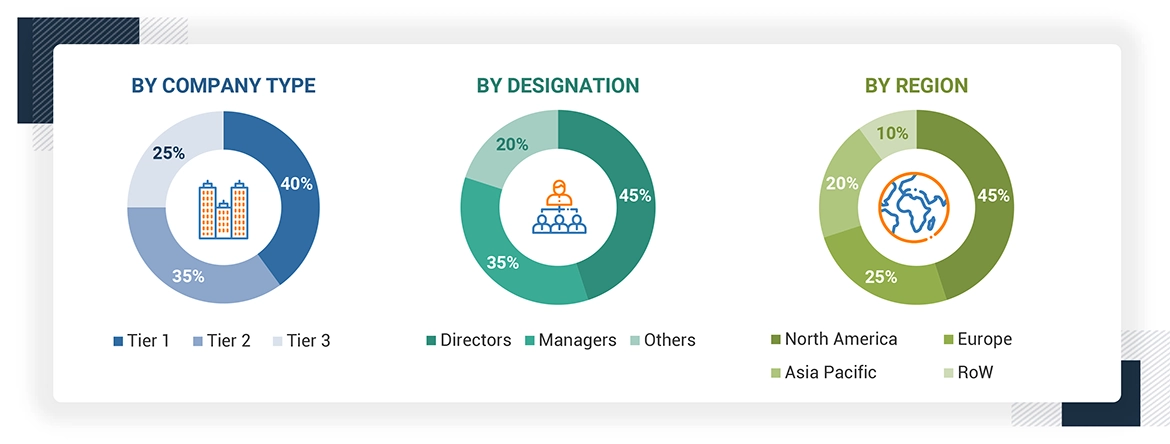
Note: The three tiers of the companies are defined based on their total revenue in 2023: Tier 1 - revenue greater than or equal to USD 1 billion; Tier 2 - revenue between USD 100 million and USD 1 billion; and Tier 3 revenue less than or equal to USD 100 million. Other designations include sales managers, marketing managers, and product managers.
About the assumptions considered for the study, To know download the pdf brochure
Market Size Estimation
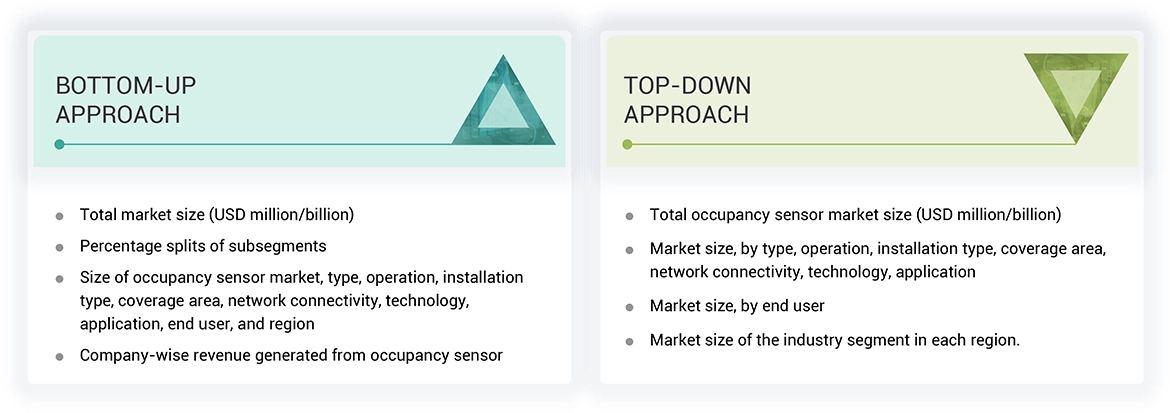
To estimate and validate the size of the occupancy sensor market and its submarkets, both top-down and bottom-up approaches were utilized. Secondary research was conducted to identify the key players in the market, and primary and secondary research was used to determine their market share in specific regions. The entire process involved studying top players' annual and financial reports and conducting extensive interviews with industry leaders such as CEOs, VPs, directors, and marketing executives. Secondary sources were used to determine all percentage shares and breakdowns, which were verified through primary sources. All parameters that could impact the markets covered in this research study were accounted for, analyzed in detail, verified through primary research, and consolidated to obtain the final quantitative and qualitative data.
Occupancy Sensor Market : Top-Down and Bottom-Up Approach
Data Triangulation
Once the overall size of the occupancy sensor market was determined using the methods described above, it was divided into multiple segments and subsegments. Market engineering was performed for each segment and subsegment using market breakdown and data triangulation methods, as applicable, to obtain accurate statistics. To triangulate the data, various factors and trends from the demand and supply sides were studied. The market was validated using both top-down and bottom-up approaches.
Market Definition
Occupancy sensor a device that detects the presence of people in a given area and controls devices such as lighting, HVAC (heating, ventilation, and air conditioning), or security related to whether it is occupied or vacant. These sensors automatically perform certain functions to prevent energy wastage, increase safety, and increase efficiency. They work based on the use of technologies of passive infrared (PIR) and ultrasonic detection. Occupancy sensors are controlling devices on energy use for many applications such as lighting, HVAC, and security systems. They can be mounted in walls, such as corner post or as wall switches, or on ceilings in order to detect the occupancy of a space. It can be deployed in residential and commercial settings to save energy and enhance automation systems. The sensors, by adjusting parameters automatically based on real time detection of an individual's presence, save operational cost and promote user comfort and security.
Key Stakeholders
- Raw material & manufacturing equipment suppliers
- Property and building developers
- Original equipment manufacturers (end-user applications/electronic product manufacturers)
- Distributors and retailers
- Network providers
- Research organizations
- System integrators
- Technology investors
- Lighting companies
Report Objectives
- To describe and forecast the occupancy sensor market, by type, operation, installation type, coverage area, network connectivity, technology, application, end user and region, in terms of value
- To describe and forecast the market for various segments across four central regions, namely, North America, Europe, Asia Pacific, and Rest of the World (RoW), in terms of value
- To strategically analyze the micro markets with regard to the individual growth trends, prospects, and contribution to the market
- To provide detailed information regarding drivers, restraints, opportunities, and challenges influencing the growth of the market
- To analyze opportunities for stakeholders by identifying high-growth segments in the market
- To provide a detailed overview of the value chain
- To strategically analyze the ecosystem, regulatory landscape, patent landscape, Porter’s five forces, import and export scenarios trade landscape, and case studies pertaining to the market under study
- To strategically profile key players in the occupancy sensor market and comprehensively analyze their market shares and core competencies
- To strategically profile the key players and provide a detailed competitive landscape of the market
- To analyze competitive developments such as partnerships, acquisitions, expansions, collaborations, and product launches, along with research and development (R&D) in the occupancy sensor market
Available Customizations
With the given market data, MarketsandMarkets offers customizations according to the specific requirements of companies. The following customization options are available for the report:
- Detailed analysis and profiling of additional market players (up to 5)
- Additional country-level analysis of the occupancy sensor market
Product Analysis
- Product matrix, which provides a detailed comparison of the product portfolio of each company in the occupancy sensor market.
Get the Full Occupancy Sensor Market Report
Full forecast, segment splits, and company analysis for all Occupancy Sensor Market.
- US Occupancy Sensor Market
- Canada Occupancy Sensor Market
- Mexico Occupancy Sensor Market
- Germany Occupancy Sensor Market
- UK Occupancy Sensor Market
- France Occupancy Sensor Market
- Rest Of Europe Occupancy Sensor Market
- China Occupancy Sensor Market
- Japan Occupancy Sensor Market
- South Korea Occupancy Sensor Market
- Australia Occupancy Sensor Market
- Rest Of Asia Pacific Occupancy Sensor Market
- GCC Occupancy Sensor Market
- South America Occupancy Sensor Market
Need a Tailored Report?
Customize this report to your needs
Get 10% FREE Customization
Customize This Report
