
US Organic Peroxide Market (2023-2028)

The US Organic Peroxide Market was valued at $89403.6 Million in 2023 and projected to reach to $127373 Million by 2028, representing a compound annual growth rate of 5.19%. The US organic peroxide market is positioned for sustained expansion through 2028, driven by robust demand from polymer and chemical manufacturing sectors.


| Market Size in | USD 26.32 MN |
| Market Forecast in | |
| CAGR | |
| Forecast Period | |
| Units Considered | Value (USD MN) |
US Organic Peroxide Market Trends and Insights
- The US market is projected to reach $127,373.0 million by 2028, representing a compound annual growth rate of 5.19%, outpacing global market trends.
- This acceleration in the US reflects robust demand across polymer processing, chemical synthesis, and industrial applications where organic peroxides serve as critical initiators and cross-linking agents. Driving the US market's expansion are increased investments in advanced manufacturing, rising demand from the plastics and composites industries, and growing adoption of specialty chemicals in pharmaceutical and agrochemical production.
- The US organic peroxide sector benefits from established infrastructure, technological innovation, and stringent quality standards that support premium product development.
- Between 2023 and 2028, the US market is expected to capture significant value as end-use industries modernize production capabilities and pursue sustainable chemical solutions..
Key Market Statistics
- CAGR (2023-2028) 5.19% CAGR
- Market Size, 2023 ~USD 89403.6 Million
- Forecast, 2028 ~USD 127373 Million
- Country US
US Organic Peroxide Market Overview
Market Valuation :
The US organic peroxide market reached $89,403.6 million in 2023, demonstrating strong industrial demand and established market maturity across multiple end-use sectors.
Projected Growth :
Expected to grow from $89,403.6 million in 2023 to $127,373.0 million by 2028, representing a robust 5.19% CAGR that outpaces the global market growth rate of 4.2%.
Regional Performance :
The US market demonstrates accelerated growth compared to global trends, driven by advanced polymer processing capabilities, chemical synthesis applications, and strong manufacturing infrastructure.
Key Growth Drivers :
Expansion fueled by increasing demand in polymer processing, chemical synthesis, pharmaceutical manufacturing, and specialty chemical production across US industrial sectors.
US Organic Peroxide Market Dynamics
- The 5.19% CAGR reflects strong industrial activity, technological advancement in production processes, and increasing applications in specialty chemicals.
- Key growth catalysts include rising polymer demand, pharmaceutical industry expansion, and enhanced manufacturing capabilities across the US industrial base. Market dynamics are supported by established supply chains, regulatory compliance infrastructure, and significant R&D investments by major manufacturers.
- The US market's outperformance relative to global trends indicates competitive advantages in innovation and production efficiency.
- Strategic opportunities exist for suppliers targeting polymer processors, chemical manufacturers, and specialty chemical producers throughout the forecast period..
Market Ecosystem
Related Ecosystem
Bulk Chemicals And Inorganics
- Corrosion Inhibitors
- Glycol Ethers
- Acetic Acid
- Acetone
- Ammonium Nitrate
- Basf se
- DOW CHEMICAL COMPANY
- Exxon Mobil Corporation
- AZELIS HOLDINGS SA
- Sinopec limited
Speciality Chemicals
- Corrosion Inhibitors
- Polyetheretherketone (PEEK)
- Acrylonitrile Butadiene Styrene (ABS)
- Epoxy Resin
- Polycarbonate
- Basf se
- DOW CHEMICAL COMPANY
- Evonik industries ag
- Clariant ag.
- Solvay sa
Key Takeaways
- The US organic peroxide market reached $89,403.6 million in 2023 and is forecast to grow to $127,373.0 million by 2028 at a 5.19% CAGR.
- The US market growth rate of 5.19% exceeds the global CAGR of 4.2%, indicating stronger regional demand and market maturity.
- The US organic peroxide sector is driven by polymer processing, composites manufacturing, and specialty chemical applications across multiple industries.
- Technological advancement and regulatory compliance in the US support premium product development and market differentiation through 2028.
Organic Peroxide Market Report Scope
| Report Metric | Details |
|---|---|
| Base Year | 2023 |
| Fastest Growing Segment | PULP AND PAPER (End-Use Industry) |
| Forecast Period | 2023-2028 |
| Growth Rate | CAGR of 4.2% from 2023 to 2028 |
| Largest Segment | 35% HYDROGEN PEROXIDE (Grade) |
| Market Size Base Year (Billions) | ~USD 1.95 (2023) |
| Revenue Forecast (Billions) | ~USD 2.39 (2028) |
| Segments Covered | Type, Application, Grade, End-Use Industry |
US Organic Peroxide Market Report Segmentation
4 segment dimensions are covered across the global market.
By Type
- Diacyl Peroxides
- Dialkyl Peroxides
- Hydro-Peroxides
- Ketone Peroxides
- Percarbonates
- Peroxy Ketals
- Peroxyesters
By Application
- Bleaching
- Chemical Synthesis
- Chemicals & Plastics
- Cleaning And Etching
- Coatings, Adhesives & Elastomers
- Coatings, Adhesives, & Elastomers
- Detergents
- Disinfectant
- Healthcare & Personal Care
- Other Applications
- Paper & Textiles
By Grade
- 3% Hydrogen Peroxide
- 35% Hydrogen Peroxide
- 6 To 10% Hydrogen Peroxide
- 90% Hydrogen Peroxide
By End-Use Industry
- Electronics
- Food And Beverages
- Healthcare
- Oil And Gas
- Pulp And Paper
- Textiles And Laundry
- Water Treatment
US: ORGANIC PEROXIDE MARKET, BY APPLICATION, 2021–2030
| Segment | 2021 | 2022 | 2023 | 2024 | 2025 | 2026 | 2027 | 2028 | 2029 | 2030 | CAGR (%) |
|---|---|---|---|---|---|---|---|---|---|---|---|
| CHEMICALS & PLASTICS | 293.8 | 309.4 | 325.7 | 342.9 | 360.9 | 379.9 | 399.7 | 420.6 | 442.6 | 465.6 | 5.24 |
| COATINGS, ADHESIVES & ELASTOMERS | 99.4 | 103.1 | 107 | 110.9 | 115 | 119.3 | 123.7 | 128.3 | 133.1 | 138 | 3.71 |
| DETERGENTS | 31.6 | 32.6 | 33.6 | 34.7 | 35.8 | 36.9 | 38.1 | 39.3 | 40.5 | 41.8 | 3.13 |
| HEALTHCARE & PERSONAL CARE | 12.8 | 13.3 | 13.7 | 14.2 | 14.7 | 15.2 | 15.7 | 16.3 | 16.8 | 17.4 | 3.44 |
| OTHER APPLICATIONS | 14.1 | 14.3 | 14.6 | 14.8 | 15 | 15.3 | 15.5 | 15.8 | 16 | 16.3 | 1.6 |
| PAPER & TEXTILES | 43.6 | 44.4 | 45.3 | 46.1 | 47 | 47.8 | 48.7 | 49.6 | 50.5 | 51.5 | 1.85 |
| TOTAL | 495.5 | 517.2 | 539.9 | 563.6 | 588.4 | 614.4 | 641.5 | 669.8 | 699.5 | 730.5 | 4.41 |
Target Audience
- Chemical Manufacturers : US-based producers need market sizing and growth forecasts to optimize production capacity, plan capital investments, and identify expansion opportunities in organic peroxide applications.
- Polymer Processing Companies : Manufacturers requiring organic peroxides for polymer production need US-specific demand data to forecast raw material requirements, negotiate supplier contracts, and plan procurement strategies.
- Investment & Private Equity Firms : Investors evaluating M&A opportunities and portfolio companies in the US chemical sector require validated market data, growth projections, and competitive landscape analysis.
- Pharmaceutical & Specialty Chemical Producers : Companies utilizing organic peroxides in synthesis and manufacturing need US market intelligence to assess supply availability, plan production scaling, and evaluate market entry strategies.
- Business Development & Strategy Teams : Corporate strategists need comprehensive US market analysis to support business case development, competitive positioning, partnership evaluation, and long-term strategic planning initiatives.
Reasons to Buy this Report
- Market Size & Growth Validation : Access precise US market valuation ($89.4B in 2023) and verified forecast data ($127.4B by 2028) to support investment decisions, business planning, and competitive positioning strategies.
- Outperformance Insights : Understand why the US market grows at 5.19% CAGR versus 4.2% globally, identifying regional competitive advantages and market dynamics unique to American industrial sectors.
- Sector-Specific Demand Analysis : Gain detailed intelligence on US demand drivers across polymer processing, chemical synthesis, pharmaceuticals, and specialty chemicals to target high-growth application segments.
- Strategic Market Positioning : Leverage US-specific market data to develop targeted go-to-market strategies, identify partnership opportunities, and allocate resources effectively within the American market.
- Competitive Intelligence : Benchmark performance against US market trends, understand regional supply-demand dynamics, and identify emerging opportunities in the $127.4B projected market by 2028.
Frequently asked questions
What was the US organic peroxide market size in 2023?
The US organic peroxide market was valued at $89,403.6 million in 2023, establishing a strong baseline for forecast growth through 2028.
What is the projected US organic peroxide market size by 2028?
The US organic peroxide market is projected to reach $127,373.0 million by 2028, representing significant expansion from 2023 levels.
What is the CAGR for the US organic peroxide market?
The US organic peroxide market is expected to grow at a compound annual growth rate of 5.19% between 2023 and 2028.
How does the US market compare to global organic peroxide growth?
The US market CAGR of 5.19% outpaces the global CAGR of 4.2%, demonstrating stronger regional demand and market dynamics.
What industries drive demand for organic peroxides in the US?
The US organic peroxide market is primarily driven by polymer processing, composites manufacturing, pharmaceuticals, agrochemicals, and specialty chemical synthesis applications.
RESEARCH METHODOLOGY
Extensive secondary sources, directories, and databases such as Hoovers, Bloomberg BusinessWeek, Factiva, and OneSource have been used to identify and collect information for this technical, market-oriented, and commercial study of the organic peroxide market. In-depth interviews were conducted with various primary respondents, which included key industry participants, subject matter experts (SMEs), C-level executives of key industry players, and industry consultants, among other experts, to obtain and verify critical qualitative and quantitative information and to assess prospects.
Secondary Research
In the secondary research process, various secondary sources have been referred to for identifying and collecting information for this study. Secondary sources included annual reports, press releases, and investor presentations of companies; white papers; publications from recognized websites; and databases. Secondary research has mainly been used to obtain key information about the supply chain of the industry, the total pool of key players, market classification & segmentation according to the industry trends to the bottom-most level, regional markets, and key developments from both market- and technology-oriented perspectives.
The market size of organic peroxide has been estimated based on secondary data available through paid and unpaid sources and by analyzing the product portfolios of key companies. This data has been further validated through various primary sources.
Primary Research
The organic peroxide market comprises various stakeholders in the supply chain and includes suppliers, manufacturers, and end-users. Various primary sources from the supply and demand sides of the organic peroxide market have been interviewed to obtain qualitative and quantitative information. Primary participants from the supply side include key opinion leaders, executives, vice presidents, and CEOs of companies in the market. Primary sources from the demand side include experts from end-use industries, associations and institutions involved in the market, and key opinion leaders.
Following is the breakdown of primary respondents
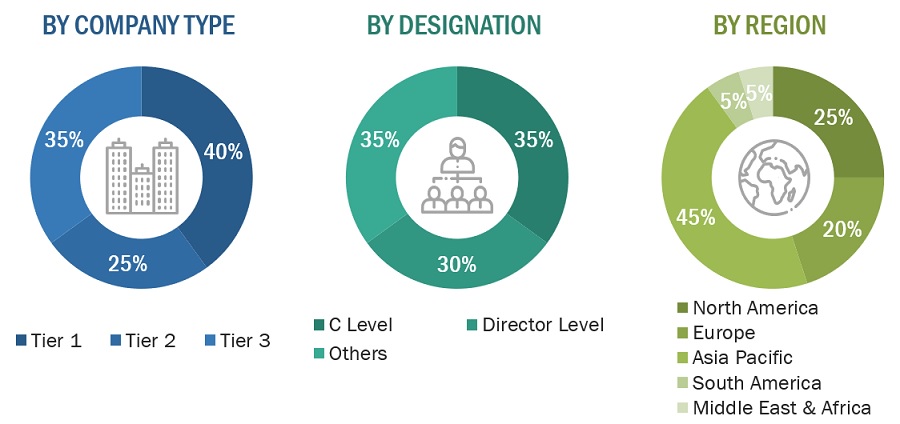
Notes: *Others include sales, marketing, and product managers.
Tier 1: >USD 5 Billion; Tier 2: USD 1 Billion– USD 5 Billion; and Tier 3: <USD 1 Billion.
To know about the assumptions considered for the study, download the pdf brochure
Market Size Estimation
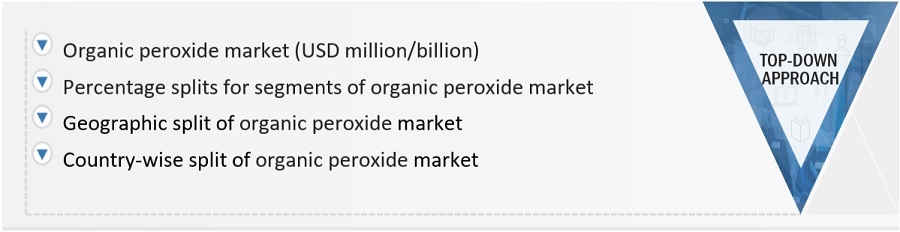
Both top-down and bottom-up approaches were used to estimate and validate the total size of the global organic peroxide market. These approaches were also used extensively to estimate the size of various dependent sub-segments in the market. The research methodology used to estimate the market size includes the following details:
- The key players in the industry and markets have been identified through extensive secondary research.
- The industry’s supply chain and market size, in terms of value, have been determined through primary and secondary research processes.
- All percentage shares, splits, and breakdowns have been determined using secondary sources and verified through primary sources.
- All possible parameters that affect the markets covered in this research study have been accounted for, viewed in extensive detail, verified through primary research, and analyzed to obtain the final quantitative and qualitative data.
- The research included the study of reports, reviews, and newsletters of top market players, along with extensive interviews for opinions from leaders such as directors and marketing executives.
Top-Down Approach
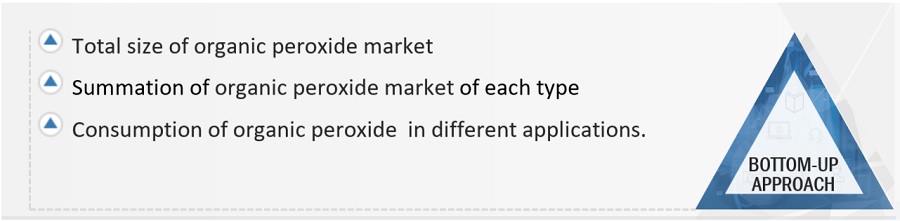
To know about the assumptions considered for the study, Request for Free Sample Report
Bottom-Up Approach
Data Triangulation
After arriving at the overall market size, the total market has been split into several segments. Where applicable, the data triangulation procedure has been employed to complete the market estimation process and arrive at the exact statistics for all segments. The data has been triangulated by studying various factors and trends from both the demand and supply sides. The market size has been validated using both the top-down and bottom-up approaches.
Market Definition
As per The Australian Dangerous Goods Code, Organic peroxide are chemical compound having the bivalent -O-O- structure. These compounds can be considered as derivatives of hydrogen peroxide where one or both hydrogen atoms have been replaced by organic radicals. These substances are thermally unstable, prone to exothermic self-accelerating decomposition. Additionally, they may exhibit hazardous properties, including explosive decomposition, rapid combustion, sensitivity to impact or friction, dangerous reactivity with other substances, and the potential to cause damage to the eyes. Due to these characteristics, careful handling and storage measures are crucial to prevent accidents and ensure safety.
Key stakeholders
- Raw material suppliers and producers
- Organic peroxide manufacturers, dealers, and suppliers
- Regulatory bodies
- Organic peroxide distributors/suppliers
- Local government
- Industry associations
- Investment banks
- Consulting companies/Consultants in Organic peroxide Sectors
- Raw material providers
Report Objectives
- To estimate and forecast the organic peroxide market, in terms of value and volume
- To elaborate drivers, restraints, opportunities, and challenges in the market
- To define, describe, and forecast the market size, based on type, application, and region
- To forecast the market size along with segments and submarkets, in key regions: North America, Europe, Asia Pacific, Middle East & Africa, and South America with their key countries
- To analyze growth opportunities in the market for stakeholders and provide details on the competitive landscape for market leaders
- To strategically profile key players and comprehensively analyze their market shares and core competencies
- To analyze competitive developments, such as merger & acquisition, expansion & investment, agreement, partnership & joint venture, and new product development in the organic peroxide market
Available Customizations:
Along with the given market data, MarketsandMarkets offers customizations as per the specific needs of the companies. The following customization options are available for the report:
Product Analysis:
- Product Matrix, which gives a detailed comparison of the product portfolio of each company
Regional Analysis:
- Further breakdown of the Rest of the Asia Pacific, organic peroxide market
- Further breakdown of the Rest of Europe, organic peroxide market
- Further breakdown of the Rest of South America, organic peroxide market
- Further breakdown of the Rest of Middle East & Africa, organic peroxide market
Company Information:
- Detailed analysis and profiling of additional market players (up to 5)
Get the Full Organic Peroxide Market Report
Full forecast, segment splits, and company analysis for all Organic Peroxide Market.
- China Organic Peroxide Market
- Japan Organic Peroxide Market
- India Organic Peroxide Market
- South Korea Organic Peroxide Market
- Indonesia Organic Peroxide Market
- Canada Organic Peroxide Market
- Mexico Organic Peroxide Market
- Germany Organic Peroxide Market
- France Organic Peroxide Market
- UK Organic Peroxide Market
- Italy Organic Peroxide Market
- Russia Organic Peroxide Market
- Turkey Organic Peroxide Market
- South Africa Organic Peroxide Market
- Brazil Organic Peroxide Market
- Argentina Organic Peroxide Market
- Rest Of Europe Organic Peroxide Market
- Rest Of Asia Pacific Organic Peroxide Market
- GCC Countries Organic Peroxide Market
- -Rest Of The GCC Organic Peroxide Market
- Rest Of South America Organic Peroxide Market
Need a Tailored Report?
Customize this report to your needs
Get 10% FREE Customization
Customize This Report
