
Europe Photoelectric Sensor Market (2025-2030)

The Europe Photoelectric Sensor Market was valued at $458.5 Million in 2025 and projected to reach to $708.2 Million by 2030, representing a compound annual growth rate of 6.4%. Europe's photoelectric sensor market is positioned for steady growth, expanding from $458.5 million in 2025 to $708.2 million by 2030.


| Market Size in | USD 26.32 MN |
| Market Forecast in | |
| CAGR | |
| Forecast Period | |
| Units Considered | Value (USD MN) |
Europe Photoelectric Sensor Market Trends and Insights
- This steady expansion reflects Europe's strong industrial automation adoption, particularly in manufacturing and logistics sectors where photoelectric sensors are critical for object detection and positioning applications.
- Europe's mature industrial base and stringent quality standards drive consistent demand for advanced sensing technologies across automotive, food and beverage, and pharmaceutical industries. The European market benefits from significant investments in Industry 4.0 initiatives and smart factory implementations across the region.
- Europe's emphasis on sustainability and energy efficiency further accelerates photoelectric sensor adoption, as these devices enable precise automation that reduces waste and operational costs.
- Between 2025 and 2030, Europe is positioned to capture growing opportunities in robotics integration, warehouse automation, and IoT-enabled manufacturing systems, solidifying its role as a key growth market for photoelectric sensor technologies..
Key Market Statistics
- CAGR (2025-2030) 6.4% CAGR
- Market Size, 2025 ~USD 458.5 Million
- Forecast, 2030 ~USD 708.2 Million
- Geography Europe
Europe Photoelectric Sensor Market Overview
Germany Leads European Market :
Germany dominates Europe's photoelectric sensor market with a valuation of $221.7 million in 2025, driven by its robust manufacturing sector and advanced industrial automation infrastructure across automotive and machinery industries.
Strong Industrial Automation Adoption :
Europe's manufacturing and logistics sectors are increasingly integrating photoelectric sensors for object detection and positioning applications, supporting the region's 6.4% CAGR through 2030.
UK and France as Secondary Markets :
The UK ($164.3 million) and France ($126.8 million) represent significant secondary markets in Europe, contributing substantially to the region's overall growth trajectory and technological innovation.
Steady Growth Below Global Pace :
Europe's 6.4% CAGR trails the global market growth of 8.1%, reflecting mature market dynamics but sustained demand from established industrial sectors and regulatory compliance requirements.
Europe Photoelectric Sensor Market Dynamics
- This growth is underpinned by the region's mature industrial base, particularly in Germany, UK, and France, where manufacturing automation and logistics optimization drive sensor adoption.
- European industries are increasingly investing in smart factory initiatives and Industry 4.0 technologies, creating sustained demand for reliable detection solutions. The market outlook remains positive despite growing competition from Asian manufacturers.
- European companies are differentiating through advanced sensor technologies, integration with IoT platforms, and compliance with stringent EU regulations.
- Investment in automation across food processing, pharmaceutical, and automotive sectors will continue to fuel demand, while the region's focus on sustainability and energy efficiency further supports long-term market expansion..
Market Ecosystem
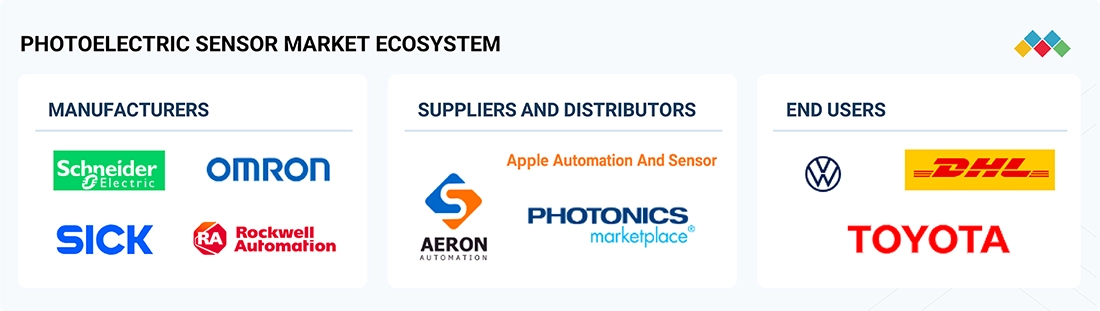
Photoelectric Sensor Market Growth: COMMERCIAL USE CASES ACROSS INDUSTRIES
| COMPANY | USE CASE DESCRIPTION | BENEFITS |
|---|---|---|
 |
Photoelectric sensors for material handling and conveyor line detection in food & beverage packaging facilities | Ensures reliable object detection in dusty/wet environments, reducing false triggers and downtime while complying with hygiene standards for efficient throughput |
 |
Fiber-optic photoelectric sensors for high-precision inspection and edge detection in semiconductor production | Achieves sub-millimeter accuracy with fast response times, enabling defect-free processes and real-time analytics for superior yield and compliance |
 |
Through-beam photoelectric sensors for position monitoring and safety zoning in automotive assembly lines | Provides high-speed, accurate sensing with IIoT integration, enabling predictive maintenance and seamless automation for enhanced productivity and safety |
 |
Diffuse photoelectric sensors for object recognition and hazard avoidance in logistics and warehouse automation | Offers compact, rugged design for harsh conditions, with background suppression for reliable detection, improving operational efficiency and worker safety |
 |
Retro-reflective photoelectric sensors for proximity detection in electronics manufacturing and robot guarding | Delivers long-range, non-contact monitoring with adjustable sensitivity, minimizing errors and supporting dynamic workflows for precise quality control |
Logos and trademarks shown above are the property of their respective owners. Their use here is for informational and illustrative purposes only.
Related Ecosystem
Sensors And Control
- Sensors
- Image Sensors
- Temperature Sensors
- Pressure Sensors
- Flow Sensors
- BAUMER ELECTRIC AG
- HONEYWELL INTERNATIONAL INC.
- Lenovo
- Stmicroelectronics
- Texas Instruments Incorporated
Key Takeaways
- Europe's photoelectric sensor market will grow from $458.5M (2025) to $708.2M (2030) at a 6.4% CAGR.
- Europe's industrial automation and Industry 4.0 investments are primary drivers of photoelectric sensor demand.
- Sustainability regulations and energy efficiency mandates in Europe accelerate adoption of advanced sensing solutions.
- Europe's mature manufacturing base across automotive, pharma, and food sectors ensures stable long-term market growth.
Photoelectric Sensor Market Report Scope
| Report Metric | Details |
|---|---|
| Base Year | 2025 |
| Fastest Growing Segment | SLOT/FORK MODULES (Mounting Type) |
| Forecast Period | 2025–2030 |
| Growth Rate | CAGR of 8.1% from 2025 to 2030 |
| Largest Segment | LED (Beam Source) |
| Market Size Base Year (Billions) | ~USD 2.33 (2025) |
| Revenue Forecast (Billions) | ~USD 3.44 (2030) |
| Segments Covered | Sensing Mode, Sensing Range, End User, Structural Type, Mounting Type, Type, Beam Source |
Europe Photoelectric Sensor Market Report Segmentation
7 segment dimensions are covered across the global market.
By Sensing Mode
- Diffuse Reflective
- Retro Reflective
- Through Beam
By Sensing Range
- Long Range (1 M–30 M)
- Mid Range (100 Mm–1 M)
- Mid Range(100 Mm–1 M)
- Short Range (< 100 Mm)
- Short Range (<100 Mm)
- Short Range(< 100 Mm)
- Ultra Long Range (> 30 M)
- Ultra Long Range(> 30 M)
By End User
- Automotive Manufacturing
- Consumer Goods
- Energy & Utilities
- Food & Beverage
- Packaging And Printing & E-Commerce Logistics
- Packaging And Printing, And E-Commerce Logistics
- Pharmaceutical & Medical
- Pharmaceuticals & Medical
- Semiconductor & Electronics
By Structural Type
- Fiber-Optic Photoelectric Sensors
- Multi-Beam/Array Sensors
- Slot/Fork/Interrupter Sensors
By Mounting Type
- Cylindrical
- Rectangular
- Slot/Fork Modules
By Type
- M12
- M18
- M30
- M5
- M8
By Beam Source
- Laser
- Led
EUROPE: PHOTOELECTRIC SENSOR MARKET, BY END USER, 2025–2032
| Segment | 2025 | 2026 | 2027 | 2028 | 2029 | 2030 | 2031 | 2032 | CAGR (%) |
|---|---|---|---|---|---|---|---|---|---|
| AUTOMOTIVE MANUFACTURING | 101.4 | 105.9 | 111 | 116.5 | 122.5 | 129 | 136 | 142.1 | 4.9 |
| CONSUMER GOODS | 46.8 | 49.2 | 51.9 | 54.9 | 58 | 61.5 | 65.3 | 69.4 | 5.8 |
| ENERGY & UTILITIES | 22.4 | 23.4 | 24.5 | 25.6 | 26.9 | 28.2 | 29.7 | 30.5 | 4.5 |
| FOOD & BEVERAGE | 50.3 | 52.5 | 55 | 57.7 | 60.7 | 63.9 | 67.3 | 71 | 5.1 |
| OTHERS | 31.5 | 32.6 | 33.7 | 34.8 | 35.7 | 36.6 | 37.3 | 40 | 3.5 |
| PACKAGING AND PRINTING & E-COMMERCE LOGISTICS | 90.1 | 97.5 | 105.7 | 114.8 | 125 | 136.3 | 148.8 | 162.5 | 8.8 |
| PHARMACEUTICAL & MEDICAL | 45 | 48.4 | 52.3 | 56.5 | 61.2 | 66.4 | 72.1 | 78.4 | 8.3 |
| SEMICONDUCTOR & ELECTRONICS | 71.1 | 75.7 | 80.7 | 86.3 | 92.4 | 99.1 | 106.4 | 114.3 | 7 |
| TOTAL | 458.5 | 485.3 | 514.8 | 547.1 | 582.3 | 621 | 663 | 708.2 | 6.4 |
Target Audience
- Manufacturing Equipment Suppliers : European manufacturers need detailed market data to optimize sensor integration in production lines, understand regional demand patterns, and identify growth opportunities in key industrial hubs.
- Logistics & Warehouse Operators : Logistics companies require market insights to evaluate photoelectric sensor investments for automation, understand cost-benefit analysis by country, and benchmark against regional competitors.
- Sensor Technology Developers : R&D teams and sensor manufacturers need comprehensive European market analysis to guide product innovation, identify underserved segments, and prioritize geographic expansion strategies.
- System Integrators & Consultants : Integration firms require country-level market data and application insights to advise clients on sensor selection, forecast ROI, and position solutions within Europe's industrial automation landscape.
- Investment & Strategy Teams : Corporate strategists and investors need market forecasts and regional breakdowns to evaluate acquisition targets, assess market entry opportunities, and make informed capital allocation decisions.
Key Companies in the Europe Photoelectric Sensor Market
| Company | HQ | Ownership | Strongest segments |
|---|---|---|---|
| FIRST SENSOR AG | Germany | Public Company | Through-beam photoelectric sensors,Retroreflective photoelectric sensors,Diffuse reflective photoelectric sensors, |
| OMRON CORPORATION | Japan | Public Company | Through-beam photoelectric sensors,Retroreflective photoelectric sensors,Diffuse reflective photoelectric sensors, |
| SCHNEIDER ELECTRIC | Canada | Public Company | Through-beam sensing mode,Retroreflective sensing mode,Diffuse reflective sensing mode, |
| KEYENCE CORPORATION | Japan | Public Company | Through-beam photoelectric sensors,Retroreflective photoelectric sensors,Diffuse reflective photoelectric sensors, |
| ROCKWELL AUTOMATION | United States | Public Company | Through-beam sensing mode,Retroreflective sensing mode,Diffuse reflective sensing mode, |
| SICK AG | Germany | Private Company | Through-beam photoelectric sensors,Retroreflective photoelectric sensors,Diffuse reflective photoelectric sensors, |
| PANASONIC CORPORATION | Japan | Public Company | Through-beam photoelectric sensors,Retroreflective photoelectric sensors,Diffuse reflective photoelectric sensors, |
| EATON | Ireland | Public Company | Through-beam sensing mode,Retroreflective sensing mode,Diffuse reflective sensing mode, |
FIRST SENSOR AG
First Sensor AG is a German public company founded in 1991 that employs 538 people. The company operates in the sensor technology sector.
OMRON CORPORATION
Omron Corporation is a Japanese public company established in 1933 with 26,050 employees. It is a major global manufacturer of automation and sensing technology.
SCHNEIDER ELECTRIC
Schneider Electric is a Canadian public company with roots dating back to 1836 and a workforce of 158,122 employees. It is a leading provider of energy management and automation solutions.
KEYENCE CORPORATION
Keyence Corporation is a Japanese public company founded in 1972 with 12,784 employees. The company specializes in factory automation and inspection equipment.
ROCKWELL AUTOMATION
Rockwell Automation is a United States-based public company established in 1903 with 26,000 employees. It provides industrial automation and information technology solutions.
SICK AG
Sick AG is a German private company founded in 1946 with 11,804 employees. The company is a leading manufacturer of sensors and sensor solutions for industrial applications.
PANASONIC CORPORATION
Panasonic Corporation is a Japanese public company established in 1918 with 183,685 employees. It is a diversified electronics manufacturer with operations across multiple industries.
EATON
Eaton is an Irish public company founded in 1911 with 97,303 employees. It provides diversified industrial manufacturing and technology solutions.
Countries within Europe - compare and drill down
| Country | 2025 size (native) |
|---|---|
| Germany | USD 221.7 Million |
| UK | USD 164.3 Million |
| France | USD 126.8 Million |
| Spain | USD 44.6 Million |
| Italy | USD 54.5 Million |
| Nordics | USD 18.4 Million |
| Rest Of Europe | USD 77.9 Million |
Country market size visualization
Reasons to Buy this Report
- Country-Level Market Insights : Access detailed market valuations for Germany ($221.7M), UK ($164.3M), France ($126.8M), and other European nations to identify high-potential markets and regional investment opportunities.
- Competitive Landscape Analysis : Understand Europe's competitive dynamics and how the region's 6.4% CAGR compares to the global 8.1% growth rate, revealing market maturity and differentiation opportunities.
- Industry-Specific Applications : Gain insights into photoelectric sensor adoption across European manufacturing, logistics, automotive, and pharmaceutical sectors to tailor product development and marketing strategies.
- Growth Forecasting Through 2030 : Leverage comprehensive projections showing Europe's market expansion to $708.2 million by 2030, enabling strategic planning and resource allocation for the next five years.
- Regulatory & Technology Trends : Understand how EU regulations, Industry 4.0 adoption, and sustainability initiatives shape the European photoelectric sensor market and influence buyer purchasing decisions.
Frequently asked questions
What is the current size of Europe's photoelectric sensor market?
Europe's photoelectric sensor market is valued at $458.5 million in 2025 and is projected to reach $708.2 million by 2030.
What is the expected growth rate for photoelectric sensors in Europe?
Europe's photoelectric sensor market is expected to grow at a compound annual growth rate (CAGR) of 6.4% from 2025 to 2030.
Which industries drive photoelectric sensor demand in Europe?
Key industries in Europe driving photoelectric sensor adoption include automotive manufacturing, food and beverage processing, pharmaceuticals, logistics, and general industrial automation.
How do Industry 4.0 initiatives impact Europe's photoelectric sensor market?
Europe's significant investments in Industry 4.0 and smart factory implementations increase demand for photoelectric sensors as essential components in automated production systems and IoT-enabled manufacturing.
What role do sustainability regulations play in Europe's photoelectric sensor market?
Europe's strict sustainability and energy efficiency regulations drive adoption of photoelectric sensors, as they enable precise automation that reduces waste, energy consumption, and operational costs.
RESEARCH METHODOLOGY
The study involved four major activities in estimating the current size of the photoelectric sensor market. Exhaustive secondary research was conducted to gather information on the market, adjacent markets, and the overall photoelectric sensor landscape. These findings, along with assumptions and projections, were validated through primary research involving interviews with industry experts and key stakeholders across the value chain. Both top-down and bottom-up approaches were utilized to estimate the overall market size. Subsequently, market breakdown and data triangulation techniques were applied to determine the sizes of various segments and subsegments. Two key sources, secondary and primary, were leveraged to conduct a comprehensive technical and commercial assessment of the photoelectric sensor market.
Secondary Research
The secondary research process referred to various secondary sources to identify and collect necessary information for this study. The secondary sources included annual reports, press releases, and investor presentations of companies; white papers; journals and certified publications; and articles from recognized authors, websites, directories, and databases. Secondary research was conducted to obtain key information about the industry’s supply chain, the market’s value chain, the total pool of key players, market segmentation according to the industry trends (to the bottom-most level), regional markets, and key developments from market- and technology-oriented perspectives. The secondary data was collected and analyzed to determine the overall market size, which is further validated through primary research.
Primary Research
Extensive primary research was conducted after gaining knowledge about the current scenario of the photoelectric sensor market through secondary research. Several primary interviews were conducted with experts from the demand and supply sides across four major regions—North America, Europe, Asia Pacific, and RoW. This primary data was collected through questionnaires, emails, and telephonic interviews.
Breakdown of Primary Interviews
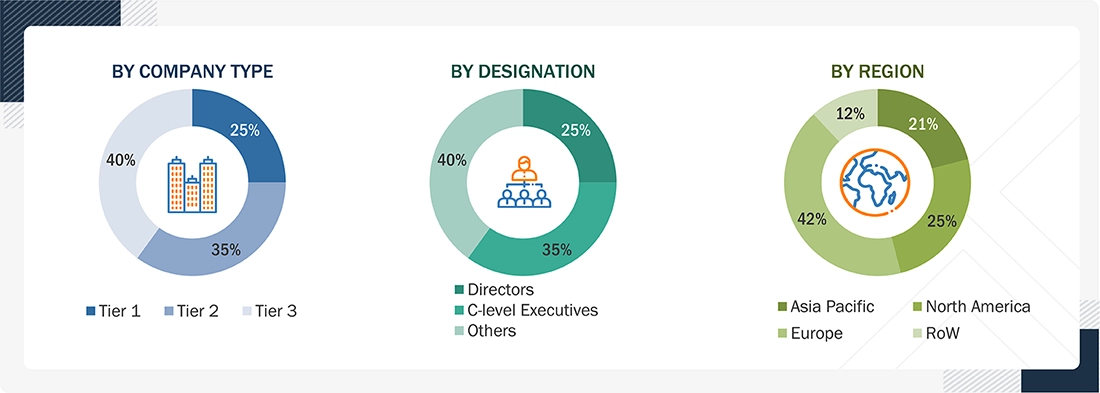
Notes: Three tiers of companies have been defined based on their total revenue as of 2024
Tier 1: >USD 500 million, Tier 2: USD 100 million–USD 500 million, and Tier 3: < USD 100 million.
Other designations include sales managers, marketing managers, and product managers.
To know about the assumptions considered for the study, download the pdf brochure
Market Size Estimation
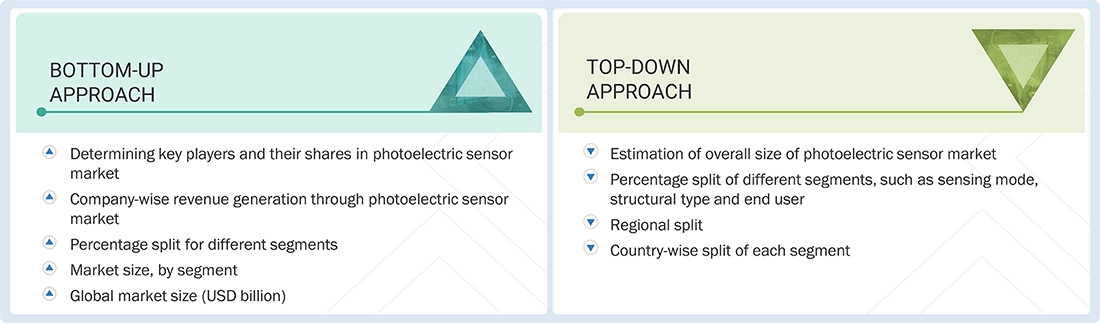
Both top-down and bottom-up approaches were used to estimate and validate the total size of the photoelectric sensor market. These methods have also been used extensively to estimate the size of various subsegments in the market. The following research methodology was used to estimate the market size:
- Major players in the markets were identified through extensive secondary research.
- The industry’s value chain and market size (in terms of value) were determined through primary and secondary research processes.
- All percentage shares, splits, and breakdowns were determined using secondary sources and verified through primary sources.
The market sizing includes the following:
Data Triangulation
After arriving at the overall size of the photoelectric sensor market using the market size estimation process explained above, the total market was split into several segments and subsegments. Data triangulation and market breakdown procedures were employed, wherever applicable, to complete the overall market engineering process and arrive at the exact statistics for all segments and subsegments of the market. The data was triangulated by studying various factors and trends from the demand and supply sides. The market size was also validated using the top-down and bottom-up approaches.
Market Definition
Photoelectric sensors detect objects, as well as changes in surface conditions, through their optical properties. They emit light beams (visible or infrared) from their emitters (light-emitting elements) and receive them at receivers (light-receiving elements). When emitted light is interrupted or reflected by the objects to be sensed, the amount of light that arrives at the receivers is changed. These receivers detect this change and convert it to an electrical output. Photoelectric sensors are not limited to detecting metal objects only. For instance, proximity sensors operate on the principle of light being interrupted or reflected by the targeted objects, which can be glass, plastic, wood, or liquid. Various types of photoelectric sensors, including through beam, retroreflective, and reflective, are used in numerous applications, such as consumer electronics, industrial manufacturing, and food & beverages. The photoelectric sensor market is diversified, with the presence of various established, as well as emerging players operating across its value chain.
Stakeholders
- Photoelectric sensor manufacturers
- Automotive and consumer electronics companies
- Semiconductor component suppliers
- Photoelectric sensor distributors and sales firms
- Electronic system assemblers
- Technology solution providers and design contractors
- Electronics and semiconductor companies
- Photoelectric sensor material suppliers
- Technology standards organizations, forums, alliances, and associations
- Universities and research organizations
- Government bodies
Report Objectives
- To describe and forecast the photoelectric sensor market, by sensing mode, structural type, sensing range, mounting type, beam source, end user, and region, in terms of value
- To describe and forecast the market with regard to four main regions: North America, Europe, Asia Pacific, and RoW, along with their respective countries, in terms of value
- To forecast the photoelectric sensor market, by sensing mode, in terms of volume
- To provide detailed information regarding major factors, such as drivers, restraints, opportunities, and challenges, influencing the market growth
- To provide a detailed overview of the photoelectric sensor value chain
- To strategically analyze micromarkets with respect to individual growth trends, prospects, and contributions to the photoelectric sensor market
- To analyze opportunities in the market for stakeholders by identifying high-growth segments of the photoelectric sensor market
- To strategically profile key players and comprehensively analyze their market position in terms of ranking and core competencies, along with detailing the competitive landscape for market leaders
- To analyze competitive strategies, such as product launches and developments, adopted by key players in the photoelectric sensor market
Get the Full Photoelectric Sensor Market Report
Full forecast, segment splits, and company analysis for all Photoelectric Sensor Market.
- US Photoelectric Sensor Market
- Canada Photoelectric Sensor Market
- Mexico Photoelectric Sensor Market
- Germany Photoelectric Sensor Market
- UK Photoelectric Sensor Market
- France Photoelectric Sensor Market
- Spain Photoelectric Sensor Market
- Italy Photoelectric Sensor Market
- Nordics Photoelectric Sensor Market
- Rest Of Europe Photoelectric Sensor Market
- China Photoelectric Sensor Market
- Japan Photoelectric Sensor Market
- India Photoelectric Sensor Market
- South Korea Photoelectric Sensor Market
- Australia Photoelectric Sensor Market
- Vietnam Photoelectric Sensor Market
- Thailand Photoelectric Sensor Market
- Indonesia Photoelectric Sensor Market
- Malaysia Photoelectric Sensor Market
- Rest Of Asia Pacific Photoelectric Sensor Market
- Saudi Arabia Photoelectric Sensor Market
- UAE Photoelectric Sensor Market
- Qatar Photoelectric Sensor Market
- Kuwait Photoelectric Sensor Market
- Bahrain Photoelectric Sensor Market
- Oman Photoelectric Sensor Market
- Rest Of Middle East Photoelectric Sensor Market
- South Africa Photoelectric Sensor Market
- Other African Countries Photoelectric Sensor Market
Need a Tailored Report?
Customize this report to your needs
Get 10% FREE Customization
Customize This Report
