
Proximity Sensor Market Size, Share & Trends

Proximity Sensor Market Size, Share & Trends by Technology (Inductive, Capacitive, Magnetic, Photoelectric/Optical, Ultrasonic), Product Type (Fixed & Adjustable distance), Range (<10 MM, 10-20 MM, 21-40 MM, >40 MM), Output and Region - Global Forecast to 2030


Proximity Sensor Market Size, Share & Trends
According to Marketsandmarkets, the proximity sensors market size is projected to reach USD 5.97 billion by 2030 from USD 4.28 billion in 2025, at a CAGR of 6.9% during the forecast period. Proximity sensors are non-contact devices that detect the presence or absence of nearby objects without physical interaction, often using electromagnetic fields or infrared beams. These sensors are widely used in industrial automation, automotive, and consumer electronics to improve efficiency and safety. A key factor driving the market is the growing adoption of automation across industries, where proximity sensors enable precise object detection and control. As manufacturers increasingly implement automated systems, the demand for reliable, efficient, and compact sensors continues to rise, creating significant growth opportunities.
MARKET SCOPE
| REPORT METRIC | DETAILS |
|---|---|
| Market Size Value in 2025 | USD 4.28 Billion |
| Revenue Forecast in 2030 | USD 5.97 Billion |
| Growth Rate | CAGR of 6.9% from 2025–2030 |
| Years Considered | 2021–2024 |
| Base Year | 2024 |
| Forecast Period | 2025–2030 |
| Units Considered | Value (USD Billion) and Volume (Million Units) |
| Report Coverage | Revenue forecast, company ranking, competitive landscape, growth factors, and trends |
| Top Companies |
|
| Growth Driver |
|
| Segments Covered |
|
| Regional Scope | North America, Europe, Asia Pacific, and RoW |
Market Size & Forecast
KEY TAKEAWAYS
-
BY TECHNOLOGYThe proximity sensor technology market comprises inductive, capacitive, magnetic, photoelectric/optical, ultrasonic, and other technologies, with inductive holding the largest share, as these are widely utilized in industrial applications due to their effectiveness in detecting metallic objects.
-
BY PRODUCT TYPEThe proximity sensor product type market comprises fixed distance and adjustable distance, with fixed holding the largest share, as these are designed to detect objects within a specific distance from the sensor face, making them ideal for applications where the target object's position remains consistent.
-
BY RANGEThe proximity sensor range market comprises <10mm, 10–20mm, 21–40mm, and>40 mm, with <10mm holding the largest share, as these are indispensable in high-precision environments.
-
BY OUTPUTThe proximity sensor output market is comprised of analog and digital, with analog holding the largest share. Analog output sensors provide a continuous signal that varies in proportion to the distance or proximity of an object, offering precise measurement capabilities and real-time feedback.
-
BY END-USE INDUSTRYThe proximity sensor end-use industry comprises aerospace & defense, automotive, pharmaceuticals, manufacturing, building automation, consumer electronics, and other end-use industries, with automotive holding the largest share. The push for automation and safety standards across the automotive sector significantly boosts the adoption of proximity sensors.
-
BY REGIONAsia Pacific is expected to grow fastest, with a CAGR of 7.7%, fueled by rapid industrialization, expanding automotive production, and strong consumer electronics demand in countries like China, Japan, and India.
-
COMPETITIVE LANDSCAPEThe major market players have adopted both organic and inorganic strategies, including partnerships and investments. For instance, OMRON Corporation and KEYENCE CORPORATION have entered into several agreements and partnerships to cater to the growing demand for proximity sensors across innovative applications.
The proximity sensor market share is projected to grow rapidly over the next decade. Proximity sensors are crucial in enabling touchless operation, object detection, and motion sensing, which are vital for smart homes, wearables, and connected industrial systems. With growing demand for automation, safety, and energy-efficient solutions, these sensors are increasingly integrated into modern applications. This trend is creating strong growth opportunities for the market worldwide.

Source: Secondary Research, Interviews with Experts, MarketsandMarkets Analysis
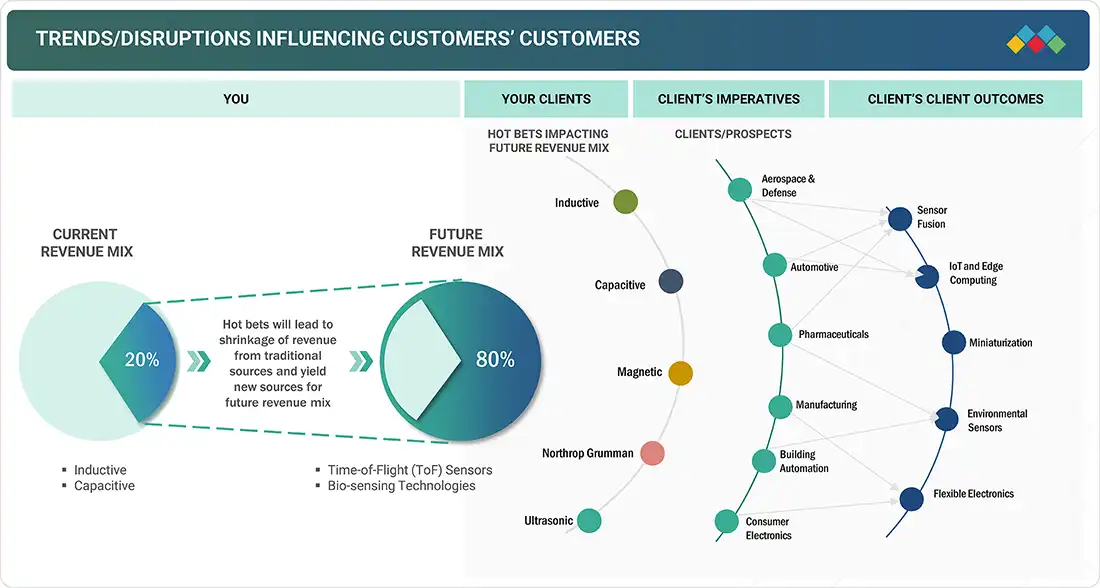
TRENDS & DISRUPTIONS IMPACTING CUSTOMERS' CUSTOMERS
The disruptions and emerging trends impacting customers' businesses in the proximity sensor market trends include increasing demand for biosensing technologies and time-of-flight (ToF) sensor methods across various industries and sectors.
Source: Secondary Research, Interviews with Experts, MarketsandMarkets Analysis
MARKET DYNAMICS
Level
-
Increasing adoption of Industry 4.0 technologies

-
Mounting demand for smart home devices and consumer electronics

Level
-
Limited sensing range

-
High price sensitivity in emerging economies

Level
-
Increasing use in industrial applications due to technological advancements

-
Growing trend of sensor miniaturization

Level
-
Availability of alternative sensing technologies

-
Cybersecurity risks associated with IoT sensors

Source: Secondary Research, Interviews with Experts, MarketsandMarkets Analysis
Driver: Increasing adoption of Industry 4.0 technologies.
The increasing adoption of Industry 4.0 technologies is a major driver for the proximity sensor market. Smart factories rely on advanced sensors for real-time monitoring, predictive maintenance, and seamless machine-to-machine communication. Proximity sensors enable precise object detection and automation, making them essential for robotics, assembly lines, and quality control systems. As industries move toward digitalization and intelligent manufacturing, the demand for reliable and efficient proximity sensors is expected to grow rapidly.
Restraint: High price sensitivity in emerging economies.
A key restraint for the proximity sensors market is the high price sensitivity in emerging economies. Many industries in these regions operate with limited budgets, making it challenging to adopt advanced sensor technologies. The higher costs of quality sensors, combined with the need for large-scale deployment in automation, often discourage investment. As a result, businesses may opt for cheaper alternatives or delay automation projects, slowing down market growth in these price-sensitive regions.
Opportunity: Growing trend of sensor miniaturization
The growing trend of sensor miniaturization presents a significant opportunity for the proximity sensor market. Smaller, compact sensors can be seamlessly integrated into space-constrained applications such as smartphones, wearables, medical devices, and advanced automotive systems. Miniaturized sensors not only reduce power consumption but also enhance device performance and portability. This trend aligns with the rising demand for lightweight, efficient, and multifunctional electronic products, creating new avenues for market expansion across consumer electronics, healthcare, and industrial automation.
Challenge: Cybersecurity risks associated with IoT sensors
A major challenge for the proximity sensors market is the cybersecurity risks linked with IoT integration. As proximity sensors are increasingly embedded in connected devices and industrial systems, they become potential entry points for cyberattacks. Unauthorized access or data breaches can compromise sensitive information, disrupt operations, and impact safety in critical applications like healthcare and manufacturing. Ensuring robust data protection and secure communication protocols adds complexity and cost, posing a significant hurdle for the wider adoption of IoT-enabled proximity sensors.
Proximity Sensor Market: COMMERCIAL USE CASES ACROSS INDUSTRIES
| COMPANY | USE CASE DESCRIPTION | BENEFITS |
|---|---|---|
 |
Proximity sensors for industrial automation systems, including assembly lines and robotics | Reliable non-contact object detection, improved safety, reduced downtime, enhanced production efficiency |
 |
High-precision proximity sensors for electronics and semiconductor manufacturing | Micron-level detection accuracy, faster inspection, higher yield rates, reduced defect rates |
 |
Compact proximity sensors integrated into consumer electronics and automotive applications | Miniaturized design, low-power consumption, seamless integration, enhanced user experience |
 |
Proximity sensors for logistics, packaging, and safety systems in smart factories | Accurate detection in harsh environments, improved machine safety, reduced operational errors, higher throughput |
 |
Proximity sensors for smartphones, IoT devices, and wearables | Low-power operation, gesture recognition, space-saving design, enhanced device interactivity and battery efficiency |
Logos and trademarks shown above are the property of their respective owners. Their use here is for informational and illustrative purposes only.
MARKET ECOSYSTEM
The proximity sensor ecosystem involves identifying and analyzing interconnected relationships among stakeholders, including raw material and component suppliers, manufacturers, distributors, and end users. Provide essential materials such as semiconductors, metals, and packaging materials for manufacturers. The distributors and suppliers act as those who establish direct contact between the manufacturing companies and end users to concentrate on the supply chain, increasing operational efficiency and profitability.
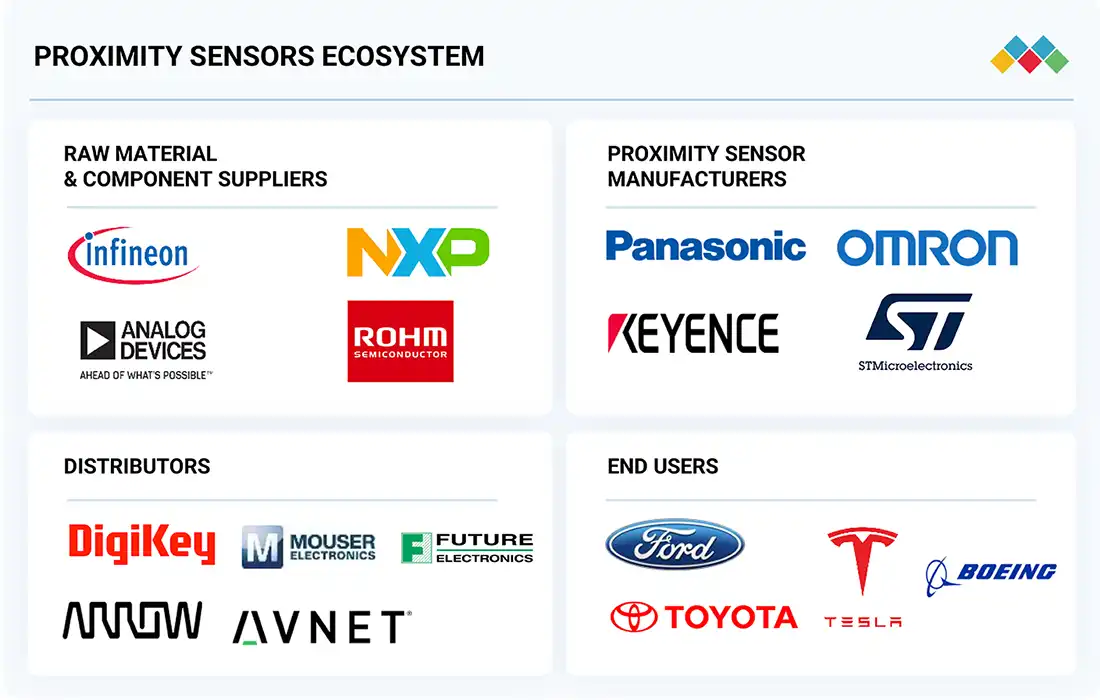
Logos and trademarks shown above are the property of their respective owners. Their use here is for informational and illustrative purposes only.
MARKET SEGMENTS
Source: Secondary Research, Interviews with Experts, MarketsandMarkets Analysis
Proximity Sensors Market, By Technology
The inductive segment is expected to hold the largest proximity sensor market share by 2030. Inductive sensors are highly reliable for detecting metallic objects, offering durability, accuracy, and resistance to harsh industrial environments such as heat, dust, and vibrations. Their widespread use in industrial automation, robotics, and manufacturing makes them a preferred choice for ensuring safety and efficiency in production lines. As industries increasingly automate operations, inductive sensors are set to remain the leading technological segment in this market.
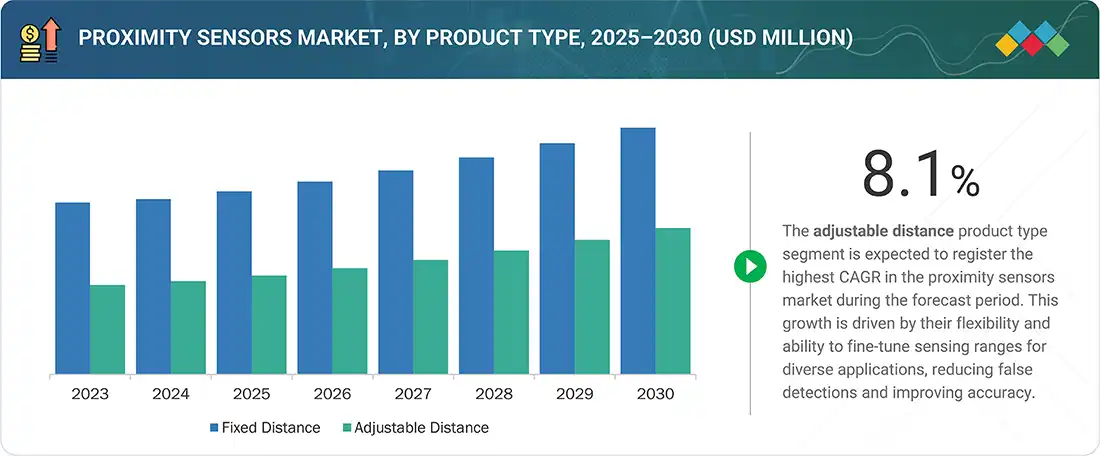
Proximity Sensors Market, By Product Type
Fixed distance in the product type segment will account for the largest market share in 2025. This dominance is attributed to their simplicity, cost-effectiveness, and widespread use in industrial automation, manufacturing, and consumer electronics. Fixed distance sensors offer reliable and consistent performance without the need for adjustments, making them ideal for mass deployment in standardized applications. Their robust design and ease of integration further drive adoption, especially in automotive assembly lines, packaging, and safety systems.
Proximity Sensors Market, By Range
The <10 mm sensing range is expected to account for the largest market share in the proximity sensors market by 2030. This dominance is attributed to the widespread use of short-range sensors in applications requiring high precision, such as consumer electronics, industrial automation, and robotics. Their compact design and cost-effectiveness make them ideal for integration into smartphones, wearables, and assembly line equipment. Additionally, the rising demand for miniaturized sensors in automotive and medical devices further strengthens the growth of this segment.
Proximity Sensors Market, By Output
The analog in the output segment is expected to witness the highest CAGR in the proximity sensor market by 2030. Analog proximity sensors provide continuous signals that represent the exact distance of an object, offering higher precision compared to digital counterparts. This makes them ideal for applications requiring accurate position control, such as robotics, industrial automation, and quality inspection systems. The growing demand for advanced manufacturing processes and real-time monitoring is fueling their adoption.
Proximity Sensors Market, By End-use Industry
Based on end-use industry, the automotive segment is expected to witness the highest CAGR during the forecast period. This growth is fueled by the rising integration of sensors in advanced driver-assistance systems (ADAS), autonomous driving technologies, and electric vehicles. Proximity sensors are widely used in applications such as parking assistance, collision avoidance, blind-spot detection, and infotainment systems, enhancing both safety and comfort. Increasing consumer demand for smart, safe, and connected vehicles, coupled with stringent government regulations on road safety, is further accelerating adoption. Additionally, the rapid shift toward electrification and automation in the automotive sector is creating new opportunities for proximity sensor deployment.
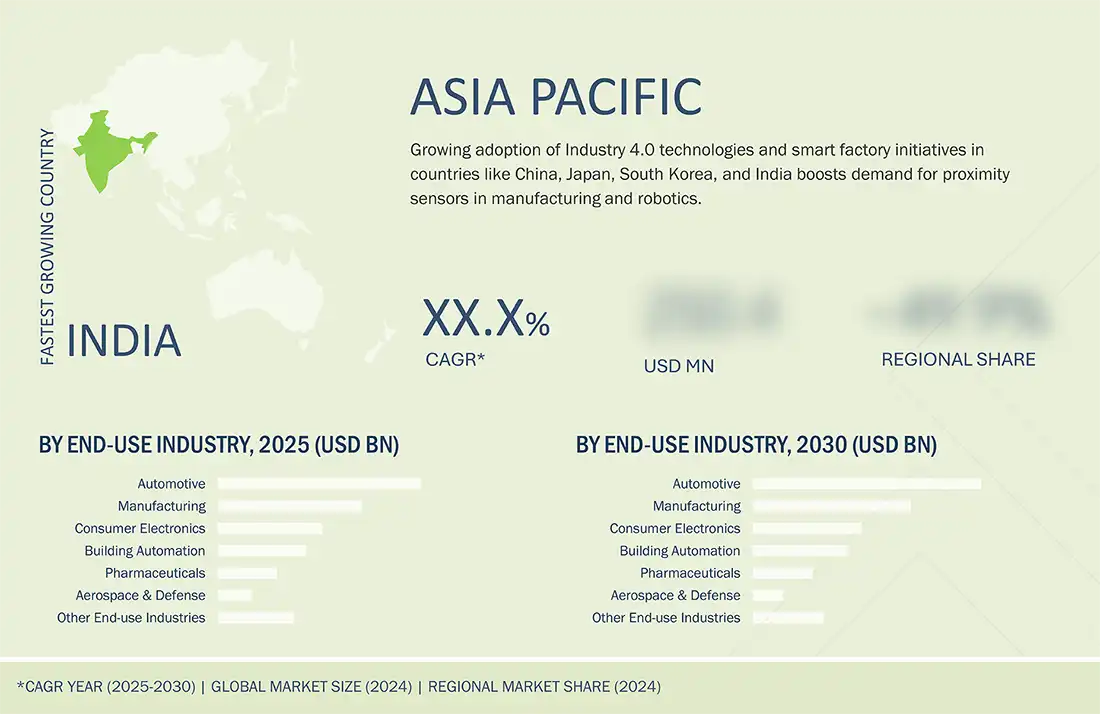
REGION
Asia Pacific is expected to be the fastest-growing region in the global proximity sensors market during the forecast period
During the forecast period, the Asia Pacific is expected to witness the highest CAGR in the proximity sensor industry, driven by rapid industrialization and expanding manufacturing activities in countries such as China, Japan, South Korea, and India. The region's strong automotive production base and growing adoption of factory automation are fueling sensor demand. Additionally, the rise of consumer electronics manufacturing and increasing investments in IoT and smart infrastructure projects are boosting market growth. Supportive government initiatives for digitalization and smart city development further strengthen the region's prospects.
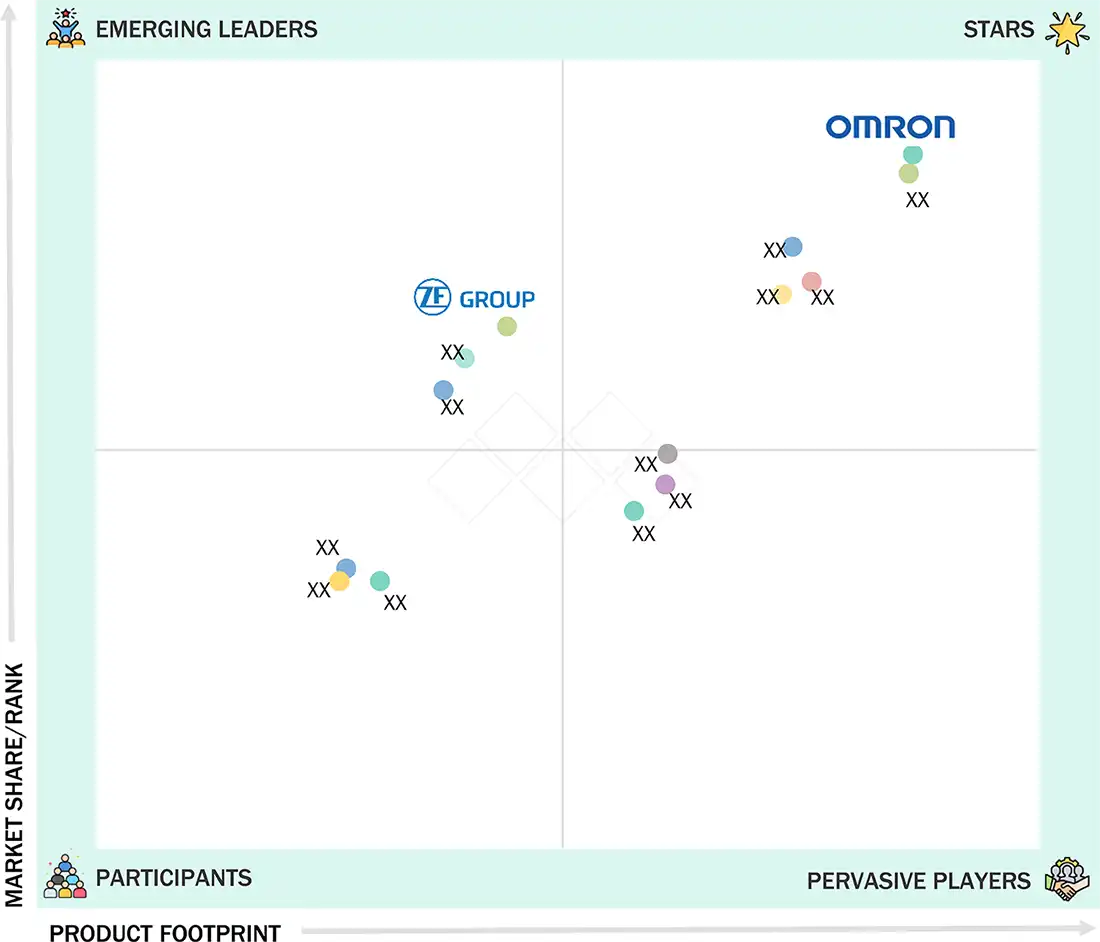
Proximity Sensor Market: COMPANY EVALUATION MATRIX
OMRON Corporation (Star) leads with an established product portfolio, strong market presence, and a proximity sensor market matrix distribution network. ZF Friedrichshafen AG (Emerging Leader) is steadily gaining traction with innovative sensor solutions and is focused on investing in R&D to enhance product portfolios. While OMRON Corporation has scale and an established customer base, ZF Friedrichshafen AG demonstrates solid growth potential to advance toward the leaders' quadrant.
Source: Secondary Research, Interviews with Experts, MarketsandMarkets Analysis
KEY MARKET PLAYERS
WHAT IS IN IT FOR YOU: Proximity Sensor Market REPORT CONTENT GUIDE
DELIVERED CUSTOMIZATIONS
We have successfully delivered the following deep-dive customizations:
| CLIENT REQUEST | CUSTOMIZATION DELIVERED | VALUE ADDS |
|---|---|---|
| Asia Pacific-based country-level market sizing & forecast | Provided detailed revenue estimates for proximity sensors across major Asia Pacific countries | Allowed to identify high-growth geographies and allocate resources effectively |
RECENT DEVELOPMENTS
- April 2024: : Rockwell Automation (US) announced the establishment of a new 98,000-square-foot manufacturing facility in Chennai, India, to enhance supply chain resilience in the Asia Pacific. The move reflects its commitment to leveraging India's growing economy and maximizing operational efficiency at its existing industrial park location.
- April 2024: : Delta Electronics, Inc. (Taiwan) celebrated its 9th consecutive recognition as ENERGY STAR Partner of the Year and its 7th Sustained Excellence award. These honors highlight Delta's dedication to energy conservation, demonstrated by saving 29 million kilowatt hours for US customers in 2023 through its advanced DC brushless motor ventilation fans.
- February 2024: : SICK AG (Germany)introduced the W10 photoelectric proximity sensor, featuring a Class 1 laser light source and intuitive touchscreen operation. It offers selectable operating modes, stainless steel housing with an IP69K rating, and IO-Link functionality. With four variants based on operating distances and mounting options, the W10 simplifies automation tasks, ensuring precise detection and high repeatability across diverse applications.
- January 2024: : STMicroelectronics (Switzerland) and Mobile Physics (Israel), which provides real-time environment monitoring that enables users to understand their exposure to various conditions and influences their health decisions, partnered to create EnviroMeter, the world's first accurate personal air quality monitor and smartphone smoke detector. Utilizing ST's multizone ranging sensors, the solution measures air particulates with high accuracy, operates continuously with minimal battery impact, and enhances health and fire safety.
- November 2023: : Rockwell Automation (US) finalized the acquisition of Verve Industrial (US) Protection, a turnkey solutions provider leveraging the industry's only OT/ICS endpoint security platform, enhancing its cybersecurity capabilities with Verve's asset inventory and vulnerability management solutions. This move aims to bolster Rockwell's ability to safeguard customer operations, reinforcing its commitment to cybersecurity in industrial automation and digital transformation.
Table of Contents
 Exclusive indicates content/data unique to MarketsandMarkets and not available with any competitors.
Methodology
The study involved major activities in estimating the current size of the proximity sensors market. Exhaustive secondary research was done to collect information on proximity sensors. The next step was to validate these findings, assumptions, and sizing with industry experts across the value chain using primary research. Different approaches, such as top-down and bottom-up, were employed to estimate the total market size. After that, the market breakup and data triangulation procedures were used to estimate the market size of the segments and subsegments of the proximity sensors.
Secondary Research
In the secondary research process, various secondary sources were used to identify and collect information for this study. These include annual reports, press releases, and investor presentations of companies, white papers, certified publications, and articles from recognized associations and government publishing sources. Research reports from a few consortia and councils were also consulted to structure qualitative content.
Secondary sources included corporate filings (annual reports, investor presentations, and financial statements); trade, business, and professional associations; white papers; robotics journals and certified publications; articles by recognized authors; gold-standard and silver-standard websites; directories; and databases. Data was also collected from secondary sources, such as the Association for Advancing Automation (A3), the International Electrotechnical Commission (IEC), and the International Organization of Motor Vehicle Manufacturers (OICA).
Secondary research has been mainly used to obtain important information about the industry's value chain, the market's monetary chain, the overall pool of key players, market classification and segmentation according to industry trends to the bottom-most level, regional markets, and key developments from market- and technology-oriented perspectives.
Primary Research
Primary research was conducted to identify segmentation types, industry trends, and key players in the market and analyze the competitive landscape; key market dynamics, such as drivers, restraints, challenges, and opportunities; industry trends; and key player strategies. In the complete market engineering process, top-down and bottom-up approaches were extensively used, along with several data triangulation methods, to estimate and forecast the market sizes, as well as their segments and sub-segments, as listed in this report. Extensive qualitative and quantitative analysis was conducted on the complete market engineering process to list the key information and insights throughout the report.
Extensive primary research was conducted after understanding and analyzing the proximity sensor market scenario through secondary research. Several primary interviews were conducted with key opinion leaders from demand- and supply-side vendors across four major regions—North America, Europe, Asia Pacific, and RoW. Approximately 30% of the primary interviews were conducted with the demand side and 70% with the supply side. Primary data was collected through questionnaires, emails, and telephonic interviews. Various departments within organizations, such as sales, operations, and administration, were contacted to provide a holistic viewpoint in the report.

Notes: Other designations include sales & marketing executives, and researchers
Note: The three tiers of companies are based on their total revenue as of 2024: Tier 1 - equal to or more than USD 1,000 million; Tier 2 - between USD 500 million and USD 1,000 million; and Tier 3 - less than or equal to USD 500 million. Other designations include managers and academicians.
To know about the assumptions considered for the study, download the pdf brochure
Market Size Estimation
Both top-down and bottom-up approaches were used to estimate and validate the total size of the actuators market. These methods were also used extensively to estimate the size of various subsegments in the market. The research methodology used to estimate the market size includes the following:
Approach to arrive at market size using bottom-up analysis (demand side)
- Entities in the proximity sensor value chain influencing the entire proximity sensor industry were identified.
- All key companies and related product manufacturers for implementing proximity sensors were analyzed.
- Trends regarding the use of proximity sensors in different end-use industries, including aerospace & defense, automotive, pharmaceuticals, manufacturing, building automation, consumer electronics, and others, were analyzed.
- Ongoing and upcoming developments, such as investments, R&D activities, product launches, collaborations, and partnerships, in the market were tracked; the market was forecast based on these developments and other critical parameters.
- Multiple discussions were conducted with key opinion leaders to understand the types of contracts made, along with the identification of proximity sensors sold by companies in the proximity sensor market; this was expected to help analyze the breakup of the scope of work carried out by each key company operating in the proximity sensor market.
- Market estimates were arrived at by analyzing revenues generated by these companies based on their locations (countries) and combining this data to get the market estimate in terms of region.
- At every level, estimates were verified and cross-checked through discussions with key opinion leaders, including chief executive officers (CEO), directors, and operations managers, and finally, with domain experts at MarketsandMarkets.
- This process also included the study of various paid and unpaid sources of information, such as annual reports, press releases, white papers, and databases.
Top-down approach
In the top-down approach, the overall size of the proximity sensor market was used to estimate the size of the individual markets (mentioned in the market segmentation) through percentage splits obtained from secondary and primary research. To calculate the size of the specific market segments, the size of the most appropriate parent market was used to implement the top-down approach. The bottom-up approach was also implemented for the data extracted from the secondary research to validate the size of various segments of the proximity sensor market.
Each company's share in the market was estimated to verify the revenue shares used earlier in the bottom-up approach. With the data triangulation procedure and data validation through primaries, the sizes of the parent market and the individual markets' sizes were determined and confirmed. The data triangulation procedure used for this study has been explained in the next section.
Approach to arrive at market size using top-down analysis (supply side)
- The initial focus is on top-line investments in the proximity sensor ecosystem.
- The market size was calculated based on the revenue generated by players through the sales of proximity sensors.
- Further splits were obtained based on R&D activities and key developments in key market areas.
- Splits were derived based on proximity sensors in diverse end-use industries.
- Information related to revenue generated by players through their offerings was compiled and analyzed.
- Multiple on-field discussions were conducted with key opinion leaders across major companies involved in developing proximity sensors.
- The geographic split was estimated with the help of secondary sources based on various factors, such as the number of players in a specific country/region and systems used in various end-use industries, such as aerospace & defense, automotive, pharmaceuticals, manufacturing, building automation, consumer electronics, and others.
Proximity Sensor Market : Top-Down and Bottom-Up Approach

Data Triangulation
After arriving at the overall market size from the market size estimation process explained above, the total market was split into several segments and subsegments. Where applicable, data triangulation and market breakdown procedures were employed to complete the overall market engineering process and arrive at the exact statistics for all segments and sub-segments. The data was triangulated by studying various factors and trends from the demand and supply sides. The market size was also validated using top-down and bottom-up approaches.
Market Definition
The proximity sensor market encompasses devices designed to detect the presence or absence of objects, typically without physical contact. These sensors utilize various technologies, such as inductive, capacitive, magnetic, optical/photoelectric, and ultrasonic, to detect nearby objects or materials.
The scope of the proximity sensor market is expanding rapidly due to increasing automation across industries and the growing demand for smart technologies. In automotive applications, proximity sensors are crucial in ADAS and autonomous vehicles, enhancing safety and navigation capabilities. In industrial automation, these sensors optimize production processes by ensuring precise object detection, reducing downtime, and improving efficiency. Moreover, advancements in sensor technologies and the integration of artificial intelligence and IoT drive innovations that enhance sensor accuracy, reliability, and functionality, fueling market growth. As industries continue embracing digital transformation and smart manufacturing initiatives, the proximity sensor market is poised to expand globally.
Key Stakeholders
- Proximity sensor manufacturers
- Raw material vendors
- Electronic design automation (EDA) and design tool vendors
- Fabrication, wafer, and foundry process equipment vendors
- Integrated device manufacturers
- Fabless vendors
- Original equipment manufacturers: electronics modules, devices, equipment, instruments, and system manufacturers
- Technology investors
- Governments and financial institutions
- Analysts and strategic business planners
- Existing and prospective end users
- Venture capitalists, private equity firms, and startup companies
- Distributors and traders
- Research institutes and organizations
Report Objectives
- To define, describe, segment, and forecast the proximity sensor market size, by technology, product type, range, output, and end-use industry, in terms of value
- To estimate the global proximity sensor market, by technology, in terms of volume
- To forecast the market size of four key regions, namely, North America, Europe, Asia Pacific, and the RoW, in terms of value
- To present detailed information regarding the major factors influencing the growth of the market (drivers, restraints, opportunities, and challenges)
- To provide an ecosystem analysis, case study analysis, patent analysis, technology analysis, ASP analysis, Porter's Five Forces analysis, and regulations pertaining to the market
- To offer a comprehensive overview of the value chain of the proximity sensor market ecosystem
- To critically assess micromarkets1 with respect to individual growth trends, prospects, and contributions to the total market
- To strategically profile the key players and comprehensively analyze their market shares and core competencies2
- To assess the opportunities in the market for stakeholders and describe the competitive landscape of the market
- To analyze competitive developments in the market, such as collaborations, partnerships, product developments, and R&D
- To evaluate the impact of AI/GenAI, the 2025 US tariff, and the macroeconomic outlook for each region in the proximity sensors market
Note: Micromarkets are defined as the further segments and subsegments of the proximity sensor market included in the report.
Available Customizations
With the market data given, MarketsandMarkets offers customizations according to the company's specific needs. The following customization options are available for the report:
Company Information
- Detailed analysis and profiling of additional market players (up to 7)
Key Questions Addressed by the Report
What is the current size of the Proximity Sensor Market?
The global Proximity Sensor Market was valued at USD 4.08 billion in 2024 and is projected to reach USD 4.28 billion in 2025.
What is the projected market size of the Proximity Sensor Market by 2030?
The market is expected to reach USD 5.97 billion by 2030, driven by increasing adoption of automation, Industry 4.0 technologies, and smart sensing applications.
What is the CAGR of the Proximity Sensor Market during the forecast period?
The Proximity Sensor Market is projected to grow at a CAGR of 6.9% from 2025 to 2030.
What are the major growth drivers of the Proximity Sensor Market?
Key growth drivers include the increasing adoption of Industry 4.0 technologies, rising demand for smart home devices, growing use in consumer electronics, and expanding deployment of ADAS and vehicle safety systems.
Which technology segment holds the largest share of the Proximity Sensor Market?
The inductive proximity sensor segment holds the largest market share due to its widespread use in industrial automation and its effectiveness in detecting metallic objects with high precision.
Which end-use industry dominates the Proximity Sensor Market?
The automotive industry accounts for the largest market share, driven by increasing integration of proximity sensors in ADAS, parking assistance, collision avoidance systems, and electric vehicles.
Which output segment is expected to grow the fastest?
The digital output segment is expected to witness the highest CAGR during the forecast period due to its reliability, ease of integration, and growing use in industrial automation and robotics.
Which region is expected to grow the fastest in the Proximity Sensor Market?
Asia Pacific is projected to register the highest CAGR of 7.7% through 2030, supported by rapid industrialization, expanding automotive production, and strong consumer electronics manufacturing in China, Japan, South Korea, and India.
Who are the leading companies operating in the Proximity Sensor Market?
Major market participants include OMRON Corporation, KEYENCE Corporation, Panasonic Corporation, SICK AG, STMicroelectronics, Honeywell International Inc., Rockwell Automation, and Schneider Electric.
What opportunities are highlighted in the Proximity Sensor Market report?
Significant opportunities include sensor miniaturization, growing adoption of industrial robots, increasing applications in medical devices and smart cities, and advancements in sensing technologies for IoT-enabled systems.
Need a Tailored Report?
Customize this report to your needs
Get 10% FREE Customization
Customize This ReportPersonalize This Research
- Triangulate with your Own Data
- Get Data as per your Format and Definition
- Gain a Deeper Dive on a Specific Application, Geography, Customer or Competitor
- Any level of Personalization
Let Us Help You
- What are the Known and Unknown Adjacencies Impacting the Proximity Sensor Market
- What will your New Revenue Sources be?
- Who will be your Top Customer; what will make them switch?
- Defend your Market Share or Win Competitors
- Get a Scorecard for Target Partners

Custom Market Research Services
We Will Customise The Research For You, In Case The Report Listed Above Does Not Meet With Your Requirements
Get 10% Free CustomisationTESTIMONIALS

Tetsuya Ohhira
Business Development Manager-Technology Business
Nikon Corporation,
Leading Japanese MNC specializing in optics and imaging productswww.nikon.com
MarketsandMarkets™ response
is quick. Their attitude is flexible and positive. Analyst Insights are globally considered and
significant. Client Services quickly respond to our inquiry and demand. Their wide range of global
surveys help us make our strategic plan.
We hope Knowledge Store will be easier to search
for a report.
VP - Marketing & Business Development
Leading Provider of Process Control Solutions
We engaged with MarketsandMarkets on a study to perform an analysis and recommend a Go-To-Market strategy for metrology and process control in the semiconductor market. The study was tailored to our targets and needs with well-defined milestones. Our overall experience with the MarketsandMarkets team was very good throughout the project in all aspects including the analysis methodologies used, the quality and depth of primary and secondary data sets, the professionalism and flexibility of the team and the ability to meet the target schedule and milestones. We want to thank MarketsandMarkets team for a job well done.
Growth opportunities and latent adjacency in Proximity Sensor Market


Daniel
Apr, 2026
Does this report align with my target industries (automotive, manufacturing, consumer electronics, smart cities)?.
Brandon
Apr, 2026
Can I customize or validate the data for my internal business model?.
Julian
Mar, 2016
We'd like to receive a sample of your report as a base for a buying decision for the whole report. Some of the questions are - Is there an analysis on a country-basis in the geographic part or just on the continent-basis? - Is optic-electronic sensor technology regarded? - Would it be possible to add or company to the report? Can you please send us a sample of the report?.