
Asia Pacific Power SCADA Market (2023-2028)

The Asia Pacific Power SCADA Market was valued at $818.4 Million in 2023 and projected to reach to $1191.4 Million by 2028, representing a compound annual growth rate of 7.8%. The Asia Pacific Power SCADA market is positioned for substantial expansion, growing from $818.4 million in 2023 to $1,191.4 million by 2028.


| Market Size in | USD 26.32 MN |
| Market Forecast in | |
| CAGR | |
| Forecast Period | |
| Units Considered | Value (USD MN) |
Asia Pacific Power SCADA Market Trends and Insights
- Asia Pacific's 7.8% compound annual growth rate outpaces the global average, driven by rapid industrialization, grid modernization initiatives, and increasing demand for reliable power infrastructure across the region.
- Key markets including China, India, Japan, and Southeast Asia are investing heavily in digital transformation of their electrical grids to enhance operational efficiency and reduce downtime. Asia Pacific's dominance in manufacturing and energy consumption positions the region as a critical hub for Power SCADA adoption.
- The region's utilities are prioritizing real-time monitoring, predictive maintenance, and cybersecurity capabilities to manage aging infrastructure and accommodate renewable energy integration.
- Government policies supporting smart grid development and substantial capital investments in power generation and distribution networks are accelerating Power SCADA deployment throughout Asia Pacific. The forecast period through 2028 reflects Asia Pacific's commitment to modernizing power systems and achieving energy security objectives.
- Rising electricity demand, coupled with the need for grid stability amid renewable energy expansion, ensures sustained investment in SCADA technologies across Asia Pacific's diverse energy landscape..
Key Market Statistics
- CAGR (2023-2028) 7.8% CAGR
- Market Size, 2023 ~USD 818.4 Million
- Forecast, 2028 ~USD 1191.4 Million
- Geography Asia Pacific
Asia Pacific Power SCADA Market Overview
Market Leadership by China :
China dominates the Asia Pacific Power SCADA market with $714.9 million in 2023, representing 87% of the regional market. Massive investments in smart grid infrastructure and renewable energy integration drive sustained demand for advanced SCADA solutions across the nation's expanding power networks.
Rapid Growth Outpacing Global Average :
Asia Pacific's 7.8% CAGR significantly exceeds the global average of 7.1%, reflecting accelerated grid modernization and digital transformation initiatives. This regional momentum is fueled by increasing electricity demand, aging infrastructure replacement, and government mandates for grid reliability.
Emerging Markets Expansion :
India ($146.1M) and Japan ($150.0M) represent critical growth engines alongside established markets like South Korea ($78.6M) and Australia ($56.8M). These nations are investing heavily in smart grid technologies, renewable energy integration, and cybersecurity-enhanced SCADA systems.
Industrialization-Driven Demand :
Rapid industrialization across Asia Pacific, coupled with urbanization and rising energy consumption, creates sustained demand for reliable power infrastructure monitoring. SCADA systems are essential for managing complex, distributed power networks and ensuring grid stability in high-growth economies.
Asia Pacific Power SCADA Market Dynamics
- This 7.8% CAGR reflects the region's commitment to grid modernization, renewable energy adoption, and digital infrastructure upgrades.
- China's dominance will persist, while emerging markets in India and Southeast Asia present significant growth opportunities. Key drivers include government initiatives for smart grid deployment, increasing renewable energy integration, cybersecurity requirements, and the need to replace legacy systems.
- Investment in IoT-enabled SCADA platforms and cloud-based monitoring solutions will accelerate adoption.
- Regional players and global vendors are expanding operations to capture market share, particularly in tier-2 and tier-3 cities experiencing rapid electrification and industrial growth..
Market Ecosystem
Related Ecosystem
Power Infrastructure
- Geographical Information System (GIS)
- Cogeneration
- Battery Electric Vehicle (BEV)
- Cellular Network
- Fuel Cell
- ABB India Limited
- Siemens ag
- SCHNEIDER ELECTRIC SE
- General Electric Company
- Eaton Corporation plc
Smart Energy And Digital Solutions
- Cellular Network
- Analytics Software
- Geographical Information System (GIS)
- Meter Data Management (MDM)
- Smart Meters
- Siemens ag
- SCHNEIDER ELECTRIC SE
- ABB India Limited
- General Electric Company
- Eaton Corporation plc
Industrial Iot
- Sensors
- Pressure Sensors
- Flow Sensors
- Gas Sensors
- Image Sensors
- Siemens ag
- ABB India Limited
- HONEYWELL INTERNATIONAL INC.
- Emerson Electric Co.
- SCHNEIDER ELECTRIC SE
Key Takeaways
- Asia Pacific Power SCADA market grows from $818.4M (2023) to $1,191.4M (2028) at 7.8% CAGR, outpacing global growth rates.
- Grid modernization and smart grid initiatives across Asia Pacific are primary drivers of Power SCADA technology adoption and investment.
- China, India, Japan, and Southeast Asia lead regional demand through government-backed infrastructure projects and renewable energy integration.
- Cybersecurity, real-time monitoring, and predictive maintenance capabilities are critical competitive differentiators in Asia Pacific's Power SCADA market.
Power SCADA Market Report Scope
| Report Metric | Details |
|---|---|
| Base Year | 2023 |
| Fastest Growing Segment | OTHER END-USER INDUSTRIES (End-User Industry) |
| Forecast Period | 2023-2028 |
| Growth Rate | CAGR of 7.1% from 2023 to 2028 |
| Largest Segment | HARDWARE (Architecture) |
| Market Size Base Year (Billions) | ~USD 2.06 (2023) |
| Revenue Forecast (Billions) | ~USD 2.9 (2028) |
| Segments Covered | Architecture, End-User Industry, Component |
Asia Pacific Power SCADA Market Report Segmentation
3 segment dimensions are covered across the global market.
By Architecture
- Hardware
- Services
- Software
By End-User Industry
- Chemicals
- Metals & Mining
- Oil & Gas
- Other End-User Industries
- Transportation
- Water & Wastewater Treatment
By Component
- Communication Systems
- Human-Machine Interfaces
- Human-Machine Interfaces (Hmis)
- Master Terminal Units
- Master Terminal Units (Mtus)
- Other Components
- Programmable Logic Controllers
- Programmable Logic Controllers (Plcs)
- Protection Relays (Ieds)
- Remote Terminal Units
Target Audience
- Power Utility Companies : Utilities across Asia Pacific require market intelligence to plan SCADA system upgrades, evaluate vendor solutions, and optimize grid operations. This report provides competitive benchmarking and technology trend analysis essential for infrastructure investment decisions.
- SCADA Solution Vendors : Software and hardware providers need detailed regional market data to identify growth opportunities, assess competitive positioning, and develop localized strategies. Country-level insights enable targeted sales and partnership development across Asia Pacific.
- Government & Regulatory Bodies : Energy ministries and grid operators use market research to inform smart grid policies, infrastructure investment priorities, and technology standards. Regional market analysis supports evidence-based decision-making for grid modernization initiatives.
- Investment & Private Equity Firms : Investors evaluating opportunities in Asia Pacific's energy sector require comprehensive market sizing, growth forecasts, and competitive dynamics. This report enables informed investment decisions in SCADA vendors, utilities, and infrastructure projects.
- System Integrators & Consultants : Integration firms and consulting companies need regional market insights to advise clients on SCADA implementations, technology selection, and digital transformation roadmaps. Country-specific data supports customized solutions and strategic recommendations.
Countries within Asia Pacific - compare and drill down
| Country | 2025 size (native) |
|---|---|
| China | USD 714.9 Million |
| Japan | USD 150 Million |
| India | USD 146.1 Million |
| South Korea | USD 78.6 Million |
| Australia | USD 56.8 Million |
| Rest Of Asia Pacific | USD 45 Million |
Country market size visualization
Reasons to Buy this Report
- Regional Market Dominance Insights : Understand China's 87% market share and identify growth opportunities in emerging markets like India and Japan. Detailed analysis of country-specific SCADA adoption rates and competitive landscapes enables targeted market entry strategies.
- Growth Rate Advantage Analysis : Asia Pacific's 7.8% CAGR outpaces global averages, signaling superior investment returns. Comprehensive forecasting through 2028 helps stakeholders allocate resources to the fastest-growing regional segments and capitalize on industrialization trends.
- Infrastructure Modernization Opportunities : Detailed insights into grid modernization initiatives, smart grid deployments, and renewable energy integration projects across the region. Identify procurement pipelines, government contracts, and private sector investments driving SCADA system demand.
- Competitive Positioning Strategy : Benchmark your offerings against regional and global competitors. Understand market gaps, customer preferences, and technology adoption patterns specific to Asia Pacific to refine product development and go-to-market strategies.
- Risk Mitigation & Regulatory Compliance : Navigate country-specific regulations, cybersecurity requirements, and grid standards across diverse Asia Pacific markets. Gain clarity on compliance frameworks and technical specifications essential for successful market participation.
Frequently asked questions
What is the current size of the Power SCADA market in Asia Pacific?
The Asia Pacific Power SCADA market was valued at $818.4 million in 2023 and is expected to grow to $1,191.4 million by 2028.
What is the growth rate of the Power SCADA market in Asia Pacific?
Asia Pacific's Power SCADA market is growing at a compound annual growth rate (CAGR) of 7.8% from 2023 to 2028.
Which countries are driving Power SCADA adoption in Asia Pacific?
China, India, Japan, and Southeast Asian nations are leading Power SCADA adoption through government-backed smart grid initiatives and infrastructure modernization programs.
What factors are accelerating Power SCADA growth in Asia Pacific?
Key drivers include rapid industrialization, grid modernization policies, renewable energy integration, cybersecurity requirements, and increasing electricity demand across Asia Pacific.
How does Asia Pacific's Power SCADA growth compare to global trends?
Asia Pacific's 7.8% CAGR exceeds the global average of 7.1%, reflecting the region's accelerated investment in power infrastructure and digital grid transformation.
RESEARCH METHODOLOGY
This study extensively investigated the current power SCADA market size, initiating with a thorough secondary research phase dedicated to gathering data on the market, related markets, and the broader industry landscape. The collected information, along with assumptions and calculated market sizes, underwent rigorous validation in the subsequent primary research phase, which involved consultations with industry experts spanning the entire value chain. The assessment of the overall market size was tailored to each country, followed by a detailed market dissection where the data was cross-referenced to estimate the sizes of various segments and sub-segments. This two-phased approach, incorporating both secondary and primary research methodologies, enhances the reliability and accuracy of the study's findings.
Secondary Research
Throughout this research study, a wide range of secondary sources was utilized, incorporating directories, databases, and reputable references such as Hoover's, Bloomberg BusinessWeek, Factiva, World Bank, the US Department of Energy (DOE), and the International Energy Agency (IEA). These sources played a crucial role in gathering valuable data necessary for conducting a thorough analysis of the global power SCADA market. Covering technical, market-oriented, and commercial aspects, these secondary sources significantly contributed to the study's depth and breadth. Additional secondary sources encompassed annual reports, press releases, investor presentations, whitepapers, authoritative publications, articles by esteemed experts, information from industry associations, trade directories, and various database resources. The diverse range of secondary sources employed ensures a robust and well-informed foundation for the research study.
Primary Research
The power SCADA market involves various stakeholders throughout its supply chain, including component manufacturers, product manufacturers/assemblers, service providers, distributors, and end-user industries. The primary driver of market demand originates from industrial end-users, while the increasing needs of transmission and distribution utilities also contribute significantly to market growth. On the supply side, a noticeable trend is the heightened demand for contracts from the industrial sector, accompanied by a notable prevalence of mergers and acquisitions among major industry players.
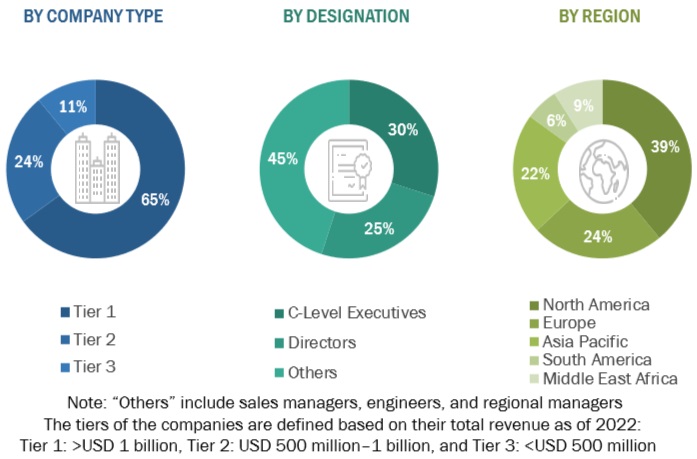
To gain a comprehensive understanding of the market, both qualitatively and quantitatively, a diverse set of primary sources from both the supply and demand sides underwent interviews. The breakdown below outlines the primary respondents who played a crucial role in providing insights for the research study.
To know about the assumptions considered for the study, download the pdf brochure
Market Size Estimation
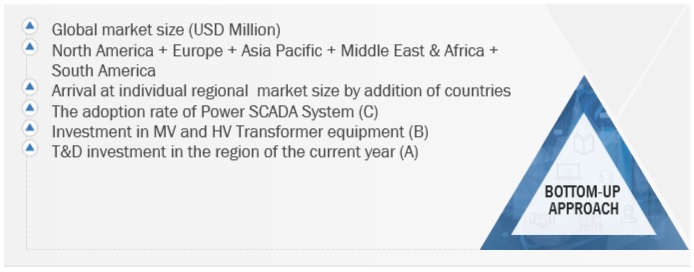
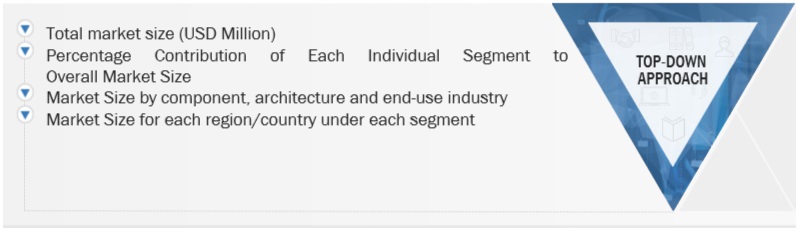
Top-down and bottom-up approaches are combined in the research strategy to evaluate the global power SCADA market size and its associated submarkets. The sizes of the market's several subsegments were ascertained by carefully applying these techniques. The following essential phases comprise the research process.
- This methodology has examined production data for all types of power SCADA systems at both the national and regional levels.
- A comprehensive understanding of the global market environment for various power SCADA system types has been achieved through extensive secondary and primary research.
- Several primary interviews with notable power SCADA system development specialists, including important OEMs and Tier I suppliers, have been undertaken.
- When evaluating and projecting the market size, qualitative factors such as market drivers, restraints, opportunities, and challenges have been taken into account.
Global Power SCADA Market Size: Bottom-Up Approach
To speak to our analyst for a discussion on the above findings, click Speak to Analyst
Global Power SCADA Market Size: Top-Down Approach
Data Triangulation
The procedure for determining the overall market size involved the previously outlined methodologies, which included segmenting the market into various segments and subsegments. To conclude the comprehensive market analysis and obtain accurate statistics for each market segment and subsegment, the implementation of data triangulation and market segmentation techniques was deemed essential. Data triangulation entailed a thorough examination of various factors and trends from both the demand and supply perspectives within the ecosystem of the market.
Market Definition
The Power SCADA (Supervisory Control and Data Acquisition) market refers to the industry involved in providing advanced control and monitoring solutions for power systems. This technology encompasses a comprehensive suite of hardware and software components that enable real-time supervision and data acquisition across power generation, transmission, and distribution processes. Power SCADA systems play a pivotal role in enhancing operational efficiency, reliability, and automation within the power sector, utilizing a centralized platform to monitor diverse elements of the infrastructure. These systems are crucial for managing the complexities of modern power networks, facilitating the integration of renewable energy sources, and supporting the overall digitization of power infrastructure. The market encompasses various stakeholders, including component manufacturers, product assemblers, service providers, distributors, and end-users in industries such as utilities and manufacturing, contributing to the growth and evolution of the Power SCADA market.
Key Stakeholders
- Government Utility Providers
- Independent Power Producers
- SCADA System Developers
- Power equipment and garden tool manufacturers
- Consulting companies in the energy & power sector
- Distribution utilities
- Government and research organizations
- Organizations, forums, and associations
- Raw material suppliers
- State and national regulatory authorities
- SCADA System Developers, distributors, and suppliers
- SCADA System original equipment manufacturers (OEMs)
Objectives of the Study
- Based on variables like component, architecture, and end-use industry, the power SCADA system market will be defined, characterised, categorised, and forecasted.
- To project market sizes for the major countries in each of these five regions, as well as those for North America, South America, Europe, Asia Pacific, the Middle East, and Africa.
- To provide in-depth analyses of the elements driving market dynamics, industry-specific opportunities, constraints, and difficulties.
- To systematically assess the market share, growth trends, and prospects of each subsegment.
- To evaluate the competitive landscape for leaders in the industry and the market prospects for interested parties.
- To create strategic profiles of the top players by closely examining their market shares and essential strengths.
- To monitor and assess competitive changes in the power SCADA market, including as joint ventures, acquisitions, contracts, partnerships, agreements, sales contracts, new product launches, expansions, and investments.
- The market for power SCADA is evaluated in this report.
Available Customization
With the given market data, MarketsandMarkets offers customizations based on the company’s specific needs. The following customization options are available for the report:
Product Analysis
- Product Matrix, which provides a detailed comparison of the product portfolio of each company
Company Information
- Detailed analyses and profiling of additional market players (up to 5)
Get the Full Power SCADA Market Report
Full forecast, segment splits, and company analysis for all Power SCADA Market.
- China Power SCADA Market
- Japan Power SCADA Market
- India Power SCADA Market
- South Korea Power SCADA Market
- Australia Power SCADA Market
- Canada Power SCADA Market
- Mexico Power SCADA Market
- US Power SCADA Market
- Germany Power SCADA Market
- France Power SCADA Market
- UK Power SCADA Market
- Russia Power SCADA Market
- Italy Power SCADA Market
- Saudi Arabia Power SCADA Market
- UAE Power SCADA Market
- South Africa Power SCADA Market
- Brazil Power SCADA Market
- Argentina Power SCADA Market
- Rest Of Europe Power SCADA Market
- Rest Of Asia Pacific Power SCADA Market
- Rest Of South America Power SCADA Market
Need a Tailored Report?
Customize this report to your needs
Get 10% FREE Customization
Customize This Report
