
Asia Pacific Quantum Computing Market (2025-2030)

The Asia Pacific Quantum Computing Market was valued at $1355.3 Million in 2025 and projected to reach to $9039.9 Million by 2030, representing a compound annual growth rate of 46.2%. Asia Pacific's quantum computing market is poised for transformative growth, expanding from $1,355.3 million in 2025 to $9,039.9 million by 2030 at a robust 46.2% CAGR.


| Market Size in | USD 26.32 MN |
| Market Forecast in | |
| CAGR | |
| Forecast Period | |
| Units Considered | Value (USD MN) |
Asia Pacific Quantum Computing Market Trends and Insights
- Asia Pacific's quantum computing sector is driven by substantial investments from governments and technology leaders across China, Japan, South Korea, and India, positioning the region as a critical hub for quantum innovation.
- The region's rapid expansion reflects strong demand for quantum solutions in finance, pharmaceuticals, and materials science, supported by robust semiconductor manufacturing capabilities and a growing talent pool in quantum research. Asia Pacific's 46.2% compound annual growth rate significantly outpaces global trends, underscoring the region's strategic importance in the quantum computing landscape.
- Between 2025 and 2030, Asia Pacific is expected to capture increasing market share as enterprises and research institutions accelerate quantum technology adoption.
- The region's competitive advantages-including cost-effective R&D, government support programs, and established tech ecosystems-position Asia Pacific as a primary driver of global quantum computing advancement during the forecast period..
Key Market Statistics
- CAGR (2025-2030) 46.2% CAGR
- Market Size, 2025 ~USD 1355.3 Million
- Forecast, 2030 ~USD 9039.9 Million
- Geography Asia Pacific
Asia Pacific Quantum Computing Market Overview
China's Market Dominance :
China leads Asia Pacific quantum computing with a market size of $3,209.1 million in 2025, driven by government-backed quantum initiatives and substantial R&D investments from tech giants positioning the nation as a global quantum leader.
Japan's Advanced Technology Hub :
Japan commands the second-largest market at $1,898.4 million, leveraging its semiconductor expertise and established quantum research infrastructure to drive innovation across enterprise and academic sectors.
India's Emerging Quantum Ecosystem :
India's quantum computing market reaches $922.1 million, supported by government quantum mission initiatives, growing startup ecosystem, and increasing collaboration between academic institutions and technology companies.
South Korea's Strategic Growth :
South Korea's market valued at $885.9 million reflects strong government support, semiconductor industry synergies, and investments from major conglomerates in quantum technology development and commercialization.
Asia Pacific Quantum Computing Market Dynamics
- The region's dominance is underpinned by strategic government initiatives, particularly in China, Japan, and India, combined with substantial private sector investments from technology leaders.
- These factors position Asia Pacific as the epicenter of quantum innovation globally. The region's competitive advantage stems from its semiconductor manufacturing expertise, large talent pool, and early-stage quantum application development across finance, pharmaceuticals, and materials science.
- Continued government funding, university-industry partnerships, and the emergence of quantum startups will accelerate commercialization.
- By 2030, Asia Pacific is expected to capture a significant share of global quantum computing value, establishing itself as the primary driver of quantum technology advancement and deployment..
Market Ecosystem
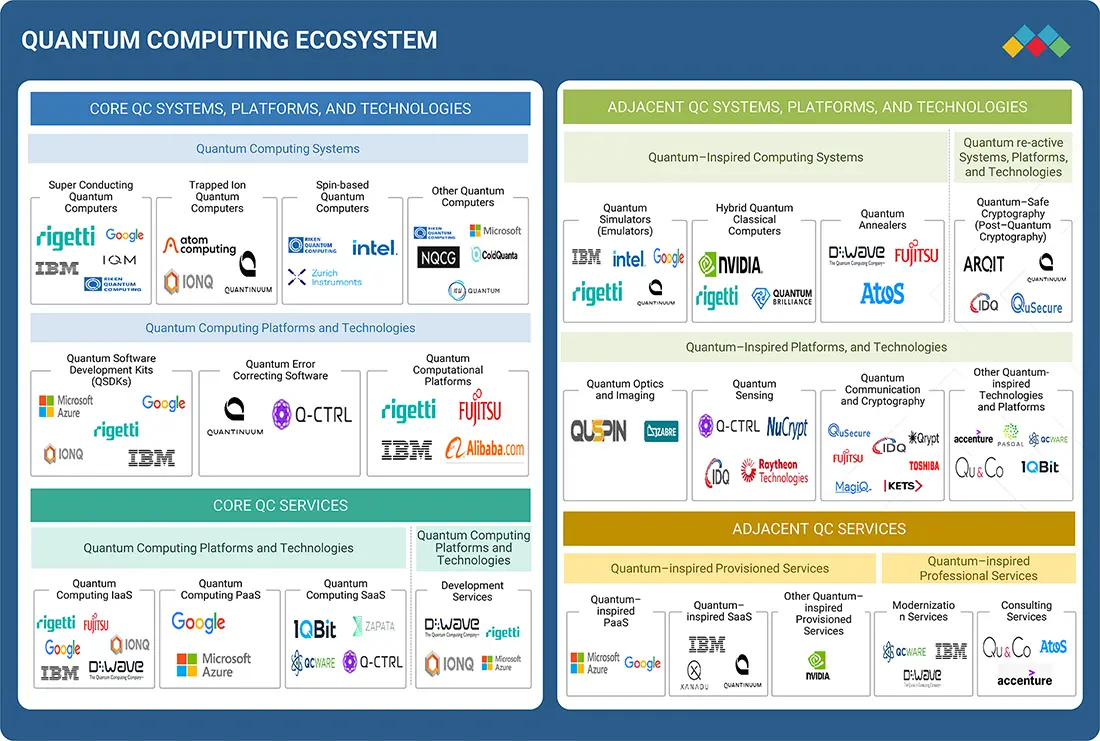
Quantum Computing Market: COMMERCIAL USE CASES ACROSS INDUSTRIES
| COMPANY | USE CASE DESCRIPTION | BENEFITS |
|---|---|---|
 |
IBM and Daimler AG are collaborating to apply quantum computing for optimizing chemical reactions and reactor design. The partnership aims to improve reaction efficiency, reduce energy use, and enhance reactor performance. This effort supports advanced material development for the automotive industry. | While specific outcomes of this collaboration may not be publicly available due to the early stage of quantum computing, it highlights how leading companies are actively exploring quantum computing for reactor design and optimization in the chemical industry. |
 |
BASF is developing new materials across industries using quantum techniques combined with classical computing to enhance cheminformatics and machine learning models predicting molecular properties. | Collaborating with Zapata, BASF benchmarks quantum-enhanced machine learning against classical methods using the Orquestra platform, focusing on feature selection and classification in supervised learning. |
Logos and trademarks shown above are the property of their respective owners. Their use here is for informational and illustrative purposes only.
Related Ecosystem
Automotive Systems
- Light Commercial Vehicles (LCVs)
- Battery Electric Vehicle (BEV)
- Hybrid Electric Vehicle (HEV)
- Agricultural Tractors
- Fuel Cell Electric Vehicle (FCEV)
- BOSCH LIMITED
- DENSO Corporation
- ZF FRIEDRICHSHAFEN AG
- Continental ag
- GORKOVSKY AVTOMOBILNY ZAVOD
Cloud Computing
- Software as A Service (SaaS)
- Natural Language Processing (NLP)
- Platform as A Service (PaaS)
- Machine Learning
- Supply Chain Management
- International Business Machines Corporation
- MICROSOFT CORPORATION
- Oracle Corporation
- Amazon.com, Inc.
Information System And Analytics
- Machine Learning
- Natural Language Processing (NLP)
- Sensors
- Software as A Service (SaaS)
- Data Loss Prevention (DLP)
- International Business Machines Corporation
- MICROSOFT CORPORATION
- Amazon.com, Inc.
- Oracle Corporation
Key Takeaways
- Asia Pacific quantum computing market grows from $1,355.3M (2025) to $9,039.9M (2030) at 46.2% CAGR, outpacing global growth rates.
- Asia Pacific's quantum sector benefits from government initiatives, private investment, and strong semiconductor manufacturing infrastructure across major economies.
- Key Asia Pacific markets including China, Japan, South Korea, and India are establishing quantum research centers and commercialization hubs.
- Asia Pacific enterprises in finance, pharmaceuticals, and materials science are accelerating quantum technology adoption and pilot programs.
Quantum Computing Market Report Scope
| Report Metric | Details |
|---|---|
| Base Year | 2025 |
| Fastest Growing Segment | TRAPPED ION (Technology) |
| Forecast Period | 2025-2030 |
| Growth Rate | CAGR of 41.8% from 2025 to 2030 |
| Largest Segment | CLOUD-BASED (Deployment) |
| Market Size Base Year (Billions) | ~USD 3.52 (2025) |
| Revenue Forecast (Billions) | ~USD 20.2 (2030) |
| Segments Covered | Offering, System, Technology, Type, Deployment, End-Use Industry, Application, Service |
Asia Pacific Quantum Computing Market Report Segmentation
8 segment dimensions are covered across the global market.
By Offering
- Application Software
- Services
- Systems
By System
- Systems
By Technology
- Other Technologies
- Photonic Networks
- Quantum Annealing
- Superconducting Qubits
- Trapped Ion
By Type
- Consulting Services
- Quantum Computing As A Service (Qcaas)
By Deployment
- Cloud-Based
- On-Premises
By End-Use Industry
- Academic
- Academic Research
- Banking & Finance
- Chemicals
- Energy & Power
- Government
- Government Research
- Healthcare & Pharmaceuticals
- Space & Defense
- Transportation & Logistics
By Application
- Machine Learning
- Optimization
- Other Applications
- Simulation
By Service
- Consulting Service
- Qcaas
- Quantum Computing As A Service (Qcaas)
Target Audience
- Quantum Technology Vendors : Quantum hardware and software companies need Asia Pacific market data to identify expansion opportunities, assess competitive threats, and develop region-specific go-to-market strategies in the world's fastest-growing quantum market.
- Enterprise Technology Leaders : Large corporations and tech conglomerates require insights into quantum computing adoption trends, use cases, and investment patterns across Asia Pacific to guide quantum strategy and partnership decisions.
- Government & Policy Makers : Government agencies and policy bodies need comprehensive market intelligence on quantum initiatives, funding mechanisms, and competitive positioning to inform national quantum strategies and regulatory frameworks.
- Investment & Private Equity Firms : Investors and PE firms require detailed market forecasts, funding trends, and growth drivers across Asia Pacific quantum companies to identify investment opportunities and assess portfolio company potential.
- Academic & Research Institutions : Universities and research centers need market data on quantum commercialization, industry partnerships, and talent demand across Asia Pacific to align research programs with market opportunities.
Countries within Asia Pacific - compare and drill down
| Country | 2025 size (native) |
|---|---|
| China | USD 3209.1 Million |
| Japan | USD 1898.4 Million |
| South Korea | USD 885.9 Million |
| India | USD 922.1 Million |
| Australia | USD 623.8 Million |
| Indonesia | USD 262.2 Million |
| Thailand | USD 253.1 Million |
| Vietnam | USD 185.3 Million |
| Malaysia | USD 253.1 Million |
| Rest Of Asia Pacific | USD 546.9 Million |
Country market size visualization
Reasons to Buy this Report
- Country-Level Market Insights : Access detailed market sizing and growth projections for China, Japan, South Korea, India, Australia, and other Asia Pacific nations to identify high-potential markets and regional investment opportunities.
- Competitive Landscape Analysis : Understand the competitive positioning of regional quantum players, government initiatives, and technology leaders across Asia Pacific to benchmark strategies and identify partnership opportunities.
- Investment & Funding Trends : Gain insights into government quantum missions, venture capital flows, and corporate R&D spending across Asia Pacific to identify emerging funding patterns and investment hotspots.
- Application & Use Case Mapping : Discover sector-specific quantum computing adoption across finance, pharmaceuticals, materials science, and logistics in Asia Pacific to prioritize market entry and product development strategies.
- Strategic Growth Forecasts : Leverage 5-year forecasts and 46.2% CAGR projections to develop long-term business strategies, resource allocation plans, and market expansion roadmaps tailored to Asia Pacific dynamics.
Frequently asked questions
What is the projected size of the Asia Pacific quantum computing market by 2030?
The Asia Pacific quantum computing market is projected to reach $9,039.9 million by 2030, growing from $1,355.3 million in 2025.
What is the CAGR for Asia Pacific's quantum computing market?
Asia Pacific's quantum computing market is expected to grow at a compound annual growth rate of 46.2% between 2025 and 2030.
Which countries are driving quantum computing growth in Asia Pacific?
China, Japan, South Korea, and India are the primary drivers of quantum computing growth in Asia Pacific, supported by government funding and private sector investment.
What industries in Asia Pacific are adopting quantum computing solutions?
Key industries adopting quantum computing in Asia Pacific include financial services, pharmaceuticals, materials science, and telecommunications.
Why is Asia Pacific's quantum computing market growing faster than the global average?
Asia Pacific's faster growth is driven by substantial government support, cost-effective R&D capabilities, established semiconductor ecosystems, and increasing enterprise demand for quantum solutions.
RESEARCH METHODOLOGY
The study involved four major activities in estimating the size of the quantum computing market. Exhaustive secondary research has been done to collect information on the market, peer, and parent markets. The next steps are to validate these findings, assumptions, and size with industry experts across the value chain through primary research. Both top-down and bottom-up approaches have been employed to estimate the global market size. After that, market breakdown and data triangulation have been used to estimate the market sizes of segments and subsegments.
Secondary Research
Secondary sources for this research study include corporate filings (such as annual reports, investor presentations, and financial statements), trade, business, and professional associations, white papers, certified publications, articles from recognized authors, directories, and databases. Secondary data was collected and analysed to determine the overall market size, further validated by primary research.
Primary Research
Extensive primary research was conducted after understanding and analysing the quantum computing market scenario through the secondary research process. Several primary interviews were conducted with key opinion leaders from the demand- and supply-side vendors across four major regions—North America, Asia Pacific, Europe, and RoW (including the Middle East, Africa, and South America). After interacting with industry experts, brief sessions were conducted with highly experienced independent consultants to reinforce the findings from our primary research. This and the in-house subject matter experts’ opinions have led us to the findings described in the remainder of this report.
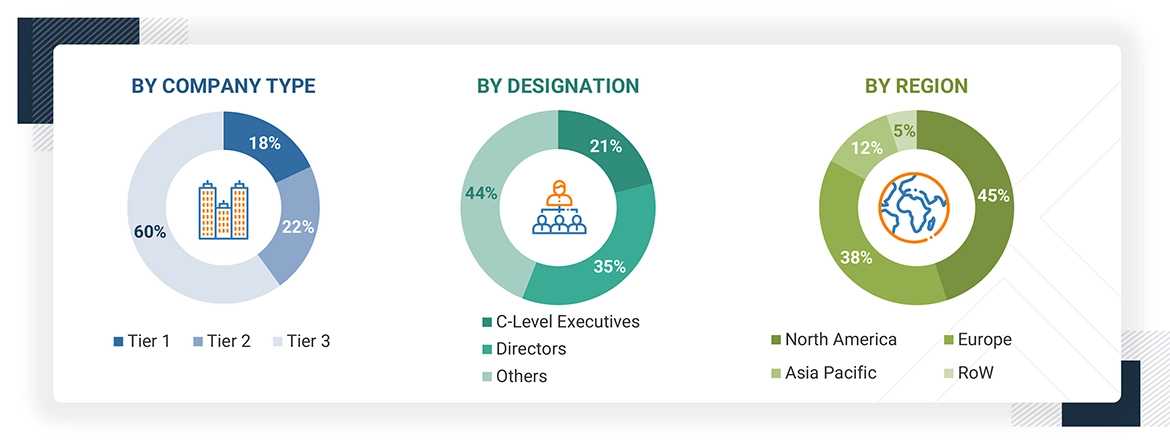
Note: Three tiers of the companies were defined based on their total/segmental revenue as of 2024; Tier 1 = >USD 1 billion, Tier 2 = USD 1 billion–USD 500 million, and Tier 3 = USD 500 million. Others include sales, marketing, and product managers.
To know about the assumptions considered for the study, download the pdf brochure
Market Size Estimation
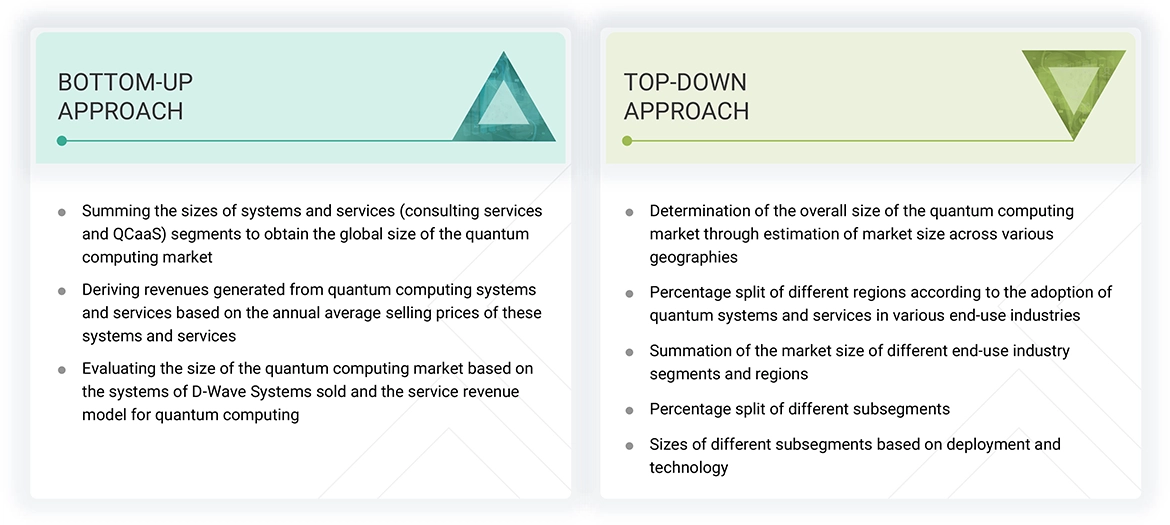
Both top-down and bottom-up approaches have been used to estimate and validate the total size of the quantum computing market. These methods have also been extensively used to estimate the sizes of various market subsegments. The research methodology used to estimate the market sizes includes the following:
- Identifying various applications that use or are expected to use the quantum computing market.
- Analyzing historical and current data pertaining to the size of the quantum computing market for each application
- Analyzing the average selling prices of quantum computing based on different technologies
- Studying various paid and unpaid sources, such as annual reports, press releases, white papers, and databases
- Identifying leading providers of quantum computing, studying their portfolios, and understanding features of their products and their underlying technologies, as well as the types of quantum computing products offered
- Tracking ongoing and identifying upcoming developments in the market through investments, research and development activities, product launches, expansions, and partnerships, and forecasting the market size based on these developments and other critical parameters
- Carrying out multiple discussions with key opinion leaders to understand the technologies used in quantum computing, and products wherein they are deployed, and analyzing the breakdown of the scope of work carried out by key manufacturers of quantum computing providers
- Verifying and cross-checking estimates at every level through discussions with key opinion leaders, such as CXOs, directors, and operations managers, and finally with domain experts at MarketsandMarkets
Quantum Computing Market : Top-Down and Bottom-Up Approach
Data Triangulation
The market has been split into several segments and subsegments after arriving at the overall market size, using the market size estimation processes explained above. Data triangulation and market breakdown procedures have been employed to complete the overall market engineering process and arrive at the exact statistics of each market segment and subsegment, wherever applicable. The data has been triangulated by studying various factors and trends from both the demand and supply sides.
Market Definition
Quantum computing involves phenomena such as quantum entanglement and quantum mechanics superposition that quantum computers use for their enhanced computing power. The improved computing power of quantum computers can be attributed to how data is represented. Conventional computers use bits that can either be 1s or 0s, while quantum computers use qubits (quantum bits), which can be both 0s and 1s simultaneously due to superposition. Quantum computing devices or quantum computers operate with nanoscale components at low temperatures, and they have the potential to address some of the most challenging computational problems.
Key Stakeholders
- Research organizations and universities
- Original equipment manufacturers (OEMs)
- Technology standard organizations, forums, alliances, and associations
- Analysts and strategic business planners
- Government bodies, venture capitalists, and private equity firms
- End users
Report Objectives
- To define, describe, segment, and forecast the quantum computing market in terms of value based on offering, deployment, technology, application, end-user, and region.
- To estimate the size of the market and its segments concerning four main regions, namely, North America, Europe, Asia Pacific, and the Rest of the World (RoW), along with their key countries.
- To provide detailed information regarding the key factors influencing market growth, such as drivers, restraints, opportunities, and challenges
- To offer a detailed analysis of the quantum computing value chain
- To analyze the opportunities in the market for stakeholders and provide a detailed competitive landscape of the market leaders
- To strategically profile the key players and comprehensively analyze their market ranking and core competencies
- To analyze key growth strategies such as expansions, contracts, joint ventures, acquisitions, product launches and developments, and research and development activities undertaken by players operating in the quantum computing market.
Available Customizations
With the given market data, MarketsandMarkets offers customizations according to the specific requirements of companies. The following customization options are available for the report:
Company Information:
- Detailed analysis and profiling of 34 market players
Get the Full Quantum Computing Market Report
Full forecast, segment splits, and company analysis for all Quantum Computing Market.
- UK Quantum Computing Market
- Germany Quantum Computing Market
- France Quantum Computing Market
- Italy Quantum Computing Market
- Spain Quantum Computing Market
- Poland Quantum Computing Market
- China Quantum Computing Market
- Japan Quantum Computing Market
- South Korea Quantum Computing Market
- India Quantum Computing Market
- Australia Quantum Computing Market
- Indonesia Quantum Computing Market
- Thailand Quantum Computing Market
- Vietnam Quantum Computing Market
- US Quantum Computing Market
- Canada And Mexico Quantum Computing Market
- Nordics Quantum Computing Market
- Rest Of Europe Quantum Computing Market
- The Netherland Quantum Computing Market
- Malaysia Quantum Computing Market
- Rest Of Asia Pacific Quantum Computing Market
Need a Tailored Report?
Customize this report to your needs
Get 10% FREE Customization
Customize This Report
