
Indonesia Robotic Vision Market (2025-2030)

The Indonesia Robotic Vision Market was valued at $28 Million in 2025 and projected to reach to $41.8 Million by 2030, representing a compound annual growth rate of 8.3%. Indonesia's robotic vision market is poised for sustained expansion as manufacturing and logistics sectors increasingly prioritize automation to maintain competitiveness.


| Market Size in | USD 26.32 MN |
| Market Forecast in | |
| CAGR | |
| Forecast Period | |
| Units Considered | Value (USD MN) |
Indonesia Robotic Vision Market Trends and Insights
- This 8.3% compound annual growth rate reflects Indonesia's increasing adoption of automation technologies across manufacturing, logistics, and industrial sectors.
- Indonesia's strategic position in Southeast Asia's supply chain and rising labor costs are driving demand for vision-enabled robotic systems that enhance productivity and precision. The Indonesian market benefits from growing foreign direct investment in electronics manufacturing and automotive assembly.
- Indonesia's expanding middle class and digital infrastructure improvements support the deployment of advanced robotic vision solutions in factories and warehouses.
- By 2030, Indonesia is expected to solidify its role as a key automation hub in the Asia Pacific region, with robotic vision technology becoming integral to competitive manufacturing operations..
Key Market Statistics
- CAGR (2025-2030) 8.3% CAGR
- Market Size, 2025 ~USD 28 Million
- Forecast, 2030 ~USD 41.8 Million
- Country Indonesia
Indonesia Robotic Vision Market Overview
Market Valuation Growth :
Indonesia's robotic vision market is valued at $28.0 million in 2025 and is projected to reach $41.8 million by 2030, representing a robust 8.3% CAGR driven by industrial automation expansion.
Manufacturing Sector Adoption :
Indonesian manufacturers are increasingly deploying robotic vision systems to enhance production efficiency, quality control, and reduce operational costs amid rising labor expenses across the region.
Supply Chain Integration :
Indonesia's strategic position in Southeast Asia's supply chain network is accelerating the adoption of automation technologies, positioning the country as a key hub for robotic vision implementation in ASEAN.
Labor Cost Pressures :
Rising labor costs in Indonesia are compelling manufacturers and logistics operators to invest in robotic vision solutions for automation, driving market growth across multiple industrial verticals.
Indonesia Robotic Vision Market Dynamics
- The 8.3% CAGR reflects growing investments in Industry 4.0 technologies, with particular momentum in automotive, electronics, and food processing industries.
- Government initiatives supporting industrial modernization and foreign direct investment in manufacturing hubs are expected to accelerate adoption rates through 2030. Key growth drivers include rising labor costs, supply chain optimization demands, and the need for enhanced quality control in export-oriented industries.
- As Indonesia strengthens its position in global manufacturing networks, robotic vision systems will become essential for maintaining productivity and meeting international standards.
- Market expansion will be supported by increasing availability of affordable vision solutions and growing technical expertise among local integrators..
Market Ecosystem
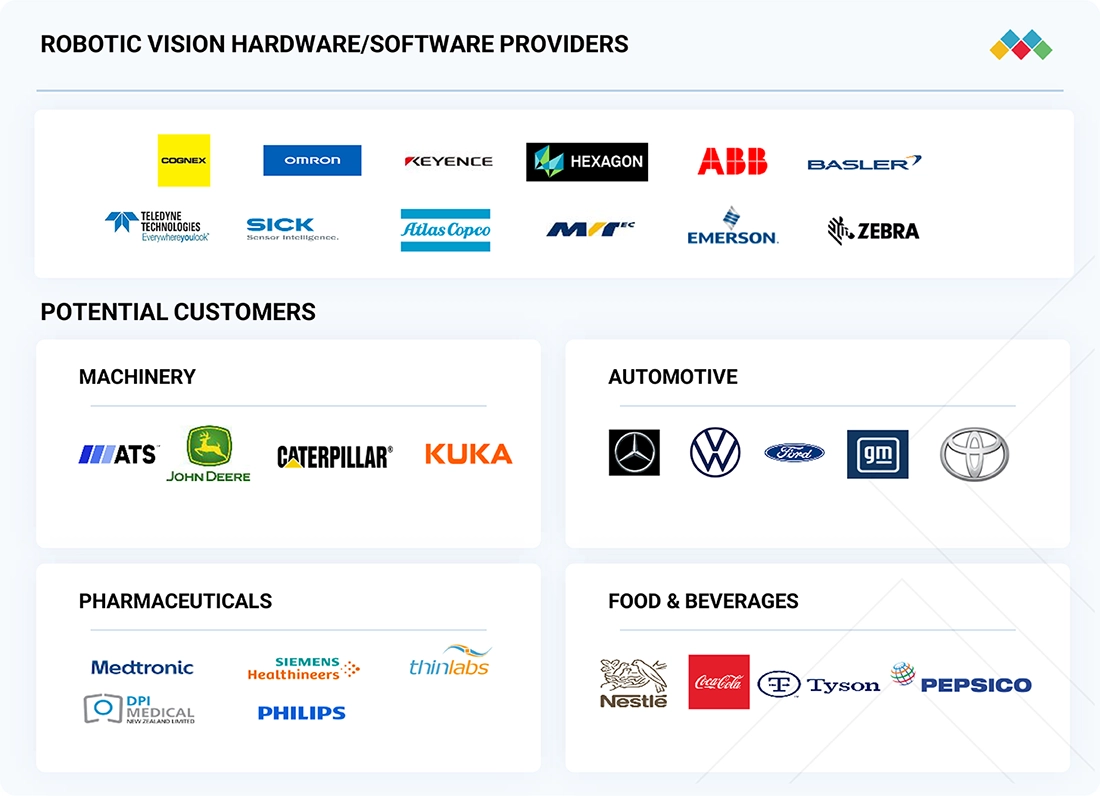
Robotic Vision Market: COMMERCIAL USE CASES ACROSS INDUSTRIES
| COMPANY | USE CASE DESCRIPTION | BENEFITS |
|---|---|---|
 |
Integrated iRVision for bin picking, part location, inspection, and robot guidance with 2D/3D sensors | Faster cycle times, higher accuracy, simplified programming, less fixturing, real-time inspection |
 |
Cobots with onboard vision for material handling, assembly, inspection, logistics | Rapid deployment, flexible programming, improved safety, reliable defect detection, consistent quality |
 |
Advanced Vision Solutions for process optimization, autonomous inspection, and smart data analytics in robotics | High-res 1D/2D/3D sensing, quick software integration, reliable QA, scalable to complex tasks, real-time processing |
 |
Vision-guided robots for pick-and-place, bin picking, high-speed defect detection, multi-inspection support | Fast, one-click calibration, 3D high-precision, flexible AI-based inspections, reduced labor, improved yield |
 |
Vision-guided robotic solutions for flexible manufacturing, barcode reading, deep learning-based inspection | Superior accuracy/speed, easy system integration, automated code reading, robust defect detection, production optimization |
Logos and trademarks shown above are the property of their respective owners. Their use here is for informational and illustrative purposes only.
Related Ecosystem
Communication And Connectivity Technology
- Sensors
- Smart Card & Readers
- Cellular Network
- Femtocell
- Image Sensors
- Cisco Systems, Inc.
- HUAWEI TECHNOLOGIES CO LTD
- Lenovo
- CommScope Holding Company, Inc.
- Nokia corporation
Drones And Robotics
- Sensors
- Articulated Robots
- Cartesian Robots
- Scara Robots
- Actuators
- ABB India Limited
- KUKA AG
- MOMENTIVE PERFORMANCE MATERIALS INC.
- Fanuc Corporation
- STAUBLI INTERNATIONAL AG
Key Takeaways
- Indonesia's robotic vision market is valued at $28.0 million in 2025 and will reach $41.8 million by 2030, representing an 8.3% CAGR.
- Indonesia's manufacturing sector is increasingly adopting vision-enabled automation to address labor shortages and improve operational efficiency.
- Foreign direct investment in Indonesia's electronics and automotive industries is accelerating robotic vision technology deployment.
- Indonesia's growing digital infrastructure and competitive labor market position the country as a key automation growth driver in Southeast Asia.
Robotic Vision Market Report Scope
| Report Metric | Details |
|---|---|
| Base Year | 2025 |
| Fastest Growing Segment | 3D VISION SYSTEMS (Type) |
| Forecast Period | 2025-2030 |
| Growth Rate | CAGR of 8.7% from 2025 to 2030 |
| Largest Segment | 2D VISION SYSTEMS (Type) |
| Market Size Base Year (Billions) | ~USD 3.29 (2025) |
| Revenue Forecast (Billions) | ~USD 4.99 (2030) |
| Segments Covered | Component, Component Type, Imaging Spectrum, Industry, Type |
Indonesia Robotic Vision Market Report Segmentation
5 segment dimensions are covered across the global market.
By Component
- Cameras
- Frame Grabbers
- Led Lighting Systems
- Optics
- Other Hardware Components
- Processors & Controllers
- Software
By Component Type
- Cameras
- Frame Grabbers
- Led Lighting Systems
- Optics
- Other Hardware Components
- Processors & Controllers
By Imaging Spectrum
- Visible
- Visible+ Ir
By Industry
- Automotive
- Electronics & Semiconductors
- Food & Beverages
- Healthcare
- Logistics
- Metals & Machinery
- Other Industries
- Rubber & Plastics
By Type
- 2D Vision Systems
- 3D Vision Systems
INDONESIA: ROBOTIC VISION MARKET, BY INDUSTRY, 2025–2030
| Segment | 2025 | 2026 | 2027 | 2028 | 2029 | 2030 | CAGR (%) |
|---|---|---|---|---|---|---|---|
| AUTOMOTIVE | 8.2 | 8.8 | 9.6 | 10.5 | 11.5 | 12.7 | 9.2 |
| ELECTRONICS & SEMICONDUCTORS | 6.2 | 6.6 | 7.2 | 7.8 | 8.5 | 9.3 | 8.7 |
| FOOD & BEVERAGES | 2.3 | 2.4 | 2.6 | 2.8 | 3.1 | 3.4 | 8.3 |
| HEALTHCARE | 2.9 | 3.2 | 3.4 | 3.7 | 4 | 4.4 | 8.5 |
| LOGISTICS | 2.2 | 2.4 | 2.6 | 2.8 | 3.1 | 3.4 | 8.8 |
| METALS & MACHINERY | 2.1 | 2.2 | 2.4 | 2.6 | 2.8 | 3 | 7.3 |
| OTHER INDUSTRIES | 3.1 | 3.3 | 3.5 | 3.7 | 3.9 | 4.2 | 6.2 |
| RUBBER & PLASTICS | 1 | 1.1 | 1.2 | 1.2 | 1.3 | 1.4 | 6.1 |
| TOTAL | 28 | 30.1 | 32.4 | 35.1 | 38.2 | 41.8 | 8.3 |
Target Audience
- Manufacturing Companies : Indonesian and multinational manufacturers need market insights to evaluate automation investments, benchmark against competitors, and identify robotic vision applications for production optimization and cost reduction.
- Technology Providers & Integrators : Robotic vision system vendors and system integrators require Indonesia-specific market data to assess demand, identify customer segments, develop localized solutions, and plan market expansion strategies.
- Investment & Private Equity Firms : Investors evaluating opportunities in Indonesia's industrial automation sector need detailed market forecasts, growth drivers, and competitive analysis to support investment thesis development and portfolio decisions.
- Supply Chain & Logistics Operators : Logistics companies and supply chain managers need market intelligence on robotic vision adoption to evaluate automation opportunities, improve operational efficiency, and maintain competitiveness in Indonesia's growing sector.
- Government & Policy Makers : Indonesian government agencies and industrial development organizations require market data to inform industrial policy, support manufacturing modernization initiatives, and attract foreign investment in automation technologies.
Reasons to Buy this Report
- Localized Market Intelligence : Gain Indonesia-specific insights on market size, growth trajectories, and sector-specific adoption patterns unavailable in global reports, enabling targeted business strategies for the Indonesian market.
- Competitive Positioning : Understand Indonesia's unique market dynamics, key growth drivers, and competitive landscape to identify opportunities for market entry, expansion, or partnership development in Southeast Asia's largest economy.
- Investment Decision Support : Access detailed forecasts and market valuation data for Indonesia to support investment decisions, resource allocation, and business case development for manufacturing and automation initiatives.
- Sector-Specific Opportunities : Identify high-growth segments within Indonesia's manufacturing, logistics, and industrial sectors where robotic vision adoption is accelerating, enabling focused product and service development.
- Strategic Planning : Leverage Indonesia-focused market data to develop long-term strategies, assess market potential through 2030, and align product roadmaps with regional automation trends and customer requirements.
Frequently asked questions
What is the current size of Indonesia's robotic vision market?
Indonesia's robotic vision market is valued at $28.0 million in 2025 and is projected to grow to $41.8 million by 2030.
What is the growth rate of Indonesia's robotic vision market?
Indonesia's robotic vision market is growing at a compound annual growth rate (CAGR) of 8.3% from 2025 to 2030.
Which industries in Indonesia are driving robotic vision adoption?
Indonesia's manufacturing, electronics assembly, automotive, and logistics sectors are the primary drivers of robotic vision technology adoption.
Why is Indonesia's robotic vision market expanding?
Indonesia's market expansion is driven by rising labor costs, foreign direct investment in manufacturing, supply chain positioning, and increasing demand for automation and precision in production.
What role does Indonesia play in the Asia Pacific robotic vision market?
Indonesia is emerging as a key automation hub in Southeast Asia, leveraging its manufacturing base and strategic supply chain position to drive regional robotic vision adoption.
RESEARCH METHODOLOGY
The study involved four main activities to estimate the current size of the robotic vision market. Extensive secondary research was conducted to gather information on the market, related markets, and the overall robotic vision landscape. These findings, along with assumptions and projections, were validated through primary research that included interviews with industry experts and key stakeholders across the value chain. Both top-down and bottom-up approaches were used to estimate the overall market size. Afterwards, market breakdown and data triangulation techniques helped determine the sizes of various segments and subsegments. Two primary sources, secondary and primary, were utilized to perform a comprehensive technical and commercial assessment of the robotic vision market.
Secondary Research
The secondary research process involved consulting various secondary sources to gather the necessary information for this study. These sources included annual reports, press releases, investor presentations by companies; white papers; journals and reputable publications; and articles from recognized authors, websites, directories, and databases. Secondary research was performed to acquire key information about the industry’s supply chain, the market’s value chain, the overall pool of key players, market segmentation based on industry trends (down to the most detailed level), regional markets, and significant developments from both market and technology perspectives. The collected secondary data was analyzed to estimate the overall market size, which was further validated through primary research.
Primary Research
After understanding the current state of the robotic vision market through secondary research, extensive primary research was conducted. Several interviews were carried out with experts from the demand and supply sides across four major regions: North America, Europe, the Asia Pacific, and the RoW. This primary data was gathered through questionnaires, emails, and phone calls.
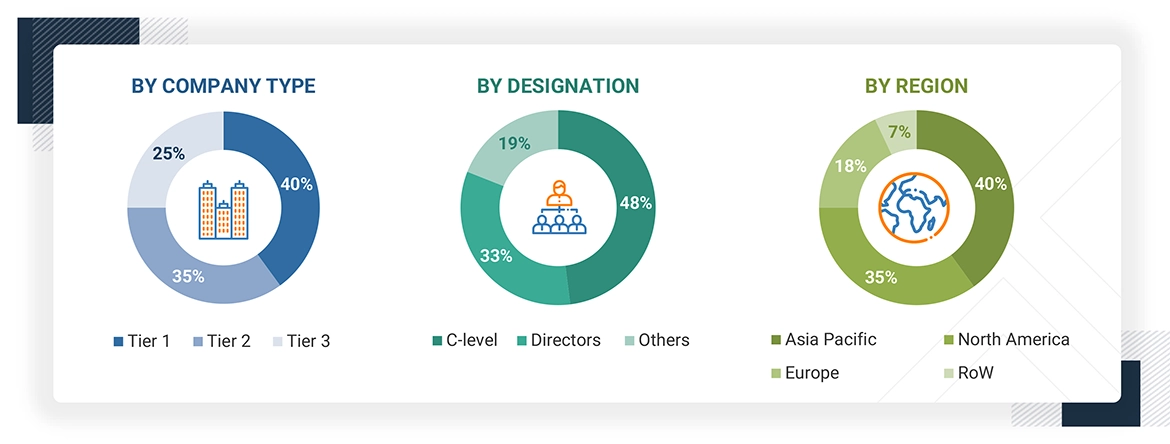
Note: Three tiers of companies have been defined based on their total revenue as of 2024: tier 3: revenue less than USD 500 million; tier 2: revenue between USD 500 million and USD 1 billion; and tier 1: revenue more than USD 1 billion. Other designations include sales managers, marketing managers, and product managers.
To know about the assumptions considered for the study, download the pdf brochure
Market Size Estimation
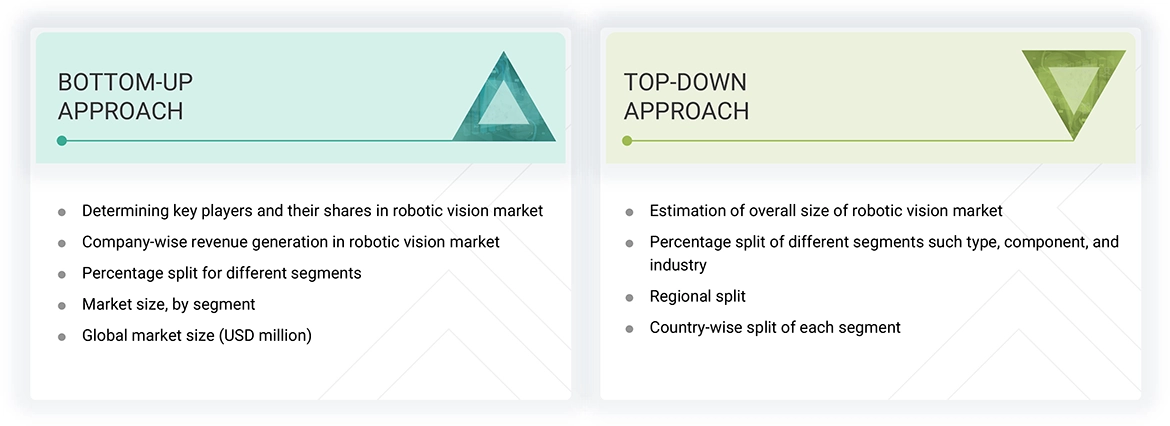
Both top-down and bottom-up approaches were employed to estimate and validate the overall size of the robotic vision market. These methods have also been widely used to determine the size of various subsegments within the market. The following research methodology was applied to estimate the market size:
- Major players in the industry and markets were identified through extensive secondary research.
- The industry’s value chain and market size (in terms of value) were determined through primary and secondary research processes.
- All percentage shares, splits, and breakdowns were determined using secondary sources and verified through primary sources.
Robotic Vision Market : Top-Down and Bottom-Up Approach
Data Triangulation
After arriving at the overall size of the robotic vision market using the market size estimation process explained above, the total market was split into several segments and subsegments. Data triangulation and market breakdown procedures were employed, wherever applicable, to complete the overall market engineering process and arrive at the exact statistics for all segments and subsegments of the market. The data was triangulated by studying various factors and trends from both the demand and supply sides. The market size was also validated using both top-down and bottom-up approaches.
Market Definition
The integration of machine vision systems with industrial robots is called robotic vision. It involves combining advanced imaging and computer vision technologies with robotic systems to help machines perceive, interpret, and interact with their environment. This includes using cameras, sensors, and complex algorithms to capture and analyze visual data, enabling robots to perform tasks such as object recognition, navigation, inspection, and manipulation with high accuracy. The technology covers both 2D and 3D vision systems, which provide depth perception and spatial awareness essential for industries like manufacturing, automotive, logistics, and healthcare. By utilizing artificial intelligence and machine learning, robotic vision improves automation by supporting real-time decision-making and adapting to changing environments. It plays a key role in advancing Industry 4.0, boosting productivity, quality control, and safety in various operational areas.
Key Stakeholders
- Raw material and manufacturing equipment suppliers
- Government bodies, venture capitalists, and private equity firms
- Robotic vision manufacturers
- Robotic vision distributors
- Robotic vision industry associations
- Professional service/solution providers
- Research institutions and organizations
- Standards organizations and regulatory authorities related to the robotic vision market
- System integrators
- Technology consultants
Report Objectives
- To define, describe, and forecast the robotic vision market, in terms of type, component, industry, and region, in terms of value
- To forecast the market, by component, in terms of volume
- To describe and forecast the market, in terms of value, with regard to four central regions: North America, Europe, Asia Pacific, and Rest of the World (RoW), along with their respective countries
- To provide detailed information regarding major factors such as drivers, restraints, opportunities, and challenges influencing market growth
- To provide a detailed overview of the robotic vision value chain
- To strategically analyze micromarkets with respect to individual growth trends, prospects, and contributions to the robotic vision market
- To analyze opportunities in the market for stakeholders by identifying high-growth segments of the robotic vision market
- To strategically profile key players and comprehensively analyze their market position in terms of ranking and core competencies, along with detailing the competitive landscape for market leaders
- To analyze competitive strategies, such as product launches, expansions, mergers, and acquisitions, adopted by key players in the robotic vision market
Available customizations:
With the given market data, MarketsandMarkets offers customizations according to the company’s specific needs. The following customization options are available for the report:
Company Information:
- Detailed analysis and profiling of additional market players (up to 5)
Get the Full Robotic Vision Market Report
Full forecast, segment splits, and company analysis for all Robotic Vision Market.
- US Robotic Vision Market
- Canada Robotic Vision Market
- Mexico Robotic Vision Market
- Germany Robotic Vision Market
- UK Robotic Vision Market
- France Robotic Vision Market
- Italy Robotic Vision Market
- Spain Robotic Vision Market
- Netherlands Robotic Vision Market
- Switzerland Robotic Vision Market
- China Robotic Vision Market
- Japan Robotic Vision Market
- South Korea Robotic Vision Market
- India Robotic Vision Market
- Australia Robotic Vision Market
- Singapore Robotic Vision Market
- Nordics Robotic Vision Market
- Rest Of Europe Robotic Vision Market
- Rest Of Asia Pacific Robotic Vision Market
- Bahrain Robotic Vision Market
- Kuwait Robotic Vision Market
- Oman Robotic Vision Market
- Qatar Robotic Vision Market
- Rest Of Middle East Robotic Vision Market
- Saudi Arabia Robotic Vision Market
- UAE Robotic Vision Market
- Argentina Robotic Vision Market
- Brazil Robotic Vision Market
- Other South American Countries Robotic Vision Market
- Other African Countries Robotic Vision Market
- South Africa Robotic Vision Market
Need a Tailored Report?
Customize this report to your needs
Get 10% FREE Customization
Customize This Report
