Mexico Shore Power Market (2024-2029)

The Mexico Shore Power Market was valued at $60.6 Million in 2024 and projected to reach to $91.6 Million by 2029, representing a compound annual growth rate of 8.6%. Mexico's shore power market is positioned for sustained expansion as the country strengthens its maritime infrastructure and embraces electrification technologies.


| Market Size in | USD 26.32 MN |
| Market Forecast in | |
| CAGR | |
| Forecast Period | |
| Units Considered | Value (USD MN) |
Mexico Shore Power Market Trends and Insights
- This 8.6% compound annual growth rate reflects Mexico's increasing investment in port infrastructure and maritime electrification initiatives.
- Mexico's strategic position as a major shipping hub in North America is driving adoption of shore power systems to reduce vessel emissions and operational costs. The Mexican shore power market benefits from growing environmental regulations and port modernization efforts across major facilities.
- Mexico's ports are increasingly implementing cold ironing technology to support international shipping standards and sustainability commitments.
- By 2029, Mexico is expected to solidify its role as a regional leader in shore power infrastructure development within North America..
Key Market Statistics
- CAGR (2024-2029) 8.6% CAGR
- Market Size, 2024 ~USD 60.6 Million
- Forecast, 2029 ~USD 91.6 Million
- Country Mexico
Mexico Shore Power Market Overview
Market Valuation :
Mexico's shore power market is valued at $60.6 million in 2024, with projections reaching $91.6 million by 2029, representing a robust 8.6% CAGR driven by port modernization initiatives.
Strategic Port Position :
Mexico's critical role as North America's major shipping hub is accelerating shore power adoption, with ports in Veracruz, Manzanillo, and Ensenada leading electrification efforts to reduce maritime emissions.
Infrastructure Investment :
Significant government and private sector investments in port infrastructure are enabling the deployment of shore power systems, supporting Mexico's commitment to sustainable maritime operations and environmental compliance.
Growth Trajectory :
At 8.6% CAGR, Mexico's shore power market growth outpaces many regional markets, reflecting increasing regulatory pressure and operational cost savings driving adoption among shipping lines and port operators.
Mexico Shore Power Market Dynamics
- The 8.6% CAGR through 2029 reflects growing demand from major shipping lines seeking to reduce operational costs and comply with international environmental standards.
- Mexico's geographic advantage as a North American shipping gateway, combined with government support for green port initiatives, creates favorable conditions for market growth. Key drivers include increasing vessel traffic through Mexican ports, stricter emissions regulations, and rising fuel costs that make shore power systems economically attractive.
- Investment in port modernization, particularly at major hubs like Veracruz and Manzanillo, will accelerate technology adoption.
- As Mexico aligns with global sustainability trends and USMCA trade requirements, shore power infrastructure will become increasingly critical for competitive port operations and attracting environmentally conscious shipping partners..
Market Ecosystem
Related Ecosystem
Decarbonization
- Battery Electric Vehicle (BEV)
- Energy Management Systems
- Fuel Cell
- Fuel Cell Electric Vehicle (FCEV)
- Geographical Information System (GIS)
- TotalEnergies SE
- Siemens ag
- Mitsui & Co., Ltd.
- General Electric Company
- Thyssenkrupp ag
Power Infrastructure
- Geographical Information System (GIS)
- Cogeneration
- Battery Electric Vehicle (BEV)
- Cellular Network
- Fuel Cell
- ABB India Limited
- Siemens ag
- SCHNEIDER ELECTRIC SE
- General Electric Company
- Eaton Corporation plc
Key Takeaways
- Mexico's shore power market will grow from $60.6M (2024) to $91.6M (2029) at an 8.6% CAGR
- Mexico's major ports are prioritizing cold ironing infrastructure to meet environmental compliance standards
- Mexico's geographic advantage as a North American shipping hub accelerates shore power adoption
- Mexico's investment in port modernization supports long-term maritime electrification goals
Shore Power Market Report Scope
| Report Metric | Details |
|---|---|
| Base Year | 2024 |
| Fastest Growing Segment | SHIPSIDE (Installation Type) |
| Forecast Period | 2024-2029 |
| Growth Rate | CAGR of 12% from 2024 to 2029 |
| Largest Segment | SHORESIDE (Installation Type) |
| Market Size Base Year (Billions) | ~USD 2.03 (2024) |
| Revenue Forecast (Billions) | ~USD 3.58 (2029) |
| Segments Covered | Installation Type, Vessel, Connection Type, Component, Power Output |
Mexico Shore Power Market Report Segmentation
5 segment dimensions are covered across the global market.
By Installation Type
- Shipside
- Shoreside
By Vessel
- Bulk Carrier
- Container Vessel
- Cruise
- Ferry
- General Cargo
- Other Vessels
- Ro-Ro And Vehicle Carrier
- Ro-Ro And Vehicles Carrier
- Ro-Ro And Vehicle Carrier
- Tanker
By Connection Type
- New Installations
- New Installationss
- Retrofits
By Component
- Cables & Accessories
- Cables And
- Cables And Accessories
- Frequency Converters
- Other Components
- Switchgear Devices
- Transformers
By Power Output
- 30-60 Mva
- Above 60 Mva
- Below 30 Mva
Target Audience
- Port Operators & Authorities : Mexican port operators need market data to justify shore power infrastructure investments, understand competitive positioning, and plan electrification roadmaps aligned with government sustainability initiatives.
- Shipping & Logistics Companies : Shipping lines operating in Mexican ports require insights on shore power availability, adoption rates, and cost-benefit analysis to optimize vessel operations and meet environmental compliance obligations.
- Technology & Equipment Providers : Shore power system manufacturers and suppliers need Mexico-specific market intelligence to identify growth opportunities, assess demand drivers, and develop targeted sales strategies for port electrification projects.
- Government & Policy Makers : Mexican government agencies and maritime authorities use market research to inform port development policies, sustainability initiatives, and infrastructure investment decisions supporting green maritime growth.
- Investment & Financial Institutions : Investors and financial firms evaluating opportunities in Mexico's maritime sector need comprehensive market data to assess project viability, growth potential, and risk profiles for shore power infrastructure funding.
Reasons to Buy this Report
- Market Entry Strategy : Gain detailed insights into Mexico's shore power landscape to identify optimal entry points, key port locations, and partnership opportunities with major Mexican port operators and shipping lines.
- Competitive Intelligence : Understand market dynamics, competitive positioning, and technology adoption rates across Mexican ports to benchmark against regional players and identify differentiation opportunities in this growing market.
- Investment Decision Support : Access comprehensive financial projections and growth drivers specific to Mexico's $91.6M market opportunity by 2029, enabling informed capital allocation and ROI assessments for shore power infrastructure projects.
- Regulatory & Compliance Insights : Stay informed on Mexico's environmental regulations, port modernization mandates, and USMCA compliance requirements driving shore power adoption, ensuring strategic alignment with evolving maritime standards.
- Stakeholder Engagement : Leverage Mexico-specific market data to engage with port authorities, government agencies, and shipping operators, supporting business development and partnership negotiations in this strategic North American market.
Frequently asked questions
What is the current size of Mexico's shore power market?
Mexico's shore power market was valued at $60.6 million in 2024 and is expected to reach $91.6 million by 2029.
What is the growth rate for shore power in Mexico?
Mexico's shore power market is growing at a compound annual growth rate (CAGR) of 8.6% from 2024 to 2029.
Which Mexican ports are leading shore power adoption?
Mexico's major container and cargo ports are implementing cold ironing systems to support vessel electrification and reduce emissions.
What drives shore power demand in Mexico?
Mexico's shore power demand is driven by environmental regulations, port modernization initiatives, and Mexico's role as a critical North American shipping hub.
How does Mexico's market compare to North America?
Mexico represents a significant segment of the North American shore power market, with steady growth reflecting Mexico's strategic importance in regional maritime infrastructure.
RESEARCH METHODOLOGY
The study involved major activities in estimating the current size of the shore power market. Exhaustive secondary research was done to collect information on the peer and parent markets. The next step was to validate these findings, assumptions, and sizing with industry experts across the value chain through primary research. Both top-down and bottom-up approaches were employed to estimate the total market size. Thereafter, market breakdown and data triangulation were used to estimate the market size of the segments and subsegments.
Secondary Research
Secondary sources referred to for this research study include annual reports, press releases, and investor presentations of companies; white papers; certified publications; articles by recognized authors; and databases of various companies and associations. Secondary research was mainly used to obtain key information about the industry’s supply chain, the total pool of key players, market classification, and segmentation according to industry trends to the bottom-most level, regional markets, and key developments from both, market- and technology-oriented perspectives.
Primary Research
In the primary research process, various primary sources from the supply and demand sides were interviewed to obtain qualitative and quantitative information for this report. Primary sources from the supply side include industry experts such as chief executive officers (CEOs), vice presidents (VPs), marketing directors, and related key executives from various companies and organizations operating in the shore powers market.
In the complete market engineering process, the top-down and bottom-up approaches, along with several data triangulation methods, were extensively used to perform the market size estimations and forecasts for all segments and subsegments listed in this report. Extensive qualitative and quantitative analyses were conducted to complete the market engineering process and list key information/insights throughout the report. Following is the breakdown of primary respondents:
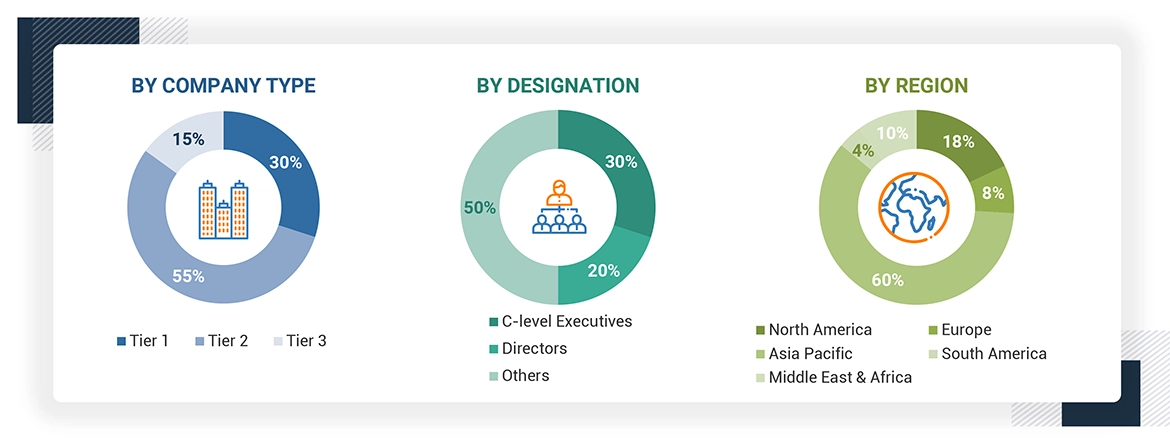
Note: Other designations include sales managers, engineers, and regional managers.
The tier of the companies is defined based on their total revenue; as of 2023: Tier 1 = > USD 1 billion,
Tier 2 = From USD 500 million to USD 1 billion, and Tier 3 = < USD 500 million.
To know about the assumptions considered for the study, download the pdf brochure
Market Size Estimation
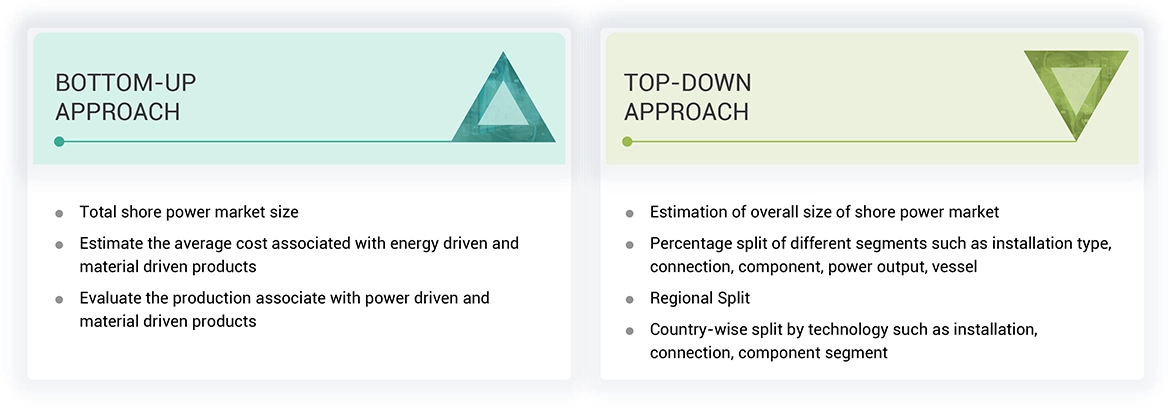
Both top-down and bottom-up approaches were used to estimate and validate the size of the shore power market. These methods were also used extensively to estimate the size of various subsegments in the market. The research methodology used to estimate the market size includes the following:
Shore Power Market : Top-Down and Bottom-Up Approach
Data Triangulation
After arriving at the overall market size from the estimation process explained below, the total market was split into several segments and subsegments. The data triangulation and market breakdown procedures were employed, wherever applicable, to complete the overall market engineering process and arrive at the exact statistics for all segments and subsegments. The data was triangulated by studying various factors and trends from both the demand and supply sides. The market size was validated using the top-down and bottom-up approaches.
Market Definition
Shore power, also known as cold ironing or alternative maritime power (AMP), refers to the supply of electricity from the shore directly to a moored vessel, allowing it to switch off its own on-vessel diesel generators. It, therefore reduces fuel burning and greenhouse gas emissions in a berthed vessel. In addition, shore power has been applied in several types of vessels, among them, vessels cruising, transport ferries, container shipping, and tankers. The main drivers of shore power adoption are, therefore, environmental regulations, government initiatives, and calls for more sustainable and greener port operations, good ways to reduce noise and air pollution, thus improving health and safety conditions for port workers and other local communities. Advances in power management, renewable energy integration, and growth in investments related to port electrification are all resulting in growth in shore power.
Stakeholders
- Government & research organizations
- Institutional investors
- Investors/Shareholders
- Environmental research institutes
- Manufacturers’ associations
- Shore power manufacturers, dealers, and suppliers
- Organizations, forums, alliances, and associations
- Shore Power equipment manufacturing companies
- Shore Power project developers
- Government and research organizations
- Universities and Research institutes
Report Objectives
- To define, describe, segment, and forecast the shore power market by installation type, connection, component, power output, and region, in terms of value
- To forecast the market size for four key regions: North America, Europe, Asia Pacific, Middle East & Africa and South America along with their country-level market sizes, in terms of value
- To provide detailed information regarding key drivers, restraints, opportunities, and challenges influencing the market growth
- To strategically analyze the micromarkets1 with respect to individual growth trends, prospects, and contributions to the overall market size
- To provide value chain analysis, ecosystem analysis, case study analysis, patent analysis, trade analysis, technology analysis, average selling price (ASP) analysis, Porter’s five forces analysis, and regulations pertaining to the market
- To analyze opportunities for stakeholders in the market and draw a competitive landscape for market players
- To strategically analyze the ecosystem, regulations, patents, and trading scenarios pertaining to the market
- To benchmark players within the market using the company evaluation matrix, which analyzes market players on various parameters within the broad categories of business and product strategies
- To compare key market players with respect to their market share, product specifications, and applications
- To strategically profile key players and comprehensively analyze their market rankings and core competencies2
- To analyze competitive developments, such as contracts & agreements, investments & expansions, mergers & acquisitions, partnerships, and collaborations, in the market
- To study the impact of AI/Gen AI on the market under study, along with the global macroeconomic outlook
Available Customizations
With the given market data, MarketsandMarkets offers customizations according to the specific requirements of companies. The following customization options are available for the report:
Product Analysis
- Product Matrix, which provides a detailed comparison of the product portfolio of each company
Company Information
- Detailed analyses and profiling of additional market players
Get the Full Shore Power Market Report
Full forecast, segment splits, and company analysis for all Shore Power Market.
- China Shore Power Market
- India Shore Power Market
- South Korea Shore Power Market
- Australia Shore Power Market
- Singapore Shore Power Market
- Japan Shore Power Market
- Canada Shore Power Market
- US Shore Power Market
- Germany Shore Power Market
- UK Shore Power Market
- Sweden Shore Power Market
- Netherlands Shore Power Market
- Norway Shore Power Market
- Saudi Arabia Shore Power Market
- UAE Shore Power Market
- Egypt Shore Power Market
- South Africa Shore Power Market
- Brazil Shore Power Market
- Argentina Shore Power Market
- Rest Of Europe Shore Power Market
- Rest Of Asia Pacific Shore Power Market
- GCC Shore Power Market
- Rest Of GCC Shore Power Market
- Rest Of South America Shore Power Market
Need a Tailored Report?
Customize this report to your needs
Get 10% FREE Customization
Customize This Report
