
Asia Pacific Smart Glasses Market (2024-2029)

The Asia Pacific Smart Glasses Market was valued at $297.3 Million in 2024 and projected to reach to $1550.1 Million by 2029, representing a compound annual growth rate of 31.7%. The Asia Pacific smart glasses market is poised for explosive growth, expanding from $297.3 million in 2024 to $1,550.1 million by 2029.


| Market Size in | USD 26.32 MN |
| Market Forecast in | |
| CAGR | |
| Forecast Period | |
| Units Considered | Value (USD MN) |
Asia Pacific Smart Glasses Market Trends and Insights
- Asia Pacific's 31.7% compound annual growth rate significantly outpaces global trends, driven by strong consumer adoption in China, Japan, and South Korea, where tech-savvy populations and robust manufacturing ecosystems fuel innovation.
- Enterprise applications in logistics, healthcare, and manufacturing are accelerating Asia Pacific's market penetration as organizations seek augmented reality solutions to enhance productivity and operational efficiency. Asia Pacific's dominance in semiconductor manufacturing and electronics production positions the region as a critical hub for smart glasses development and deployment.
- The forecast period through 2029 reflects Asia Pacific's growing investment in AR/VR infrastructure, 5G connectivity, and artificial intelligence integration.
- Major technology companies and startups across Asia Pacific are launching next-generation devices with improved battery life, lighter designs, and enhanced display capabilities, capturing increasing market share from established Western competitors..
Key Market Statistics
- CAGR (2024-2029) 31.7% CAGR
- Market Size, 2024 ~USD 297.3 Million
- Forecast, 2029 ~USD 1550.1 Million
- Geography Asia Pacific
Asia Pacific Smart Glasses Market Overview
Regional Growth Leadership :
Asia Pacific's 31.7% CAGR significantly outpaces the global average of 29.4%, positioning the region as the fastest-growing smart glasses market and a critical hub for innovation and adoption through 2029.
China's Market Dominance :
China leads Asia Pacific with $824.7 million in market size, driven by aggressive tech investments, manufacturing capabilities, and strong consumer demand for AR/VR applications in enterprise and consumer segments.
Japan & South Korea Innovation Hub :
Japan ($403 million) and South Korea ($139.5 million) are key innovation centers, leveraging advanced semiconductor expertise and tech-savvy populations to drive premium smart glasses adoption and R&D initiatives.
Emerging Market Potential :
India and Rest of Asia Pacific ($182.8 million combined) represent untapped growth opportunities, with rising disposable incomes and digital transformation initiatives creating new market entry points for smart glasses solutions.
Asia Pacific Smart Glasses Market Dynamics
- This trajectory is fueled by China's manufacturing dominance, Japan's technological innovation, and South Korea's premium consumer base.
- Enterprise adoption across logistics, healthcare, and manufacturing sectors is accelerating, while consumer applications in gaming and social media drive mainstream penetration. Key growth catalysts include declining component costs, improved battery technology, and 5G infrastructure rollout across major economies.
- Government initiatives supporting AR/VR ecosystems in China and South Korea, combined with increasing venture capital investment, will sustain the region's competitive advantage.
- By 2029, Asia Pacific is expected to represent over 40% of global smart glasses market value, cementing its position as the world's primary growth engine..
Market Ecosystem
Related Ecosystem
Augmented Virtual Reality
- Sensors
- Virtual Reality Devices
- Augmented Reality
- Virtual Reality
- Augmented Reality Devices
- MICROSOFT CORPORATION
- Lenovo
- VIVITEK CORPORATION
- Apple Inc.
Display Technology
- Augmented Reality
- Liquid Crystal Display (LCD)
- Sensors
- Virtual Reality Devices
- Liquid Crystal on Silicon (LCOS)
- VIVITEK CORPORATION
- Samsung
- Lenovo
- Panasonic Holdings Corporation
- Lg corp
Aviation
- Narrow Body Aircraft
- Wide Body Aircraft
- Military Helicopters
- Special Mission Aircraft
- Fighter Aircraft
- HONEYWELL INTERNATIONAL INC.
- COLLINS AEROSPACE
- Thales group
- Safran group
- HEICO Corporation
Key Takeaways
- Asia Pacific smart glasses market will grow from $297.3M (2024) to $1,550.1M (2029) at a 31.7% CAGR, outpacing global growth rates.
- Asia Pacific's manufacturing leadership and tech-forward consumer base drive enterprise and consumer adoption across the region.
- China, Japan, and South Korea lead Asia Pacific innovation, with significant investments in AR/VR infrastructure and 5G deployment.
- Enterprise applications in logistics, healthcare, and manufacturing are primary growth catalysts for Asia Pacific smart glasses adoption through 2029.
Smart Glasses Market Report Scope
| Report Metric | Details |
|---|---|
| Base Year | 2024 |
| Fastest Growing Segment | AUGMENTED REALITY (Technology) |
| Forecast Period | 2024-2029 |
| Growth Rate | CAGR of 29.4% from 2024 to 2029 |
| Largest Segment | VIRTUAL REALITY (Technology) |
| Market Size Base Year (Billions) | ~USD 0.88 (2024) |
| Revenue Forecast (Billions) | ~USD 3.19 (2029) |
| Segments Covered | Type, Industry, Feature, Technology, Connectivity |
Asia Pacific Smart Glasses Market Report Segmentation
5 segment dimensions are covered across the global market.
By Type
- Binocular
- Monocular
By Industry
- Automotive
- Consumer
- Education & Research
- Healthcare
- Manufacturing
- Other Industries
- Warehousing
By Feature
- Advanced
- Basic
By Technology
- Augmented Reality
- Virtual Reality
By Connectivity
- Standalone Hmd
- Tethered Hmd
Target Audience
- Technology Manufacturers & OEMs : Smart glasses manufacturers need Asia Pacific market intelligence to optimize production capacity, identify supply chain opportunities in China, and develop region-specific product variants for Japan and South Korea.
- Enterprise Solution Providers : B2B software and service providers require detailed insights into Asia Pacific enterprise adoption trends, industry verticals, and deployment patterns to tailor solutions for logistics, manufacturing, and healthcare sectors.
- Investment & Private Equity Firms : Investors targeting Asia Pacific tech opportunities need comprehensive market sizing, growth projections, and competitive landscape data to evaluate acquisition targets and fund allocation decisions in the region.
- Government & Policy Makers : Regional policymakers and economic development agencies require market data to inform technology roadmaps, R&D funding priorities, and regulatory frameworks supporting smart glasses innovation ecosystems.
- Distributors & Channel Partners : Regional distributors and resellers need country-specific market forecasts, competitive positioning, and demand drivers to optimize inventory, pricing strategies, and partnership development across Asia Pacific.
Countries within Asia Pacific - compare and drill down
| Country | 2025 size (native) |
|---|---|
| China | USD 824.7 Million |
| Japan | USD 403 Million |
| South Korea | USD 139.5 Million |
| India | USD 20.2 Million |
| Rest Of Asia Pacific | USD 162.8 Million |
Country market size visualization
Reasons to Buy this Report
- Regional Market Segmentation : Gain detailed insights into country-level performance across China, Japan, South Korea, India, and emerging markets within Asia Pacific to identify high-potential investment and expansion opportunities.
- Competitive Landscape Analysis : Understand Asia Pacific-specific competitive dynamics, local player strategies, and market consolidation trends that differ significantly from Western markets, enabling informed competitive positioning.
- Growth Driver Identification : Access Asia Pacific-specific growth catalysts including manufacturing ecosystems, government initiatives, 5G deployment timelines, and enterprise adoption patterns driving the 31.7% CAGR.
- Investment & Expansion Strategy : Leverage market forecasts and country-level data to prioritize market entry, partnership development, and resource allocation across Asia Pacific's diverse economic and technological landscapes.
- Trend & Technology Insights : Discover Asia Pacific-specific technology trends, consumer preferences, and use case adoption patterns that shape product development and go-to-market strategies in the region.
Frequently asked questions
What is the projected size of the Asia Pacific smart glasses market by 2029?
Asia Pacific's smart glasses market is projected to reach $1,550.1 million by 2029, growing from $297.3 million in 2024.
What is the CAGR for Asia Pacific smart glasses market?
Asia Pacific smart glasses market is expected to grow at a compound annual growth rate of 31.7% from 2024 to 2029.
Which countries are driving growth in Asia Pacific smart glasses market?
China, Japan, and South Korea are the primary growth drivers in Asia Pacific, leveraging advanced manufacturing capabilities and high technology adoption rates.
What are the main applications for smart glasses in Asia Pacific?
Enterprise applications in logistics, healthcare, manufacturing, and retail are the primary use cases, alongside consumer adoption in gaming and entertainment.
Why is Asia Pacific growing faster than the global smart glasses market?
Asia Pacific's growth outpaces global rates due to strong semiconductor manufacturing infrastructure, tech-savvy consumers, significant 5G deployment, and substantial enterprise investment in AR/VR solutions.
RESEARCH METHODOLOGY
The study involved four major activities for estimating the smart glasses market size. Exhaustive secondary research has been conducted to collect information relevant to the market, its peer markets, and its child market. Primary research has been undertaken to validate key findings, assumptions, and sizing with industry experts across the value chain of the smart glasses market growth. Both top-down and bottom-up approaches have been employed to estimate the complete market size. It has been followed by the market breakdown and data triangulation methods to estimate the size of different segments and subsegments of the market.
Secondary Research
The research methodology used to estimate and forecast the size of the smart glasses market began with the acquisition of data related to the revenues of key vendors in the market through secondary research. Various secondary sources have been referred to in the secondary research process for identifying and collecting information for this study. Secondary sources include annual reports, press releases, and investor presentations of companies; white papers, journals, certified publications, and articles by recognized authors; websites; directories; and databases. Secondary research has mainly been used to obtain key information about the value chain of the smart glasses market, key players, market classification, and segmentation according to the industry trends to the bottom-most level, geographic markets, and key developments from both market and technology-oriented perspectives. Secondary data has been collected and analyzed to determine the overall market size, further validated through primary research. The secondary research referred to for this research study involves the VR/AR Association (VRARA), Institute of Electrical and Electronics Engineers (IEEE), and Consumer Technology Association, National Institute of Standard and Technology, and Augmented Reality for Enterprise Alliance. Moreover, the study involved extensive use of secondary sources, directories, and databases, such as Hoovers, Bloomberg Businessweek, Factiva, and OneSource, to identify and collect valuable information for a technical, market-oriented, and commercial study of the smart glasses market size. Vendor offerings have been taken into consideration to determine market segmentation.
Primary Research
In the primary research, various primary sources from both the supply and demand sides have been interviewed to obtain the qualitative and quantitative information relevant to this report. Primary sources from the supply side include the key industry participants, subject-matter experts (SMEs), and C-level executives and consultants from various key companies and organizations in the smart glasses ecosystem. After the complete market engineering (including calculations for the market statistics, the market breakdown, the market size estimations, the market forecasting, and the data triangulation), extensive primary research has been conducted to verify and validate the critical market numbers obtained. Extensive qualitative and quantitative analyses have been performed during the market engineering process to list key information/insights throughout the report. Extensive primary research has been conducted after understanding the smart glasses market size scenario through secondary research. Several primary interviews have been conducted with market experts from the demand and supply-side players across key regions, namely, North America, Europe, Asia Pacific, and the Rest of the World (Middle East, Africa, and South America). Various primary sources from both the supply and demand sides of the market have been interviewed to obtain qualitative and quantitative information. Following is the breakdown of the primary respondents.
Primary data has been collected through questionnaires, emails, and telephonic interviews. In the canvassing of primaries, various departments within organizations, such as sales, operations, and administration, were covered to provide a holistic viewpoint in our report. After interacting with industry experts, brief sessions were conducted with highly experienced independent consultants to reinforce the findings from our primaries. This and the in-house subject matter experts’ opinions have led us to the findings described in the remainder of this report.
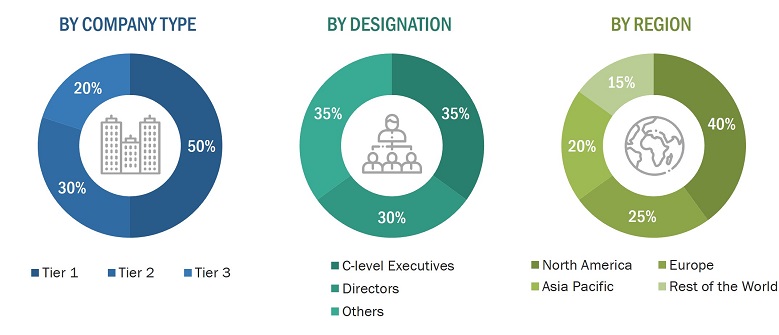
To know about the assumptions considered for the study, download the pdf brochure
Market Size Estimation
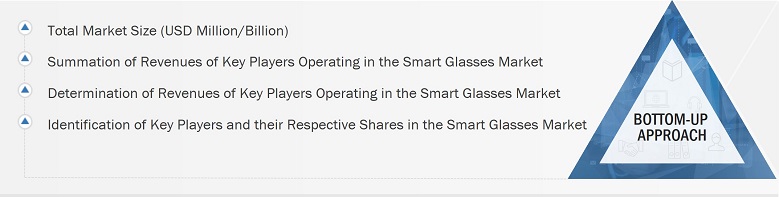
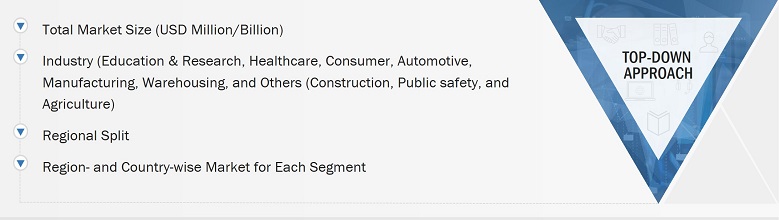
The total size of the smart glasses market has been estimated and validated using both top-down and bottom-up approaches. Furthermore, these methods have also been used extensively to estimate the size of various subsegments in the market. The research methodology used to estimate the market size is as follows:
- Identifying various entities influencing the value chain of the smart glasses market
- Identifying major companies, components manufacturers, system integrators, and OS providers operating in the market
- Estimating segment-level revenue of individual key players operating in the smart glasses market
- Estimating the size of the market for each industry segment, such as education & research, healthcare, automotive, consumer, manufacturing, warehousing, and other industries (construction, public safety, and agriculture)
- Estimating the size of the market share for each region based on the demand for smart glasses
- Tracking the ongoing and upcoming smart glasses product launches to forecast the market size based on these developments and other critical parameters
- Estimating the size of the global smart glasses market and growth rate at the segment and sub-segment levels
Global Smart Glasses Market Size: Bottom-Up Approach
Global Smart Glasses Market Size: Top-Down Approach
Data Triangulation
After arriving at the overall size of the smart glasses market from the market size estimation process explained above, the total market has been split into several segments and subsegments. Data triangulation and market breakdown procedures have been employed, wherever applicable, to complete the overall market engineering process and arrive at the exact statistics for all segments and subsegments of the market. The data has been triangulated by studying various factors and trends from both the demand and supply sides. Along with this, the market size has been validated using both top-down and bottom-up approaches.
Market Definition
Smart glasses are wearable devices that combine a small computer display with traditional glasses, helping users interact with digital content while maintaining awareness of their surroundings. As compared to traditional glasses, smart glasses typically feature augmented reality or mixed reality capabilities, enhancing the user experience by overlaying the digital information in the real-world using camera, sensors, processors, and wireless technology.
Some smart glasses only have audio capability while others can have display. In case of smart glasses with a display, they deliver digital content such as text, images, or 3D objects directly into the user’s vision.
Stakeholders:
- Raw material suppliers and smart glasses developers
- Operating systems developers
- Technology developers
- Augmented reality device manufacturers
- Industrial and consumer industries
- Industries utilizing smart glasses such as education and research, automotive, healthcare, manufacturing, warehousing, and other industries (public safety, agriculture, construction)
- Research organizations
- Technology investors
- Governments, financial institutions, and investment communities
- Analysts and strategic business planners
- Technology standard organizations, forums, alliances, and associations
- Venture capitalists, private equity firms, and startups
- Technology standard organizations, forums, alliances, and associations
- Venture capitalists, private equity firms, and startups
Report Objectives
- To define, describe, segment, and forecast the size of the smart glasses market, by type, feature, and industry, in terms of value
- To describe the various connectivity technologies and operating systems in smart glasses
- To forecast the market size for various segments with respect to four main regions—the North America, Europe, Asia Pacific, and Rest of the World (RoW)—in terms of value
- To provide detailed information regarding the drivers, restraints, opportunities, and challenges influencing the growth of the smart glasses market
- To study the complete value chain analysis of the smart glasses market landscape
- To strategically analyze macro and micromarkets1 with respect to growth trends, prospects, and their contributions to the overall market
- To analyze industry trends, pricing data, patents and innovations, and trade data (export and import data) in the smart glasses market
- To analyze opportunities in the market for stakeholders and provide a detailed competitive landscape
- To strategically profile key players in the market and comprehensively analyze their market share/ranking and core competencies2
- To analyze competitive developments by players in the smart glasses market, such as contracts, product launches/developments, expansions, and research and development (R&D) activities
1. Micromarkets are defined as the further segments and subsegments of the smart glasses market included in the report.
2. Core competencies of companies are defined in terms of their key developments and key strategies adopted to sustain their positions in the market.
Available Customizations:
With the given market data, MarketsandMarkets offers customizations according to the company’s specific needs. The following customization options are available for the report:
Company Information:
- Detailed analysis and profiling of additional market players based on various blocks of the value chain.
Get the Full Smart Glasses Market Report
Full forecast, segment splits, and company analysis for all Smart Glasses Market.
- US Smart Glasses Market
- Canada Smart Glasses Market
- Mexico Smart Glasses Market
- Germany Smart Glasses Market
- UK Smart Glasses Market
- France Smart Glasses Market
- Italy Smart Glasses Market
- Rest Of Europe Smart Glasses Market
- China Smart Glasses Market
- Japan Smart Glasses Market
- South Korea Smart Glasses Market
- India Smart Glasses Market
- Rest Of Asia Pacific Smart Glasses Market
Need a Tailored Report?
Customize this report to your needs
Get 10% FREE Customization
Customize This Report
