
Rest Of Asia Pacific Solar Photovoltaic Glass Market (2023-2028)

The Rest Of Asia Pacific Solar Photovoltaic Glass Market was valued at $35.4 Million in 2023 and projected to reach to $78.3 Million by 2028, representing a compound annual growth rate of 17.2%. Rest Of Asia Pacific is emerging as a critical growth market for solar photovoltaic glass, with expanding solar capacity installations across emerging economies driving sustained demand.


| Market Size in | USD 26.32 MN |
| Market Forecast in | |
| CAGR | |
| Forecast Period | |
| Units Considered | Value (USD MN) |
Rest Of Asia Pacific Solar Photovoltaic Glass Market Trends and Insights
- The region is experiencing robust expansion driven by increasing solar energy adoption and government renewable energy initiatives across emerging economies.
- Rest Of Asia Pacific is projected to reach $78.3 million by 2028, reflecting a compound annual growth rate of 17.2%, substantially outpacing many mature markets. The solar photovoltaic glass market in Rest Of Asia Pacific is characterized by rising manufacturing capacity and growing demand for high-efficiency solar modules.
- Rest Of Asia Pacific benefits from favorable climatic conditions, declining solar equipment costs, and supportive policy frameworks that incentivize renewable energy deployment.
- The region's expanding middle class and electrification needs further accelerate solar adoption, positioning Rest Of Asia Pacific as a critical market for PV glass suppliers and manufacturers. Rest Of Asia Pacific's market trajectory reflects both regional energy transition momentum and global supply chain diversification trends.
- Rest Of Asia Pacific is attracting significant investment in solar infrastructure and manufacturing facilities, creating opportunities for specialized glass producers and technology providers throughout the forecast period..
Key Market Statistics
- CAGR (2023-2028) 17.2% CAGR
- Market Size, 2023 ~USD 35.4 Million
- Forecast, 2028 ~USD 78.3 Million
- Country Rest Of Asia Pacific
Rest Of Asia Pacific Solar Photovoltaic Glass Market Overview
Market Valuation Growth :
Rest Of Asia Pacific solar photovoltaic glass market valued at $35.4 million in 2023, projected to reach $78.3 million by 2028, representing more than 120% growth over the forecast period.
Regional CAGR Performance :
The region demonstrates a robust 17.2% CAGR, driven by accelerating solar energy adoption across emerging economies and supportive government renewable energy policies throughout Asia Pacific.
Emerging Market Dynamics :
Rest Of Asia Pacific represents a significant growth corridor with increasing solar installations in countries beyond major markets, supported by declining manufacturing costs and rising energy demand.
Government Support & Initiatives :
Renewable energy mandates and subsidies across emerging Asia Pacific nations are catalyzing solar photovoltaic glass demand, positioning the region as a key expansion opportunity for manufacturers.
Rest Of Asia Pacific Solar Photovoltaic Glass Market Dynamics
- Government renewable energy targets and declining solar technology costs are accelerating market penetration in countries previously underserved by solar infrastructure development. The region's 17.2% CAGR reflects strong fundamentals including rising electricity demand, energy security concerns, and increasing environmental awareness.
- By 2028, the market is expected to nearly double, supported by manufacturing expansion, improved supply chains, and growing investments in distributed solar projects across residential, commercial, and utility-scale segments..
Market Ecosystem
Related Ecosystem
Ceramics And Glass
- Zirconia
- Alumina Ceramics
- Silicon Carbide
- Silicon Nitride
- Titanate Ceramics
- Saint-gobain
- 3M COMPANY
- Kyocera Corporation
- CERAMTEC GMBH
- COORSTEK INCORPORATED
Power Infrastructure
- Geographical Information System (GIS)
- Cogeneration
- Battery Electric Vehicle (BEV)
- Cellular Network
- Fuel Cell
- ABB India Limited
- Siemens ag
- SCHNEIDER ELECTRIC SE
- General Electric Company
- Eaton Corporation plc
Key Takeaways
- Rest Of Asia Pacific solar PV glass market valued at $35.4 million in 2023, expanding to $78.3 million by 2028 at 17.2% CAGR
- Rest Of Asia Pacific benefits from strong renewable energy policies, declining solar costs, and rising electrification demand across emerging economies
- Rest Of Asia Pacific is attracting significant manufacturing investment and supply chain diversification from global solar equipment producers
- Rest Of Asia Pacific's market growth is driven by high solar irradiance, supportive government incentives, and increasing energy security priorities
Solar Photovoltaic Glass Market Report Scope
| Report Metric | Details |
|---|---|
| Base Year | 2023 |
| Fastest Growing Segment | PEROVSKITE MODULE (End User) |
| Forecast Period | 2023-2028 |
| Growth Rate | CAGR of 28.4% from 2023 to 2028 |
| Largest Segment | ACTIVE (Mechanism) |
| Market Size Base Year (Billions) | ~USD 7.82 (2023) |
| Revenue Forecast (Billions) | ~USD 27.3 (2028) |
| Segments Covered | Type, Installation, End User, Application, Mechanism |
Rest Of Asia Pacific Solar Photovoltaic Glass Market Report Segmentation
5 segment dimensions are covered across the global market.
By Type
- Ar Coated
- Ar-Coated Solar Pv Glass
- Tco Coated
- Tco-Coated Solar Pv Glass
- Tempered
- Tempered Solar Pv Glass
By Installation
- Float Glass
- Float Glass Technology
- Pattern Glass
- Pattern Glass Technology
By End User
- Crystalline Silicon Pv Module
- Perovskite Module
- Thin Film Module
By Application
- Non-Residential
- Residential
- Utility
By Mechanism
- Active
- Passive
Target Audience
- Solar Glass Manufacturers : Evaluate expansion opportunities in Rest Of Asia Pacific, assess market demand, identify production capacity requirements, and benchmark against regional competitors to capture growing market share.
- Solar Panel Producers : Source reliable photovoltaic glass suppliers in Rest Of Asia Pacific, understand regional pricing dynamics, and plan supply chain strategies aligned with emerging market growth projections.
- Investment & Private Equity Firms : Identify acquisition targets, greenfield investment opportunities, and portfolio companies in Rest Of Asia Pacific's high-growth solar glass sector with detailed financial forecasts.
- Government & Policy Makers : Develop renewable energy policies, manufacturing incentives, and infrastructure investments informed by market data on Rest Of Asia Pacific's solar glass demand and industry growth potential.
- Distribution & Trading Companies : Establish distribution networks, negotiate supplier contracts, and plan inventory strategies based on Rest Of Asia Pacific market demand forecasts and regional growth opportunities.
Reasons to Buy this Report
- Emerging Market Entry Strategy : Identify high-potential countries within Rest Of Asia Pacific for market entry, expansion, and partnership opportunities with detailed regional segmentation and growth trajectory analysis.
- Competitive Positioning Intelligence : Understand regional competitive dynamics, local manufacturer capabilities, and market share distribution to develop effective go-to-market strategies specific to Rest Of Asia Pacific.
- Investment & Funding Decisions : Support capital allocation decisions with comprehensive market sizing, growth forecasts, and risk assessments for solar glass manufacturing and distribution investments in emerging Asia Pacific.
- Supply Chain Optimization : Optimize sourcing, production, and distribution strategies by analyzing regional demand patterns, logistics infrastructure, and supply chain vulnerabilities across Rest Of Asia Pacific markets.
- Policy & Regulatory Insights : Navigate government renewable energy initiatives, tariffs, and regulatory frameworks across Rest Of Asia Pacific countries to ensure compliance and capitalize on incentive programs.
Frequently asked questions
What is the current market size of solar photovoltaic glass in Rest Of Asia Pacific?
Rest Of Asia Pacific's solar photovoltaic glass market was valued at $35.4 million in 2023 and is projected to grow to $78.3 million by 2028.
What is the expected growth rate for Rest Of Asia Pacific's solar PV glass market?
Rest Of Asia Pacific's solar photovoltaic glass market is expected to grow at a compound annual growth rate (CAGR) of 17.2% from 2023 to 2028.
What factors are driving growth in Rest Of Asia Pacific's solar PV glass market?
Rest Of Asia Pacific's market growth is driven by increasing solar energy adoption, supportive renewable energy policies, declining equipment costs, favorable climate conditions, and rising electrification needs in emerging economies.
How does Rest Of Asia Pacific's solar PV glass market compare to other regions?
Rest Of Asia Pacific's 17.2% CAGR demonstrates strong regional momentum, reflecting the region's strategic importance in global solar manufacturing and renewable energy expansion.
What opportunities exist for suppliers in Rest Of Asia Pacific's solar PV glass market?
Rest Of Asia Pacific presents opportunities in high-efficiency module production, manufacturing facility expansion, supply chain localization, and technology partnerships with emerging solar equipment manufacturers.
RESEARCH METHODOLOGY
The study involved four major activities in estimating the current size of the solar photovoltaic glass market—extensive secondary research collected information on the market, peer, and parent markets. The next step was to validate these findings, assumptions, and measures with industry experts across the value chain of solar PV glass through primary research. Both top-down and bottom-up approaches were employed to estimate the total market size. After that, market breakdown and data triangulation were used to estimate the size of the segments and sub-segments of the market.
Secondary Research
The research methodology used to estimate and forecast the access control market begins with capturing data on the revenues of key vendors in the market through secondary research. In the secondary research process, various secondary sources, such as Hoovers, Bloomberg BusinessWeek, Factiva, World Bank, and Industry Journals, were referred to to identify and collect information for this study. These secondary sources included annual reports, press releases, investor presentations of companies, white papers, certified publications, articles by recognized authors, notifications by regulatory bodies, trade directories, and databases. Vendor offerings have also been taken into consideration to determine market segmentation.
Primary Research
The solar photovoltaic glass market comprises several stakeholders in the supply chain, such as manufacturers, equipment manufacturers, traders, associations, and regulatory organizations. The development of various end-use industries characterizes the demand side of this market. Various primary sources from the supply and demand sides of the market were interviewed to obtain qualitative and quantitative information. Following is the breakdown of the primary respondents:
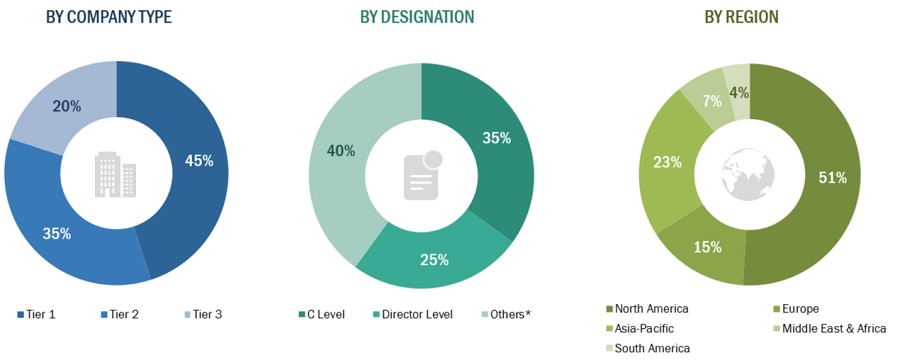
Note: “Others” includes sales, marketing, and product managers
To know about the assumptions considered for the study, download the pdf brochure
Market Size Estimation
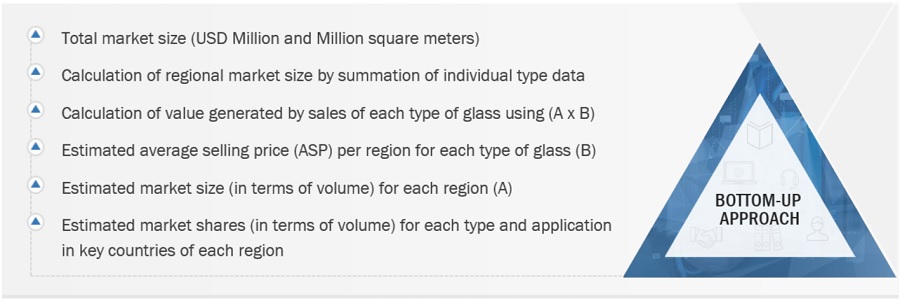
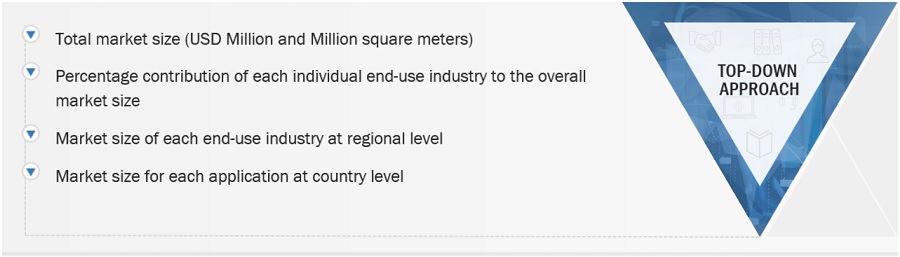
The top-down and bottom-up approaches were used to estimate and validate the total size of the solar photovoltaic glass market. These methods were also used extensively to determine the market size of various segments. The research methodology used to estimate the market size included the following:
- The key players were identified through extensive primary and secondary research.
- The value chain and market size of the reticulated foam market, in terms of value and volume, were determined through primary and secondary research.
- All percentage shares, splits, and breakdowns were determined using secondary sources and verified through primary sources.
- All possible parameters that affect the market covered in this research study were accounted for, viewed in extensive detail, verified through primary research, and analyzed to obtain the final quantitative and qualitative data.
- The research included the study of reports, reviews, and newsletters of top market players, along with extensive interviews for opinions from key leaders, such as CEOs, directors, and marketing executives.
Global Solar Photovoltaic Glass Market Size: Bottom-Up Approach
To know about the assumptions considered for the study, Request for Free Sample Report
Global Solar Photovoltaic Glass Market Size: Top-Down Approach
Data Triangulation
After arriving at the overall market size using the market size estimation processes as explained above, the market was split into several segments and sub-segments. Data triangulation and market breakdown procedures were employed to complete the overall market engineering process and determine each market segment’s and subsegment’s exact statistics. The market size was calculated globally by summing up the country-level and regional-level data.
Market Definition
The solar PV (photovoltaic) glass market refers to the global industry involved in producing, distributing, and selling specialized glass materials used in manufacturing solar panels or photovoltaic modules. This market encompasses the various types of glass designed to enhance the performance, efficiency, and durability of solar cells within solar modules, facilitating the conversion of sunlight into electricity.
Key Stakeholder
- Manufacturers of solar photovoltaic glass
- Traders, distributors, and suppliers of solar photovoltaic glass
- Government and research organizations
- Associations and industrial bodies
- Research and consulting firms
- R&D institutions
- Environment support agencies
- Investment banks and private equity firms
Report Objectives:
- To define, describe, and forecast the size of the global solar photovoltaic glass market in terms of value and volume
- To provide detailed information regarding the key factors, such as drivers, restraints, opportunities, and industry-specific challenges, influencing the growth of the solar photovoltaic glass market.
- To analyze and forecast the size of various segments (type, installation, end-use, application) of the solar photovoltaic glass market based on five major regions—North America, Europe, Asia Pacific, South America, Middle East & Africa—along with key countries in each of these regions
- To analyze recent developments and competitive strategies, such as expansions, new product developments, partnerships, and acquisitions, product launches to draw the competitive landscape of the market
- To strategically profile the key players in the market and comprehensively analyze their core competencies
Available Customizations:
With the given market data, MarketsandMarkets offers customizations according to client-specific needs. The following customization options are available for the report:
- Additional country-level analysis of the solar photovoltaic glass market
- Profiling of additional market players (up to 5)
- Product matrix, which gives a detailed comparison of the product portfolio of each company.
Get the Full Solar Photovoltaic Glass Market Report
Full forecast, segment splits, and company analysis for all Solar Photovoltaic Glass Market.
- China Solar Photovoltaic Glass Market
- Japan Solar Photovoltaic Glass Market
- India Solar Photovoltaic Glass Market
- South Korea Solar Photovoltaic Glass Market
- Taiwan Solar Photovoltaic Glass Market
- Vietnam Solar Photovoltaic Glass Market
- Canada Solar Photovoltaic Glass Market
- Mexico Solar Photovoltaic Glass Market
- US Solar Photovoltaic Glass Market
- Germany Solar Photovoltaic Glass Market
- France Solar Photovoltaic Glass Market
- UK Solar Photovoltaic Glass Market
- Italy Solar Photovoltaic Glass Market
- Spain Solar Photovoltaic Glass Market
- Netherlands Solar Photovoltaic Glass Market
- Brazil Solar Photovoltaic Glass Market
- Chile Solar Photovoltaic Glass Market
- UAE Solar Photovoltaic Glass Market
- Turkey Solar Photovoltaic Glass Market
- South Africa Solar Photovoltaic Glass Market
- Israel Solar Photovoltaic Glass Market
- Rest Of Europe Solar Photovoltaic Glass Market
- Other GCC Countries Solar Photovoltaic Glass Market
- Rest Of South America Solar Photovoltaic Glass Market
Need a Tailored Report?
Customize this report to your needs
Get 10% FREE Customization
Customize This Report
