
Asia Pacific Steam Trap Market (2024-2029)

The Asia Pacific Steam Trap Market was valued at $1510 Million in 2024 and projected to reach to $1934.6 Million by 2029, representing a compound annual growth rate of 5.1%. The Asia Pacific steam trap market is positioned for sustained expansion, projected to reach USD 1,934.6 million by 2029.


| Market Size in | USD 26.32 MN |
| Market Forecast in | |
| CAGR | |
| Forecast Period | |
| Units Considered | Value (USD MN) |
Asia Pacific Steam Trap Market Trends and Insights
- Asia Pacific's steam trap sector is driven by rapid industrialization, increasing energy efficiency mandates, and expansion of manufacturing infrastructure across emerging economies.
- The region's CAGR of 5.1% outpaces global growth, reflecting strong demand from petrochemical, pharmaceutical, and food processing industries throughout Asia Pacific. Asia Pacific's steam trap market benefits from rising adoption of condensate recovery systems and predictive maintenance technologies.
- Between 2024 and 2029, Asia Pacific is expected to capture significant market share as governments implement stricter environmental regulations and companies prioritize operational efficiency.
- The region's competitive landscape features both established multinational players and emerging local manufacturers competing to serve Asia Pacific's diverse industrial base. Key growth catalysts for Asia Pacific include infrastructure modernization in Southeast Asia, China's manufacturing upgrades, and India's industrial expansion.
- Asia Pacific's strategic position as a global manufacturing hub ensures sustained demand for steam trap solutions through 2029..
Key Market Statistics
- CAGR (2024-2029) 5.1% CAGR
- Market Size, 2024 ~USD 1510 Million
- Forecast, 2029 ~USD 1934.6 Million
- Geography Asia Pacific
Asia Pacific Steam Trap Market Overview
Regional Market Leadership :
Asia Pacific commands the steam trap market with USD 1,510.0 million in 2024, representing the largest regional share globally and demonstrating the region's critical importance to manufacturers and industrial operators.
Outpacing Global Growth :
At 5.1% CAGR through 2029, Asia Pacific's steam trap market grows 24% faster than the global average of 4.1%, driven by accelerating industrialization and manufacturing expansion across emerging economies.
China & India Dominance :
China (USD 739.4M) and India (USD 627.6M) together represent 91% of the Asia Pacific market, with their combined growth trajectory fueling regional expansion and attracting significant capital investment.
Energy Efficiency Mandates :
Stringent government regulations on energy consumption and industrial emissions across Asia Pacific are accelerating steam trap adoption, creating sustained demand for advanced condensate management solutions.
Asia Pacific Steam Trap Market Dynamics
- This growth trajectory reflects the region's rapid industrialization, particularly in China and India, where manufacturing infrastructure investments continue to accelerate.
- Energy efficiency mandates and rising operational costs are compelling industrial facilities to upgrade steam systems with modern trap technologies. Key growth drivers include expanding petrochemical, pharmaceutical, and food processing sectors across emerging economies, coupled with increasing awareness of energy conservation benefits.
- The region's competitive manufacturing landscape and rising labor costs are incentivizing automation and efficiency improvements, further boosting steam trap demand.
- Strategic investments in industrial infrastructure and government support for sustainable manufacturing practices will sustain the 5.1% CAGR through 2029..
Market Ecosystem
Related Ecosystem
Industrial Automation
- Sensors
- Image Sensors
- Manufacturing Execution System (MES)
- Actuators
- Flow Sensors
- Siemens ag
- ABB India Limited
- Emerson Electric Co.
- HONEYWELL INTERNATIONAL INC.
- SCHNEIDER ELECTRIC SE
Industrial Equipment
- HVAC System
- Fiberglass
- Actuators
- Cartridge Filters
- Electrostatic Precipitators
- Siemens ag
- GRUNDFOS GROUP
- ABB India Limited
- SCHNEIDER ELECTRIC SE
- Eaton Corporation plc
Smart Home
- Sensors
- Pressure Sensors
- Temperature Sensors
- Actuators
- Face Recognition
- HONEYWELL INTERNATIONAL INC.
- SCHNEIDER ELECTRIC SE
- Siemens ag
- Samsung
- Godrej Industries Limited
Key Takeaways
- Asia Pacific steam trap market grows at 5.1% CAGR from 2024 to 2029, reaching USD 1,934.6 million.
- Asia Pacific's growth rate exceeds global average, driven by industrial expansion and energy efficiency initiatives.
- Asia Pacific demand is concentrated in petrochemical, pharmaceutical, and food processing sectors.
- Asia Pacific manufacturers increasingly adopt IoT-enabled steam traps and predictive maintenance solutions.
Steam Trap Market Report Scope
| Report Metric | Details |
|---|---|
| Base Year | 2024 |
| Fastest Growing Segment | LIQUID EXPANSION STEAM TRAPS (Thermostatic) |
| Forecast Period | 2024-2029 |
| Growth Rate | CAGR of 4.1% from 2024 to 2029 |
| Largest Segment | STEEL (Body Material) |
| Market Size Base Year (Billions) | ~USD 4.56 (2024) |
| Revenue Forecast (Billions) | ~USD 5.57 (2029) |
| Segments Covered | Product Type, Mechanical, Body Material, End-Use Industry, Thermodynamic, Thermostatic, Connection, Pressure, Size, Application |
Asia Pacific Steam Trap Market Report Segmentation
10 segment dimensions are covered across the global market.
By Product Type
- Mechanical
- Thermodynamic
- Thermostatic
By Mechanical
- Ball Float Steam Traps
- Inverted Bucket Steam Traps
By Body Material
- Iron
- Other Body Materials
- Steel
By End-Use Industry
- Chemicals
- Energy & Power
- Food & Beverages
- Oil & Gas
- Other End-Use Industries
- Pharmaceuticals
- Textiles
By Thermodynamic
- Disc Steam Traps
- Piston Type Steam Traps
By Thermostatic
- Balanced Pressure Steam Traps
- Bellows Steam Traps
- Bimetallic Steam Traps
- Liquid Expansion Steam Traps
By Connection
- Flanged
- Other Connections
- Screwed
- Socket Welded
By Pressure
- >10 Bars-<= 25 Bars
- >25 Bars
- <= 10 Bars
By Size
- >Dn 25-<=Dn 65
- >Dn 65
- <=Dn 25
By Application
- Drip
- Process
- Tracing
Target Audience
- Industrial Equipment Manufacturers : Manufacturers need Asia Pacific market data to develop region-specific steam trap products, understand competitive landscapes in China and India, and plan production capacity for high-growth markets.
- Energy Efficiency Consultants : Consultants require detailed market insights to advise industrial clients on steam system optimization, justify investments in modern steam traps, and demonstrate ROI across Asia Pacific facilities.
- Investment & Private Equity Firms : Investors need comprehensive regional analysis to evaluate acquisition targets, assess market growth potential, and identify strategic opportunities in Asia Pacific's expanding industrial sector.
- Facility & Operations Managers : Operations leaders need market data to benchmark steam trap performance, justify capital expenditures to leadership, and understand best practices adopted across Asia Pacific industrial facilities.
- Distribution & Channel Partners : Distributors require country-level market sizing and growth forecasts to optimize inventory, identify high-potential regions like India and China, and align sales strategies with regional demand.
Countries within Asia Pacific - compare and drill down
| Country | 2025 size (native) |
|---|---|
| China | USD 739.4 Million |
| India | USD 627.6 Million |
| Japan | USD 402 Million |
| Rest Of Asia Pacific | USD 165.6 Million |
Country market size visualization
Reasons to Buy this Report
- Regional Market Dominance Data : Gain comprehensive insights into Asia Pacific's USD 1,510M market with country-level breakdowns for China, India, Japan, and emerging markets to identify high-growth opportunities.
- Competitive Positioning Intelligence : Understand market dynamics across the fastest-growing region globally, enabling strategic positioning against competitors and informed entry strategies for Asia Pacific expansion.
- Growth Trajectory Forecasting : Access detailed 5-year projections through 2029 showing 5.1% CAGR, supporting capital allocation decisions and long-term business planning in the region's high-growth industrial sector.
- Emerging Market Opportunities : Identify untapped potential in India (USD 627.6M) and Rest of Asia Pacific (USD 165.6M) where rapid industrialization and energy mandates are creating new customer segments.
- Regulatory & Compliance Insights : Understand energy efficiency mandates and industrial regulations driving steam trap adoption across Asia Pacific, enabling compliant product development and market-aligned marketing strategies.
Frequently asked questions
What is the current size of the Asia Pacific steam trap market?
The Asia Pacific steam trap market was valued at USD 1,510.0 million in 2024.
What is the projected market size for Asia Pacific steam traps by 2029?
Asia Pacific's steam trap market is forecast to reach USD 1,934.6 million by 2029.
What is the CAGR for Asia Pacific's steam trap market?
Asia Pacific's steam trap market is expected to grow at a CAGR of 5.1% between 2024 and 2029.
Which industries drive demand for steam traps in Asia Pacific?
Asia Pacific steam trap demand is primarily driven by petrochemical, pharmaceutical, food processing, and manufacturing sectors.
How does Asia Pacific's growth compare to global steam trap market growth?
Asia Pacific's 5.1% CAGR exceeds the global CAGR of 4.1%, indicating faster regional expansion.
RESEARCH METHODOLOGY
The study involved major activities in estimating the current market size for the steam trap market. Exhaustive secondary research was done to collect information on the steam trap industry. The next step was to validate these findings, assumptions, and sizing with industry experts across the value chain using primary research. Different approaches, such as top-down and bottom-up, were employed to estimate the total market size. After that, the market breakup and data triangulation procedures were used to estimate the market size of the segments and subsegments of the steam trap market.
Secondary Research
The market for the companies offering steam trap is arrived at by secondary data available through paid and unpaid sources, analyzing the product portfolios of the major companies in the ecosystem, and rating the companies by their performance and quality. Various sources were referred to in the secondary research process to identify and collect information for this study. The secondary sources include annual reports, press releases, investor presentations of companies, white papers, journals, certified publications, and articles from recognized authors, directories, and databases. In the secondary research process, various secondary sources were referred to for identifying and collecting information related to the study. Secondary sources included annual reports, press releases, and investor presentations of vendors, forums, certified publications, and whitepapers. The secondary research was used to obtain critical information on the industry's value chain, the total pool of key players, market classification, and segmentation from the market and technology-oriented perspectives.
Primary Research
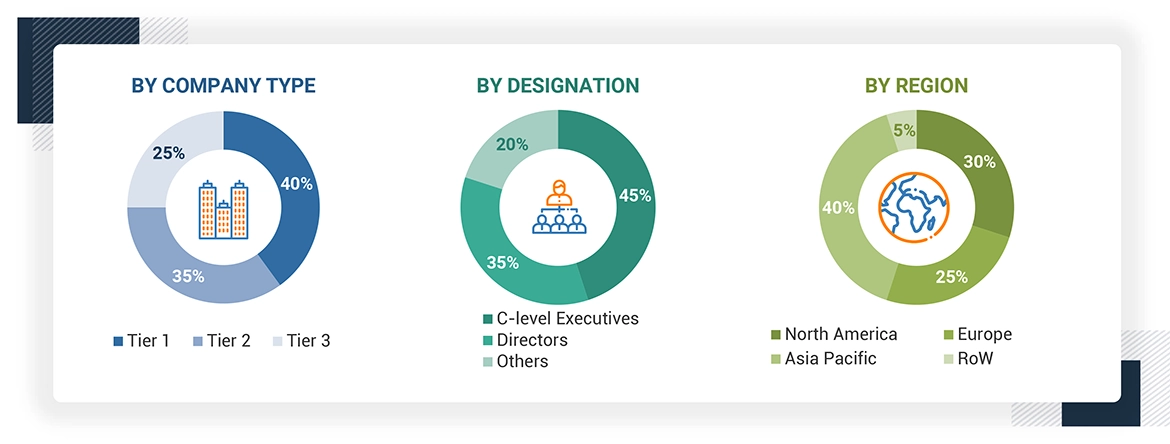
Extensive primary research has been conducted after understanding and analyzing the current scenario of the steam trap market through secondary research. Several primary interviews have been conducted with the key opinion leaders from the demand and supply sides across four main regions—North America, Europe, Asia Pacific, and the Rest of Europe. Approximately 30% of the primary interviews were conducted with the demand-side respondents, while approximately 70% were conducted with the supply-side respondents. The primary data has been collected through questionnaires, emails, and telephone interviews.
After interacting with industry experts, brief sessions were conducted with highly experienced independent consultants to reinforce the findings from our primary. This, along with the in-house subject matter experts’ opinions, has led us to the findings as described in the remainder of this report. The breakdown of primary respondents is as follows:
About the assumptions considered for the study, To know download the pdf brochure
Market Size Estimation
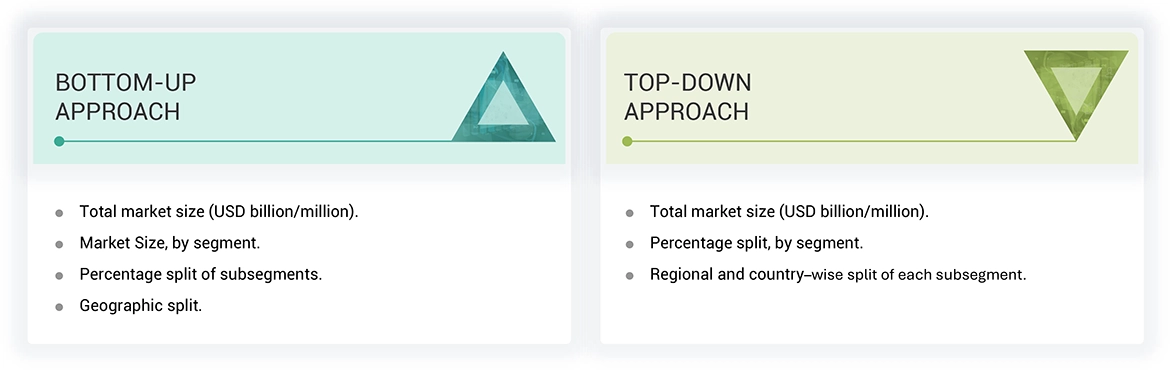
Both top-down and bottom-up approaches wete used to estimate and validate the total size of the steam trap market. These methods were also used extensively to estimate the size of various subsegments in the market. The research methodology used to estimate the market size includes the following:
Steam Trap Market : Top-Down and Bottom-Up Approach
Data Triangulation
After arriving at the overall market size using the market size estimation processes as explained above, the market was split into several segments and subsegments. The data triangulation and market breakdown procedures were employed, wherever applicable, to complete the overall market engineering process and arrive at the exact statistics of each market segment and subsegment. The data was triangulated by studying various factors and trends from the demand and supply sides.
Market Definition
A steam trap is an automatic device designed to eliminate condensate and non-condensable gases from a steam system while ensuring that live steam is not released. Functioning as an automatic valve, it opens to permit condensate discharge and closes to safeguard against live steam leakage. The presence of steam traps is crucial for the efficient functioning of steam systems.
Key Stakeholders
- End users
- Government bodies, venture capitalists, and private equity firms
- Steam trap manufacturers
- Steam trap distributors
- Steam trap industry associations
- Professional service/solution providers
- Research institutions and organizations
- Standards organizations and regulatory authorities
- System integrators
- Technology consultants
Report Objectives
- To describe and forecast the steam trap market, in terms of value, based on product type, connection, body material, pressure, size, application and end use industry
- To forecast the size of the steam trap market in terms of volume
- To forecast the market size, in terms of value, for four main regions—North America, Europe, Asia Pacific, and the RoW (Rest of the World)
- To provide detailed information regarding drivers, restraints, opportunities, and challenges influencing the market growth
- To provide a detailed overview of the value chain of the steam trap ecosystem
- To strategically analyze micromarkets1 with respect to individual growth trends, prospects, and contributions to the total market
- To analyze the opportunities for stakeholders and details of the competitive landscape of the market
- To strategically profile the key players and comprehensively analyze their market positions in terms of ranking and core competencies2
- To analyze the major growth strategies implemented by key market players, such as agreements, acquisitions, product launches, expansions, and partnerships
- To study the impact of AI on the market under study, along with macroeconomic outlook for each region
Available Customizations
With the given market data, MarketsandMarkets offers customizations according to the specific requirements of companies. The following customization options are available for the report:
- Detailed analysis and profiling of additional market players based on various blocks of the supply chain
Get the Full Steam Trap Market Report
Full forecast, segment splits, and company analysis for all Steam Trap Market.
- US Steam Trap Market
- Canada Steam Trap Market
- Mexico Steam Trap Market
- Germany Steam Trap Market
- UK Steam Trap Market
- France Steam Trap Market
- China Steam Trap Market
- India Steam Trap Market
- Japan Steam Trap Market
- Rest Of Europe Steam Trap Market
- Rest Of Asia Pacific Steam Trap Market
- GCC Steam Trap Market
Need a Tailored Report?
Customize this report to your needs
Get 10% FREE Customization
Customize This Report
