
Europe Theranostics Market (2023-2028)

The Europe Theranostics Market was valued at $288.1 Million in 2023 and projected to reach to $698 Million by 2028, representing a compound annual growth rate of 19.4%. Europe's theranostics market is poised for substantial expansion through 2028, driven by advancing healthcare infrastructure, supportive regulatory environments, and widespread adoption of precision medicine strategies.


| Market Size in | USD 26.32 MN |
| Market Forecast in | |
| CAGR | |
| Forecast Period | |
| Units Considered | Value (USD MN) |
Europe Theranostics Market Trends and Insights
- Europe is positioned as a key regional hub for theranostics innovation, driven by advanced healthcare infrastructure, regulatory support, and increasing adoption of precision medicine across member states.
- The European market is projected to nearly double to $698.0 million by 2028, reflecting accelerating demand for integrated diagnostic and therapeutic solutions. Europe's theranostics sector benefits from substantial investment in oncology and nuclear medicine applications, supported by favorable reimbursement policies and clinical validation across major markets.
- Europe continues to lead in regulatory harmonization through the European Medicines Agency, enabling faster market entry for novel theranostic agents.
- The region's emphasis on personalized healthcare and companion diagnostics is driving sustained growth, with Europe expected to maintain its competitive advantage in theranostics development and commercialization through the forecast period..
Key Market Statistics
- CAGR (2023-2028) 19.4% CAGR
- Market Size, 2023 ~USD 288.1 Million
- Forecast, 2028 ~USD 698 Million
- Geography Europe
Europe Theranostics Market Overview
Market Valuation & Growth :
Europe's theranostics market reached $288.1 million in 2023 and is projected to grow to $698.0 million by 2028, representing a robust 19.4% CAGR—significantly outpacing the global average of 15.5%.
Advanced Healthcare Infrastructure :
Europe benefits from world-class healthcare systems, sophisticated diagnostic capabilities, and established reimbursement frameworks that accelerate theranostics adoption across member states.
Regulatory Support & Innovation Hub :
Strong regulatory frameworks from the European Medicines Agency (EMA) and commitment to precision medicine initiatives position Europe as a leading innovation center for theranostic development and commercialization.
Precision Medicine Adoption :
Increasing integration of precision medicine into clinical practice across European healthcare systems drives demand for theranostic solutions that combine diagnostic and therapeutic capabilities.
Europe Theranostics Market Dynamics
- The region's strong pharmaceutical and diagnostic sectors, combined with increasing investment in personalized treatment approaches, create favorable conditions for theranostic innovation and market penetration. Key European markets including Germany, UK, and France are leading adoption, supported by robust healthcare spending and clinical integration initiatives.
- The projected near-doubling of market value reflects growing recognition of theranostics' clinical and economic benefits, with European healthcare providers increasingly incorporating these solutions into standard treatment protocols for oncology and other therapeutic areas..
Market Ecosystem
Related Ecosystem
Pharmaceuticals
- Bioreactors
- Analytical Testing
- Bioanalytical Testing Services
- Cell Counters
- Data Management Services
- Thermo Fisher Scientific Inc.
- SANOFI
- Merck KGaA
- NOVARTIS
- Pfizer Inc.
Key Takeaways
- Europe's theranostics market is valued at $288.1 million in 2023 and is forecast to reach $698.0 million by 2028, representing a 19.4% CAGR.
- Europe leads in regulatory innovation and EMA approval pathways, accelerating theranostic agent commercialization across the region.
- Oncology and nuclear medicine applications dominate Europe's theranostics adoption, supported by strong clinical evidence and reimbursement frameworks.
- Europe's commitment to precision medicine and companion diagnostics positions the region as a global innovation center for theranostics development.
Theranostics Market Report Scope
| Report Metric | Details |
|---|---|
| Base Year | 2023 |
| Fastest Growing Segment | THERANOSTICS CENTERS (End User) |
| Forecast Period | 2023-2028 |
| Growth Rate | CAGR of 15.5% from 2023 to 2028 |
| Largest Segment | RADIOPHARMACEUTICALS (Product) |
| Market Size Base Year (Billions) | ~USD 2.09 (2023) |
| Revenue Forecast (Billions) | ~USD 4.3 (2028) |
| Segments Covered | Product, Type, Application, End User |
Europe Theranostics Market Report Segmentation
4 segment dimensions are covered across the global market.
By Product
- Diagnostic Imaging
- Ivd/Biomarker Screening
- Radiopharmaceuticals
- Software & Services
By Type
- Iodine-131
- Lutetium-177
- Other Radiopharmaceuticals
- Radium-223
- Samarium-153
- Yttrium-90
By Application
- Bone Metastasis
- Other Applications
- Other Cancer
- Other Cancers
- Prostate Cancer
By End User
- Hospitals And Cancer Care Centers
- Research And Academic Centers
- Theranostics Centers
EUROPE: THERANOSTICS MARKET, BY END USER, 2021–2028
| Segment | 2021 | 2022 | 2023 | 2024 | 2025 | 2026 | 2027 | 2028 | CAGR (%) |
|---|---|---|---|---|---|---|---|---|---|
| HOSPITALS AND CANCER CARE CENTERS | 371.4 | 402.2 | 443.8 | 502.6 | 579 | 661.2 | 751.5 | 844.3 | 13.7 |
| RESEARCH AND ACADEMIC CENTERS | 77.6 | 83.2 | 90.9 | 102 | 116.4 | 131.6 | 148.1 | 164.7 | 12.6 |
| THERANOSTICS CENTERS | 23.6 | 26.6 | 30.4 | 35.7 | 42.6 | 50.3 | 59.1 | 68.5 | 17.6 |
| TOTAL | 472.6 | 512 | 565.1 | 640.3 | 738 | 843.1 | 958.6 | 1077.5 | 13.8 |
Target Audience
- Pharmaceutical & Biotech Companies : Strategic decision-makers need Europe-specific market intelligence to guide R&D investments, clinical trial planning, and commercial launch strategies for theranostic products.
- Diagnostic & Medical Device Manufacturers : Product managers and business development teams require detailed European market data to assess competitive positioning, identify partnership opportunities, and plan market expansion.
- Healthcare Investors & Private Equity : Investment professionals need comprehensive regional analysis to evaluate theranostics companies, assess market growth potential, and identify acquisition or funding opportunities in Europe.
- Healthcare Providers & Hospital Networks : Clinical leaders and procurement teams use market insights to evaluate theranostic solutions, understand adoption trends, and make informed technology integration decisions.
- Regulatory & Policy Advisors : Consultants and policy experts require detailed European market context to advise on regulatory strategies, reimbursement positioning, and healthcare system alignment across member states.
Countries within Europe - compare and drill down
| Country | 2025 size (native) |
|---|---|
| Germany | USD 454.4 Million |
| UK | USD 170.7 Million |
| France | USD 163.8 Million |
| Rest Of Europe | USD 222.7 Million |
Country market size visualization
Reasons to Buy this Report
- Regional Market Sizing & Forecasts : Obtain precise market valuations for Europe ($288.1M in 2023) and country-level breakdowns including Germany, UK, and France, with detailed 5-year projections through 2028.
- Competitive Landscape Analysis : Understand key European players, market consolidation trends, and competitive positioning within the region's theranostics ecosystem to inform strategic partnerships and market entry strategies.
- Regulatory & Reimbursement Insights : Access comprehensive analysis of EMA regulations, national reimbursement policies, and healthcare system dynamics across major European markets to navigate compliance and pricing strategies.
- Clinical Adoption Trends : Identify adoption patterns, clinical integration pathways, and healthcare provider preferences across European countries to optimize product development and commercialization approaches.
- Growth Opportunity Assessment : Leverage detailed market segmentation and growth drivers specific to Europe to identify high-potential therapeutic areas, geographic expansion opportunities, and investment priorities.
Frequently asked questions
What is the current size of Europe's theranostics market?
Europe's theranostics market was valued at $288.1 million in 2023 and is projected to grow to $698.0 million by 2028.
What is the expected growth rate for theranostics in Europe?
Europe's theranostics market is expected to grow at a compound annual growth rate (CAGR) of 19.4% from 2023 to 2028.
Which therapeutic areas drive theranostics adoption in Europe?
Oncology and nuclear medicine are the primary therapeutic areas driving theranostics adoption in Europe, supported by clinical validation and reimbursement policies.
How does Europe's regulatory environment support theranostics growth?
Europe's European Medicines Agency (EMA) provides harmonized regulatory pathways that facilitate faster approval and commercialization of novel theranostic agents across member states.
What factors are accelerating theranostics market expansion in Europe?
Advanced healthcare infrastructure, precision medicine initiatives, companion diagnostic integration, and favorable reimbursement frameworks are key drivers of theranostics growth in Europe.
RESEARCH METHODOLOGY
The study involved four major activities in estimating the current size of the theranostics market. Exhaustive secondary research was done to collect information on the market, peer, and parent markets. The next step was to validate these findings, assumptions, and sizing with industry experts across the value chain through primary research. Both top-down and bottom-up approaches were employed to estimate the complete market size. After that, market breakdown and data triangulation were used to estimate the market size of segments and subsegments.
Secondary Research
The secondary research process involves the widespread use of secondary sources, directories, databases (such as Bloomberg Businessweek, Factiva, and D&B Hoovers), white papers, annual reports, company house documents, investor presentations, and SEC filings of companies. Secondary research was used to identify and collect information useful for the extensive, technical, market-oriented, and commercial theranostics market study. It was also used to obtain important information about the key players and market classification & segmentation according to industry trends to the bottom-most level, and key developments related to market and technology perspectives. A database of the key industry leaders was also prepared using secondary research.
Primary Research
In the primary research process, various supply and demand sources were interviewed to obtain qualitative and quantitative information for this report. The primary sources from the supply side include industry experts such as OEMs, CEOs, vice presidents, marketing and sales directors, technology & innovation directors, and related key executives from various key companies and organizations in the theranostics market. The primary sources from the demand side include medical CDMOs, oncologists, doctors, radiologists, technicians, and service providers. Primary research was conducted to validate the market segmentation, identify key players, and gather insights on key industry trends & key market dynamics.
A breakdown of the primary respondents is provided below:
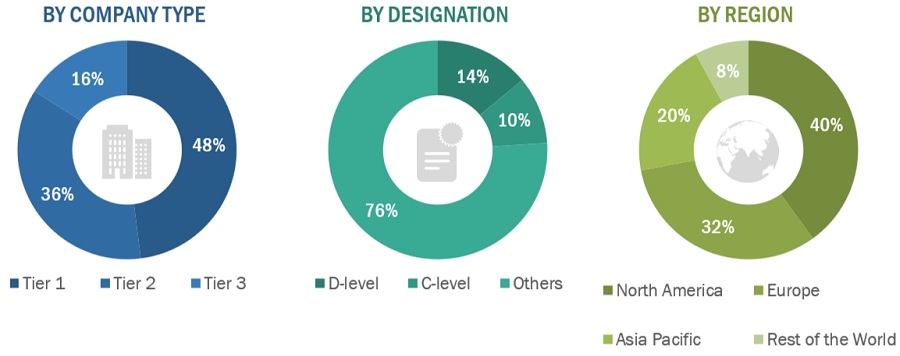
*Others include sales managers, marketing managers, business development managers, product managers, distributors, and suppliers.
Note: Companies are classified into tiers based on their total revenue. As of 2021, Tier 1 = >USD 1,000 million, Tier 2 = USD 500–1,000 million, and Tier 3 = <USD 500 million.
To know about the assumptions considered for the study, download the pdf brochure
Market Estimation Methodology
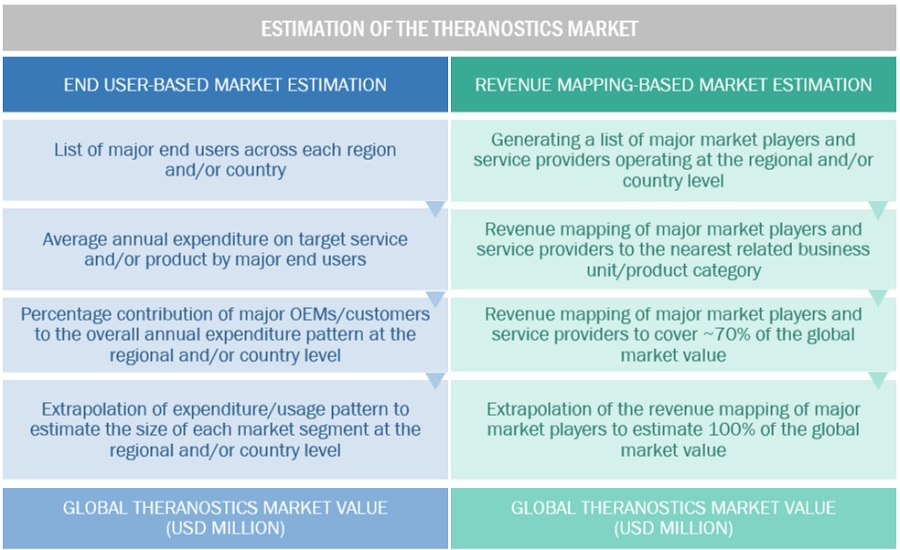
In this report, the theranostics market’s size was determined using the revenue share analysis of leading players. For this purpose, key players in the market were identified, and their revenues from the market business were determined through various insigh ts gathered during the primary and secondary research phases. Secondary research included the study of the annual and financial reports of the top market players. In contrast, primary research included extensive interviews with key opinion leaders, such as CEOs, directors, and key marketing executives.
Segmental revenues were calculated based on the revenue mapping of major solution/service providers to calculate the global market value. This process involved the following steps:
- Generating a list of major global players operating in the theranostics market.
- Mapping annual revenues generated by major global players from the product segment (or nearest reported business unit/category)
- Revenue mapping of major players to cover a major share of the global market share, as of 2022
- Extrapolating the global value of the theranostics market industry
Data Triangulation
After arriving at the overall market size from the market size estimation process explained above, the global theranostics market was split into segments and subsegments. Data triangulation and market breakdown procedures were employed to complete the overall market engineering process and arrive at the exact statistics for all segments and subsegments. The data was triangulated by studying various factors and trends from both the demand and supply sides. Additionally, the market was validated using top-down and bottom-up approaches.
Market Definition
Theranostics is a term used for diagnosis and therapy. Theranostics can be broadly defined as a combination of molecularly targeted imaging and therapy, whereas imaging helps to gain information regarding presence of targeted moleculaes on cell surface and therapy progression. Radiotheranostics involves the use of radionuclide/radiopharmaceutical that delivers targeted radiation to kill the cancerous cells and imaging modality such as positron emission tomography (PET) is used to locate the cancer. FDA approved theranostics procedures are performed for different applications such as prostate cancer, neuroendocrine tumor, etc. These procedures are mainly performed in hospitals, cancer care centers, and theranostics centers.
Key Stakeholders
- Senior Management
- End Users
- R&D Department
- Finance/Procurement Department
Objectives of the Study
- To define, describe, and forecast the size of theranostics market based on product, application, end user, and region
- To provide detailed information regarding the major factors influencing the growth potential of the global market (drivers, restraints, opportunities, challenges, and trends)
- To analyze the micro markets with respect to individual growth trends, prospects, and contributions to the global market.
- To analyze key growth opportunities in the global market for key stakeholders and provide details of the competitive landscape for market leaders
- To forecast the size of market segments and/or subsegments with respect to three major regions, namely, North America (US and Canada), Europe (Germany, France, the UK, and the RoE), Asia Pacific (Japan, China, India, and the RoAPAC), and Rest of the World (Latin America and Middle East and Africa).
- To profile the key players in the market and comprehensively analyze their market shares and core competencies.
- To track and analyze the competitive developments undertaken in the global market, such as product launches; agreements; expansions; and mergers & acquisitions.
Available Customizations
With the given market data, MarketsandMarkets offers customizations per the company’s specific needs. The following customization options are available for the present global theranostics market report:
Product Analysis
- Product matrix, which gives a detailed comparison of the product portfolios of the top fifteen companies
Company Information
- Detailed analysis and profiling of additional market players (up to five)
Geographic Analysis
- Further breakdown of the Rest of Europe theranostics market into Italy, Spain Russia, Belgium, the Netherlands, Switzerland, Austria, Finland, Sweden, Poland, and Portugal, among others
- Further breakdown of the Rest of Asia Pacific theranostics market into Australia, South Korea, Singapore, Taiwan, New Zealand, Philippines, Malaysia, and other APAC countries
Get the Full Theranostics Market Report
Full forecast, segment splits, and company analysis for all Theranostics Market.
Need a Tailored Report?
Customize this report to your needs
Get 10% FREE Customization
Customize This Report
