
Indonesia Time-Sensitive Networking Market (2025-2030)

The Indonesia Time-Sensitive Networking Market was valued at $5.7 Million in 2025 and projected to reach to $31.4 Million by 2030, representing a compound annual growth rate of 40.9%. Indonesia's Time-Sensitive Networking market stands at an inflection point, with 40.9% CAGR growth reflecting the nation's accelerating digital transformation in manufacturing.


| Market Size in | USD 26.32 MN |
| Market Forecast in | |
| CAGR | |
| Forecast Period | |
| Units Considered | Value (USD MN) |
Indonesia Time-Sensitive Networking Market Trends and Insights
- This represents a compound annual growth rate of 40.9%, significantly outpacing global trends and reflecting Indonesia's increasing adoption of advanced industrial automation and real-time communication technologies.
- Indonesia's strategic position in Southeast Asia's manufacturing and digital infrastructure development is driving demand for deterministic networking solutions across automotive, industrial IoT, and telecommunications sectors. The forecast period from 2025 to 2030 marks a critical transformation for Indonesia's technology landscape.
- Indonesia is witnessing accelerated investment in smart manufacturing and Industry 4.0 initiatives, which necessitate time-sensitive networking capabilities for mission-critical applications.
- Indonesia's growing semiconductor ecosystem and expanding electronics manufacturing base are creating substantial opportunities for TSN-enabled devices and infrastructure.
- The market's 5.5x growth trajectory underscores Indonesia's emergence as a key regional hub for next-generation networking technologies..
Key Market Statistics
- CAGR (2025-2030) 40.9% CAGR
- Market Size, 2025 ~USD 5.7 Million
- Forecast, 2030 ~USD 31.4 Million
- Country Indonesia
Indonesia Time-Sensitive Networking Market Overview
Explosive Growth Trajectory :
Indonesia's TSN market is projected to grow from $5.7 million in 2025 to $31.4 million by 2030, representing a 40.9% CAGR that exceeds global growth rates and signals strong regional momentum.
Industrial Automation Adoption :
Rapid expansion driven by Indonesia's manufacturing sector embracing Industry 4.0 technologies, with TSN enabling real-time communication critical for smart factories and automated production lines across Java and Sumatera regions.
Strategic Geographic Position :
Indonesia's role as a major Southeast Asian manufacturing hub positions it as a key market for time-sensitive networking solutions, attracting investments from global semiconductor and industrial automation vendors.
Real-Time Communication Demand :
Growing need for deterministic, low-latency networking in automotive, electronics, and food processing industries drives TSN adoption as manufacturers seek competitive advantages through enhanced operational efficiency.
Indonesia Time-Sensitive Networking Market Dynamics
- The market's expansion is underpinned by increasing investments in smart factory infrastructure, rising labor costs driving automation adoption, and government initiatives supporting Industry 4.0 development across key industrial zones. Looking ahead to 2030, Indonesia's TSN market will be shaped by growing integration of IoT devices, expanding 5G infrastructure enabling wireless TSN applications, and rising demand from multinational manufacturers establishing regional production hubs.
- Local semiconductor companies and system integrators are emerging as key players, while foreign vendors are establishing partnerships to capture this high-growth opportunity in Southeast Asia's largest economy..
Market Ecosystem
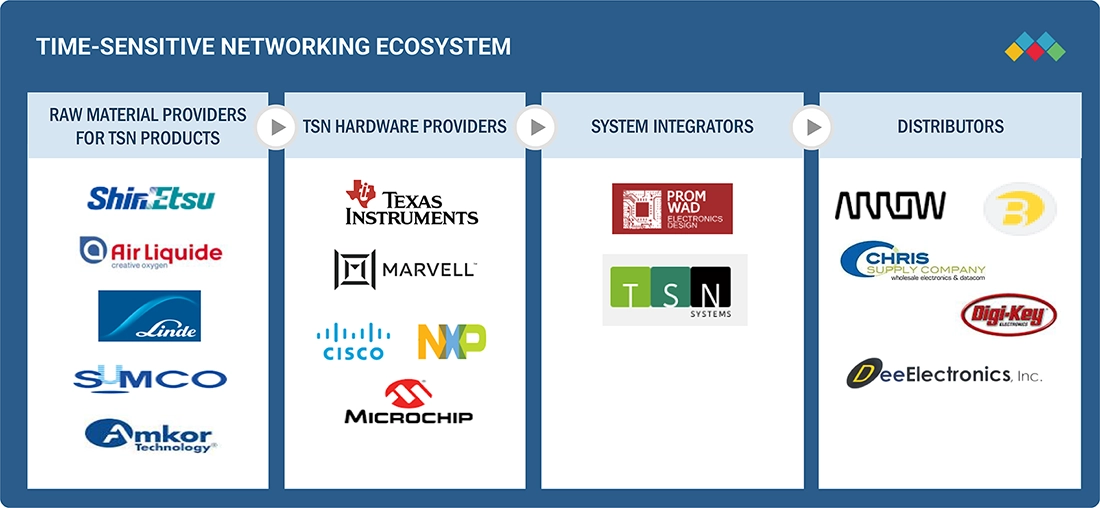
Time-Sensitive Networking Market: COMMERCIAL USE CASES ACROSS INDUSTRIES
| COMPANY | USE CASE DESCRIPTION | BENEFITS |
|---|---|---|
 |
Processors and Ethernet PHYs used in factory robots and motion controllers | Enable real-time synchronization, reduce communication jitter, and ensure precise motor control in industrial automation |
 |
Automotive Ethernet switches and MCUs integrated into zonal and domain controllers | Support deterministic data flow for ADAS and infotainment systems, enhancing safety and in-vehicle user experience |
 |
TSN-enabled industrial switches in PLCs and edge devices for synchronized machine communication | Improve data reliability and timing accuracy across machines, enabling seamless operation in smart manufacturing environments |
 |
TSN-integrated Ethernet switch SoCs used in smart factories and autonomous mobile robots (AMRs) | Deliver low-latency, high-reliability data paths critical for autonomous navigation and safety systems |
 |
TSN-compliant switch ICs embedded in industrial gateways and connected vehicle platforms | Facilitate deterministic networking for mixed-criticality applications, ensuring real-time performance and secure data flow |
Logos and trademarks shown above are the property of their respective owners. Their use here is for informational and illustrative purposes only.
Related Ecosystem
Cyber Security
- Cloud Security
- Biometric Systems
- Data Loss Prevention (DLP)
- Multi-Factor Authentication
- Security Analytics
- International Business Machines Corporation
- MITSUI BUSSAN SECURE DIRECTIONS INC
- Cisco Systems, Inc.
- MICROSOFT CORPORATION
- Allot Ltd.
Communication And Connectivity Technology
- Sensors
- Smart Card & Readers
- Cellular Network
- Femtocell
- Image Sensors
- Cisco Systems, Inc.
- HUAWEI TECHNOLOGIES CO LTD
- Lenovo
- CommScope Holding Company, Inc.
- Nokia corporation
Key Takeaways
- Indonesia's TSN market is projected to grow from $5.7M (2025) to $31.4M (2030) at a 40.9% CAGR, driven by industrial automation adoption.
- Indonesia's manufacturing sector modernization and Industry 4.0 initiatives are primary catalysts for time-sensitive networking demand.
- Indonesia's semiconductor and electronics manufacturing base positions the country as a critical regional market for TSN infrastructure.
- Indonesia's 5.5x market expansion over five years reflects accelerating digital transformation across automotive, industrial IoT, and telecom sectors.
Time-Sensitive Networking Market Report Scope
| Report Metric | Details |
|---|---|
| Base Year | 2025 |
| Fastest Growing Segment | IEEE 802.11BE (Type) |
| Forecast Period | 2025-2030 |
| Growth Rate | CAGR of 40.7% from 2025 to 2030 |
| Largest Segment | IEEE 802.1AS (Type) |
| Market Size Base Year (Billions) | ~USD 0.36 (2025) |
| Revenue Forecast (Billions) | ~USD 1.97 (2030) |
| Segments Covered | Type, Component, End User |
Indonesia Time-Sensitive Networking Market Report Segmentation
3 segment dimensions are covered across the global market.
By Type
- Ieee 802.11Be
- Ieee 802.1As
- Ieee 802.1Cb
- Ieee 802.1Cm
- Ieee 802.1Qbu
- Ieee 802.1Qcc
- Ieee802.1Qbv
- Other Types
By Component
- Controllers And Processors
- Hubs, Routers, And Gateways
- Isolators And Converters
- Switches
By End User
- Aerospace
- Automotive
- Industrial
- Oil & Gas
- Other End Users
- Telecom & Data Center
- Transportation
INDONESIA: TIME-SENSITIVE NETWORKING MARKET, BY END USER, 2025–2030
| Segment | 2025 | 2026 | 2027 | 2028 | 2029 | 2030 | CAGR (%) |
|---|---|---|---|---|---|---|---|
| AEROSPACE | 0.19 | 0.26 | 0.35 | 0.47 | 0.64 | 0.88 | 35.5 |
| AUTOMOTIVE | 1.37 | 1.94 | 2.76 | 3.95 | 5.68 | 8.19 | 43.1 |
| INDUSTRIAL | 2.29 | 3.22 | 4.55 | 6.44 | 9.17 | 13.09 | 41.7 |
| OIL & GAS | 0.67 | 0.93 | 1.29 | 1.81 | 2.54 | 3.58 | 39.7 |
| OTHER END USERS | 0.12 | 0.14 | 0.17 | 0.2 | 0.23 | 0.25 | 16 |
| TELECOM & DATA CENTER | 0.3 | 0.4 | 0.54 | 0.74 | 1.01 | 1.39 | 36.3 |
| TRANSPORTATION | 0.72 | 1.01 | 1.42 | 2 | 2.83 | 4.03 | 41.1 |
| TOTAL | 5.66 | 7.91 | 11.09 | 15.62 | 22.1 | 31.41 | 40.9 |
Target Audience
- Manufacturing Equipment Vendors : Need Indonesia-specific TSN market data to develop localized product strategies, identify key customer segments in automotive and electronics manufacturing, and plan regional sales and support infrastructure.
- Industrial Automation Integrators : Require detailed market insights to assess Indonesia's smart factory opportunity, benchmark competitive positioning, and develop service offerings aligned with local manufacturing modernization initiatives and Industry 4.0 adoption.
- Semiconductor & Networking Companies : Seek Indonesia market analysis to evaluate expansion opportunities, identify distribution partnerships, and understand demand for TSN-enabled chips and networking solutions in the region's growing industrial base.
- Private Equity & Investment Firms : Need comprehensive Indonesia TSN market data to evaluate acquisition targets, assess portfolio company growth potential, and identify emerging technology companies positioned to capitalize on 40.9% CAGR expansion.
- Government & Policy Organizations : Require market intelligence to inform Industry 4.0 policy development, assess technology adoption rates, and align infrastructure investments with Indonesia's manufacturing competitiveness and digital transformation goals.
Reasons to Buy this Report
- Quantified Market Sizing : Access precise market valuations for Indonesia's TSN sector with validated 2025-2030 projections, enabling accurate budget allocation and ROI forecasting for regional expansion strategies.
- Competitive Intelligence : Identify emerging local and international competitors establishing footholds in Indonesia's high-growth TSN market, with insights into partnership opportunities and market entry strategies specific to the region.
- Sector-Specific Demand Drivers : Understand Indonesia-specific adoption catalysts including automotive manufacturing growth, electronics production expansion, and government Industry 4.0 initiatives driving TSN implementation across key industrial clusters.
- Investment Decision Support : Leverage detailed market analysis to justify capital investments in Indonesian manufacturing facilities, technology partnerships, and distribution networks with confidence in 40.9% CAGR growth potential.
- Regional Market Differentiation : Distinguish Indonesia's TSN market dynamics from broader Southeast Asian trends, identifying unique opportunities in automotive, electronics, and food processing verticals with localized growth trajectories.
Frequently asked questions
What is the current market size of Time-Sensitive Networking in Indonesia?
Indonesia's Time-Sensitive Networking market was valued at $5.7 million in 2025 and is expected to grow to $31.4 million by 2030.
What is the projected growth rate for Indonesia's TSN market?
Indonesia's TSN market is projected to grow at a compound annual growth rate (CAGR) of 40.9% from 2025 to 2030.
Which industries are driving TSN adoption in Indonesia?
Indonesia's automotive, industrial IoT, telecommunications, and smart manufacturing sectors are the primary drivers of time-sensitive networking adoption.
Why is Indonesia's TSN market growing faster than the global average?
Indonesia's rapid industrialization, Industry 4.0 investments, and expanding electronics manufacturing ecosystem are accelerating TSN adoption beyond global growth rates.
What is the forecast market size for Indonesia's TSN market in 2030?
Indonesia's Time-Sensitive Networking market is forecasted to reach $31.4 million by 2030, representing a 5.5x increase from 2025 levels.
RESEARCH METHODOLOGY
The study used four major activities to estimate the time-sensitive networking market size. Exhaustive secondary research was conducted to gather information on the market and its peer and parent markets. The next step was to validate these findings, assumptions, and market size with industry experts across the value chain through primary research. Both top-down and bottom-up approaches were employed to estimate the total market size. Finally, market breakdown and data triangulation methods were used to estimate the market size for different segments and subsegments.
Secondary Research
In the secondary research process, various sources were used to identify and collect information on the time-sensitive networking market. Secondary sources for this research study include corporate filings (such as annual reports, investor presentations, and financial statements); trade, business, and professional associations; white papers; certified publications; and articles by recognized authors, directories, and databases. The secondary data was collected and analyzed to determine the overall market size, and was further validated through primary research.
List of key secondary sources
|
Source |
Web Link |
|
UK Competitive Telecommunications Association |
www.ukcta.org.uk |
|
ASTM International |
www.astm.org |
|
European Research Council |
www.erc.europa.eu |
|
World Trade Organization |
www.wto.gov |
|
International Trade Centre (ITC) |
www.intracen.org |
|
United States Telecom Association |
www.ustelecom.org |
Primary Research
Primary interviews were conducted to gather insights on market statistics, revenue data, market breakdowns, size estimations, and forecasting. Additionally, primary research was used to comprehend various technologies, types, applications, and regional trends. Interviews with stakeholders from the demand side, including CIOs, CTOs, CSOs, and customer/end user installation teams using time-sensitive networking offerings and processes, were also conducted to understand their perspective on suppliers, products, component providers, and their current and future use of time-sensitive networking, which will impact the overall market. Several primary interviews were conducted across major countries in North America, Europe, Asia Pacific, and RoW.
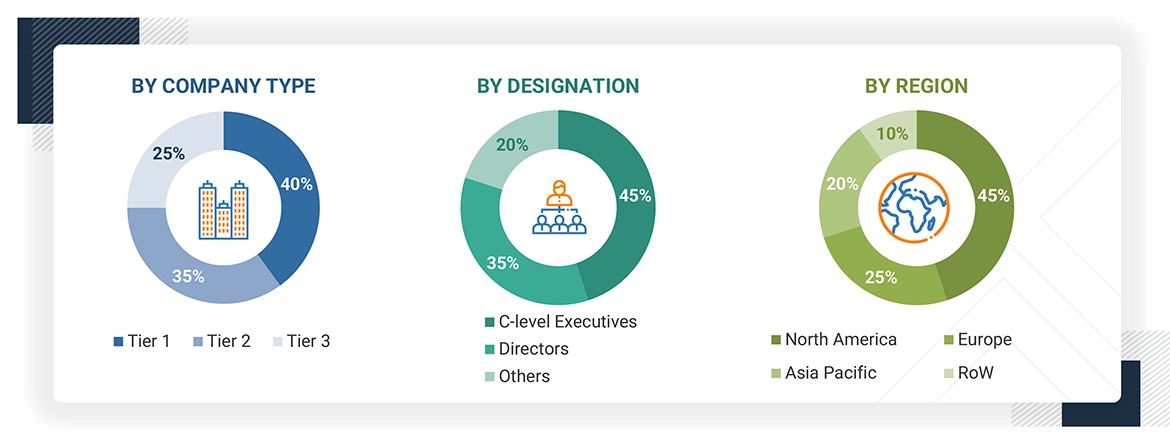
To know about the assumptions considered for the study, download the pdf brochure
Market Size Estimation
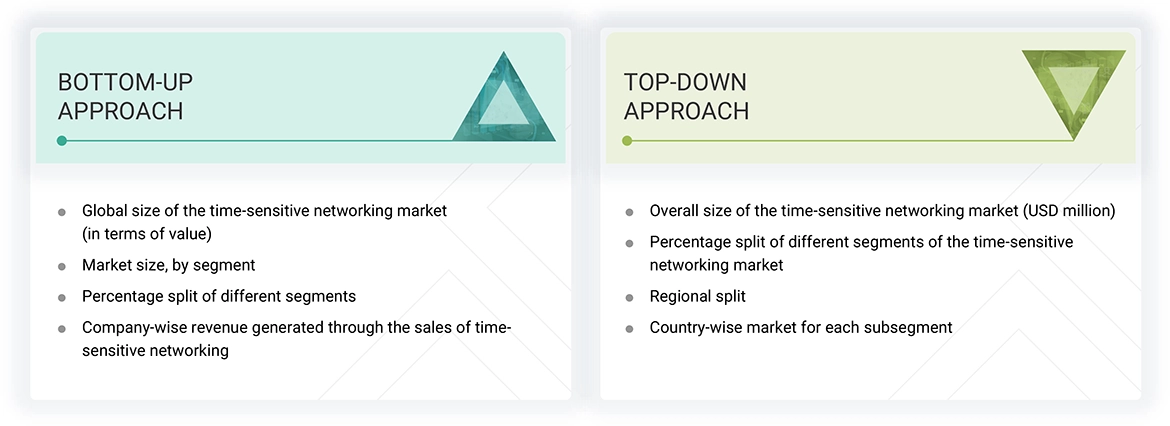
In the complete market engineering process, top-down and bottom-up approaches and several data triangulation methods have been used to estimate and forecast the overall market segments and subsegments listed in this report. Key players in the market have been identified through secondary research, and their market shares in the respective regions have been determined through primary and secondary research. This entire procedure included the study of annual and financial reports of the top market players and extensive interviews for key insights (quantitative and qualitative) with industry experts (CEOs, VPs, directors, and marketing executives).
All percentage shares, splits, and breakdowns have been determined using secondary sources and verified through primary sources. All the parameters affecting the markets covered in this research study have been accounted for, viewed in detail, verified through primary research, and analyzed to obtain the final quantitative and qualitative data. This data has been consolidated and supplemented with detailed inputs and analysis from MarketsandMarkets and presented in this report. The following figure represents this study's overall market size estimation process.
Time-Sensitive Networking Market : Top-Down and Bottom-Up Approach
Data Triangulation
Once the overall size of the time-sensitive networking market has been determined using the methods described above, it has been divided into multiple segments and subsegments. Market engineering has been performed for each segment and subsegment using market breakdown and data triangulation methods, as applicable, to obtain accurate statistics. Various factors and trends from the demand and supply sides have been studied to triangulate the data. The market size has been validated using both top-down and bottom-up approaches..
Market Definition
Time-sensitive networking is a set of IEEE 802.1 standards that aim to determine the standard Ethernet networks, initially designed for best-effort communication. It provides time synchronization, low-latency communication, and quality of service (QoS) for real-time industrial applications such as factory automation, automotive systems, and avionics. With time-sensitive networking, periodic and aperiodic data can be transmitted over the same network, enabling a wide range of applications to coexist on a single Ethernet infrastructure. Time-sensitive networking is becoming increasingly popular in industrial communication systems, as it offers a cost-effective, standardized, and flexible solution that can enhance system performance, reliability, and safety.
Key Stakeholders
- Providers of components and materials for time-sensitive networking products
- Distributors, suppliers, and service providers for time-sensitive networking products
- Technology standards organizations, forums, alliances, and associations
- End users from various sectors such as industrial automation, automotive, and energy and power
- Research organizations
- Analysts and strategic business planners
- Venture capitalists, private equity firms, and start-up companies
Report Objectives
- To describe and forecast the time-sensitive networking market, by type, component, end user, and region, in terms of value
- To describe and forecast the market for various segments across four main regions, namely, North America, Europe, Asia Pacific, and RoW, in terms of value
- To strategically analyze micromarkets with regard to individual growth trends, prospects, and contributions to the markets
- To provide detailed information regarding drivers, restraints, opportunities, and challenges influencing market growth
- To analyze opportunities for stakeholders by identifying high-growth segments in the market
- To provide a detailed overview of the time-sensitive networking value chain
- To strategically analyze key technologies, average selling price trends, trends impacting customer business, ecosystem, regulatory landscape, patent landscape, Porter's Five Forces, import and export scenarios, trade landscape, key stakeholders, buying criteria, and case studies pertaining to the market under study
- To strategically profile key players in the time-sensitive networking market and comprehensively analyze their market share and core competencies
- To analyze competitive developments such as partnerships, acquisitions, expansions, collaborations, and product launches, along with R&D in the time-sensitive networking market
Available Customizations:
With the given market data, MarketsandMarkets offers customizations according to the specific requirements of companies. The following customization options are available for the report:
- Detailed analysis and profiling of additional market players (up to 5)
- Additional country-level analysis of the time-sensitive networking market
Product Analysis
- The product matrix provides a detailed comparison of the product portfolio of each company in the time-sensitive networking market.
Get the Full Time-Sensitive Networking Market Report
Full forecast, segment splits, and company analysis for all Time-Sensitive Networking Market.
- US Time-Sensitive Networking Market
- Canada Time-Sensitive Networking Market
- Mexico Time-Sensitive Networking Market
- Germany Time-Sensitive Networking Market
- UK Time-Sensitive Networking Market
- France Time-Sensitive Networking Market
- Italy Time-Sensitive Networking Market
- Spain Time-Sensitive Networking Market
- China Time-Sensitive Networking Market
- Japan Time-Sensitive Networking Market
- South Korea Time-Sensitive Networking Market
- India Time-Sensitive Networking Market
- Australia Time-Sensitive Networking Market
- Malaysia Time-Sensitive Networking Market
- Thailand Time-Sensitive Networking Market
- Vietnam Time-Sensitive Networking Market
- Eastern Europe Time-Sensitive Networking Market
- Nordics Time-Sensitive Networking Market
- Rest Of Europe Time-Sensitive Networking Market
- Rest Of Asia Pacific Time-Sensitive Networking Market
- Romania Time-Sensitive Networking Market
- Hungary Time-Sensitive Networking Market
- Poland Time-Sensitive Networking Market
- Rest Of Eastern Europe Time-Sensitive Networking Market
- Slovakia Time-Sensitive Networking Market
- Ukraine Time-Sensitive Networking Market
- Bahrain Time-Sensitive Networking Market
- Kuwait Time-Sensitive Networking Market
- Oman Time-Sensitive Networking Market
- Qatar Time-Sensitive Networking Market
- Rest Of Middle East Time-Sensitive Networking Market
- Saudi Arabia Time-Sensitive Networking Market
- UAE Time-Sensitive Networking Market
- Rest Of Africa Time-Sensitive Networking Market
- South Africa Time-Sensitive Networking Market
Need a Tailored Report?
Customize this report to your needs
Get 10% FREE Customization
Customize This Report
