
Rest Of Asia Pacific Veterinary Software Market (2025-2030)

The Rest Of Asia Pacific Veterinary Software Market was valued at $21.8 Million in 2025 and projected to reach to $27.9 Million by 2030, representing a compound annual growth rate of 5.0%. The Rest Of Asia Pacific veterinary software market is positioned for steady expansion as veterinary practices increasingly recognize the value of digital solutions for operational efficiency and improved animal care.


| Market Size in | USD 26.32 MN |
| Market Forecast in | |
| CAGR | |
| Forecast Period | |
| Units Considered | Value (USD MN) |
Rest Of Asia Pacific Veterinary Software Market Trends and Insights
- Rest Of Asia Pacific represents a developing segment within the broader Asia Pacific region, where veterinary practices are increasingly adopting digital solutions to streamline operations, improve animal care delivery, and enhance business efficiency.
- The 5.0% compound annual growth rate reflects growing awareness among veterinary clinics and animal hospitals in Rest Of Asia Pacific regarding the benefits of integrated software platforms for appointment scheduling, medical records management, and billing operations. Driving this expansion in Rest Of Asia Pacific are rising pet ownership rates, increasing investment in animal healthcare infrastructure, and growing digitalization across emerging economies.
- Rest Of Asia Pacific veterinary practices are recognizing the competitive advantage of cloud-based and mobile-enabled software solutions that facilitate remote consultations and real-time data access.
- As Rest Of Asia Pacific continues to modernize its veterinary sector through technology adoption, demand for specialized software tailored to local regulatory requirements and operational workflows is expected to accelerate through 2030..
Key Market Statistics
- CAGR (2025-2030) 5.0% CAGR
- Market Size, 2025 ~USD 21.8 Million
- Forecast, 2030 ~USD 27.9 Million
- Country Rest Of Asia Pacific
Rest Of Asia Pacific Veterinary Software Market Overview
Market Valuation :
Rest Of Asia Pacific veterinary software market valued at $21.8 million in 2025, demonstrating significant growth potential in emerging veterinary markets across the region.
Steady Growth Trajectory :
Market projected to reach $27.9 million by 2030 with a 5% CAGR, reflecting increasing digitalization of veterinary practices in developing Asia Pacific economies.
Digital Adoption Drivers :
Rising adoption of software solutions among Rest Of Asia Pacific veterinary clinics to streamline operations, improve animal care delivery, and enhance business efficiency in competitive markets.
Regional Development Stage :
Rest Of Asia Pacific represents an emerging segment with untapped potential, as veterinary practices transition from manual processes to integrated digital management systems.
Rest Of Asia Pacific Veterinary Software Market Dynamics
- Growing pet ownership, rising disposable incomes, and increasing awareness of animal health standards are driving software adoption across the region's developing economies.
- Veterinary clinics are investing in cloud-based platforms, appointment scheduling systems, and electronic health records to enhance service delivery and client satisfaction. By 2030, the market is expected to grow from $21.8 million to $27.9 million, supported by improving healthcare infrastructure and technology accessibility.
- Key growth opportunities exist in smaller veterinary practices seeking affordable, scalable solutions tailored to regional needs.
- As competition intensifies and regulatory frameworks evolve, software providers focusing on localization, affordability, and customer support will capture significant market share in Rest Of Asia Pacific..
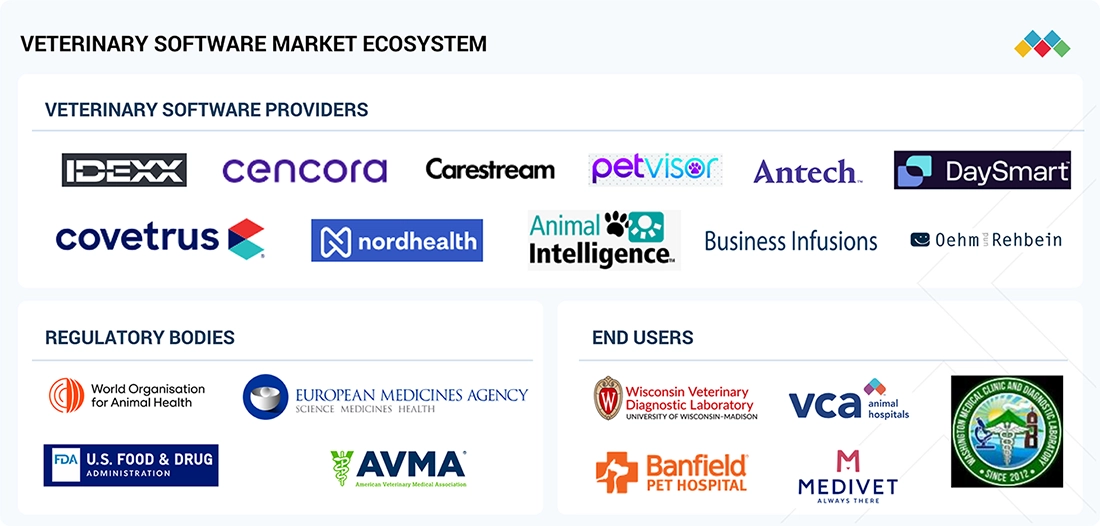
Market Ecosystem
VETERINARY SOFTWARE MARKET: COMMERCIAL USE CASES ACROSS INDUSTRIES
| COMPANY | USE CASE DESCRIPTION | BENEFITS |
|---|---|---|
 |
Offers cloud-based veterinary practice management solutions with integrated diagnostics, reporting, and billing. | Improves workflow efficiency, accelerates diagnostic decision-making, and reduces administrative burden. |
 |
Provides telehealth and client engagement platforms supporting virtual care, digital communications, and prescription support. | Enhances accessibility for pet owners, strengthens client relationships, and reduces reliance on in-clinic visits. |
 |
Offers a unified veterinary software platform (Pulse) that integrates scheduling, medical records, billing, and client communication. | Increases operational productivity, automates routine tasks, and improves overall clinic experience. |
 |
Provides veterinary imaging software for managing radiology workflows, image processing, and digital reporting. | Improves diagnostic accuracy, streamlines imaging tasks, and enables faster clinical decisions. |
 |
Offers cloud-based veterinary practice management software for scheduling, patient records, payments, and messaging. | Enables remote access, simplifies practice operations, and enhances client engagement. |
Logos and trademarks shown above are the property of their respective owners. Their use here is for informational and illustrative purposes only.
Related Ecosystem
Animal Health
- Polymerase Chain Reaction (PCR) Tests
- Porcine
- Immunodiagnostics
- Lateral Flow Assays
- Microarrays
- Zoetis Inc.
- Patterson Companies, Inc.
- Virbac
- Elanco Animal Health Incorporated
- BOEHRINGER INGELHEIM GMBH
Key Takeaways
- Rest Of Asia Pacific veterinary software market valued at $21.8 million in 2025, expanding to $27.9 million by 2030 at 5.0% CAGR
- Rest Of Asia Pacific practices increasingly adopt cloud-based and mobile-enabled solutions for operational efficiency and remote care delivery
- Rising pet ownership and healthcare infrastructure investment in Rest Of Asia Pacific are primary growth catalysts through 2030
- Rest Of Asia Pacific demand for localized, regulatory-compliant software solutions is driving competitive differentiation among vendors
Veterinary Software Market Report Scope
| Report Metric | Details |
|---|---|
| Base Year | 2025 |
| Fastest Growing Segment | VETERINARY TELEHEALTH SOFTWARE (Product) |
| Forecast Period | 2025–2030 |
| Growth Rate | CAGR of 6.9% from 2025 to 2030 |
| Largest Segment | WEB/CLOUD-BASED MODEL (Delivery Mode) |
| Market Size Base Year (Billions) | ~USD 1.53 (2025) |
| Revenue Forecast (Billions) | ~USD 2.14 (2030) |
| Segments Covered | Product, Delivery Mode, Practice Type, Type, End User |
Rest Of Asia Pacific Veterinary Software Market Report Segmentation
5 segment dimensions are covered across the global market.
By Product
- Client Engagement Software
- Livestock Farm Management Software
- Other Veterinary Software
- Veterinary Lims
- Veterinary Pacs
- Veterinary Practice Management Software
- Veterinary Telehealth Software
By Delivery Mode
- On-Premise/Hybrid Model
- On-Premise/Hybrid Models
- Web/Cloud-Based Model
- Web/Cloud-Based Models
By Practice Type
- Exclusive Large Animal Practices
- Exclusive Small Animal Practices
- Mixed Animal Practices
By Type
- Bovine Practices
- Equine Practices
- Integrated Software
- Predominantly Large Animal Practices
- Predominantly Small Animal Practices
- Standalone Software
By End User
- Corporate Veterinary Chains
- Independent Veterinary Clinics
- Other End Users
- Specialty & University Hospitals
- Veterinary Diagnostic Laboratories
Target Audience
- Veterinary Software Vendors : Software providers need Rest Of Asia Pacific market data to identify expansion opportunities, tailor product offerings for regional needs, and develop localized pricing strategies in this emerging market.
- Private Equity & Investors : Investment firms require detailed market analysis of Rest Of Asia Pacific to evaluate acquisition targets, assess growth potential, and make capital allocation decisions in the veterinary technology sector.
- Veterinary Practice Owners : Clinic operators in Rest Of Asia Pacific need market insights to benchmark their digital adoption, understand competitive software solutions, and make informed technology investment decisions.
- Market Research Consultants : Research professionals require Rest Of Asia Pacific-specific data to support client advisory services, competitive analysis, and strategic recommendations in the veterinary software space.
- Healthcare Technology Analysts : Industry analysts need comprehensive Rest Of Asia Pacific market information to track regional trends, forecast growth, and provide stakeholders with actionable intelligence on veterinary digitalization.
Key Companies in the Rest Of Asia Pacific Veterinary Software Market
| Company | HQ | Ownership | Strongest segments |
|---|---|---|---|
| MEDANEXT, INC. | Flagship software / platform offering,Implementation and integration services,Managed / recurring services, | ||
| ZOETIS INC | United States | Public Company | Companion animal pharmaceuticals (parasiticides, dermatology, pain, anti-infectives),Livestock pharmaceuticals and vaccines,Diagnostics (point-of-care, instruments, reagents, reference labs), |
| IDEXX LABORATORIES, INC. | United States | Public Company | Companion Animal Group diagnostics and reference labs,Veterinary software and services,Water Quality Products, |
| COVETRUS, INC. | United States | Private Company | Pharmaceuticals and wellness products (Rx and OTC),Veterinary equipment and hardware solutions,Veterinary software and platforms (practice management, diagnostics, payments, GreatPetCare), |
| NORDHEALTH | Norway | Public Company | Veterinary PMS (Provet, Vetserve, Sanimalis, Vetvision, Vetera),Therapist PMS (Diarium, EasyPractice, Psykbase),Physiotherapy PMS (Physica and related), |
| CENCORA, INC. | United States | Public Company | U.S. generic and branded pharmaceutical distribution,Specialty pharmaceuticals, oncology, plasma, vaccines, and physician services,Animal health distribution, |
MEDANEXT, INC.
Insufficient information provided to generate a business description.
ZOETIS INC
Zoetis Inc. is a publicly traded animal health company founded in 2012, headquartered in the United States, with approximately 14,500 employees.
IDEXX LABORATORIES, INC.
IDEXX Laboratories, Inc. is a publicly traded American company founded in 1983 that provides diagnostic and software solutions for veterinary and water testing markets, with approximately 11,000 employees.
COVETRUS, INC.
Covetrus, Inc. is a private American company founded in 2018 with approximately 4,873 employees that serves the veterinary and animal health industry.
NORDHEALTH
Nordhealth is a publicly traded Norwegian company founded in 2001 with approximately 457 employees.
CENCORA, INC.
Cencora, Inc. is a publicly traded American company founded in 1871 with approximately 49,000 employees that operates as a major healthcare and pharmaceutical distributor.
Reasons to Buy this Report
- Market-Specific Insights : Gain detailed understanding of Rest Of Asia Pacific's unique veterinary software landscape, including regional adoption patterns, competitive dynamics, and growth drivers specific to developing Asia Pacific economies.
- Investment Decision Support : Make informed investment and expansion decisions with precise market sizing ($21.8M in 2025) and reliable forecasts ($27.9M by 2030), enabling strategic resource allocation in this emerging segment.
- Competitive Positioning : Identify market gaps and opportunities in Rest Of Asia Pacific where veterinary software providers can differentiate through localized solutions, affordable pricing, and region-specific features.
- Growth Opportunity Assessment : Evaluate the 5% CAGR trajectory and understand which veterinary practice segments, technologies, and service models are driving adoption in Rest Of Asia Pacific's developing markets.
- Strategic Planning : Develop targeted go-to-market strategies for Rest Of Asia Pacific by understanding regional barriers, customer preferences, and infrastructure readiness for veterinary software solutions.
Frequently asked questions
What is the current market size of veterinary software in Rest Of Asia Pacific?
The Rest Of Asia Pacific veterinary software market is valued at $21.8 million in 2025 and is projected to grow to $27.9 million by 2030.
What is the growth rate for veterinary software in Rest Of Asia Pacific?
Rest Of Asia Pacific veterinary software market is growing at a compound annual growth rate (CAGR) of 5.0% from 2025 to 2030.
What factors are driving growth in the Rest Of Asia Pacific veterinary software market?
Key drivers in Rest Of Asia Pacific include rising pet ownership, increased investment in animal healthcare infrastructure, growing digitalization of veterinary practices, and demand for cloud-based operational solutions.
Which types of veterinary software solutions are most adopted in Rest Of Asia Pacific?
Rest Of Asia Pacific veterinary practices primarily adopt appointment scheduling, medical records management, billing and invoicing, and increasingly cloud-based and mobile-enabled platforms for remote consultations.
How does Rest Of Asia Pacific veterinary software market compare to other Asia Pacific regions?
Rest Of Asia Pacific represents a developing segment within Asia Pacific with a 5.0% CAGR, reflecting steady but measured adoption compared to more mature markets, driven by emerging economy dynamics and infrastructure development.
RESEARCH METHODOLOGY
This study extensively used both primary and secondary sources. The research involved studying various factors affecting the industry to identify segmentation types, industry trends, key players, competitive landscape, key market dynamics, and key player strategies.
Secondary Research
This research study involved the usage of comprehensive secondary sources, directories, databases such as Bloomberg Business, Factiva, and Dun & Bradstreet, white papers, annual reports, company house documents, investor presentations, and SEC filings of companies. Secondary research was used to identify and collect information useful for an extensive, technical, market-oriented, and commercial study of the infusion pump market. It was also used to identify key players in the market and classify and segment the industry based on trends to the most detailed level. Additionally, significant developments related to market and technology perspectives were noted. A database of the primary industry leaders was also created using secondary research.
Primary Research
In the primary research process, various sources from both the supply and demand sides were interviewed to obtain qualitative and quantitative information for this report. Primary sources from the supply side include project/sales/marketing/business development managers, presidents, CEOs, vice presidents, chairpersons, chief operating officers, chief strategy officers, directors, chief information officers, and chief medical information officers related to the veterinary software market. Primary sources from the demand side include healthcare professionals from veterinary hospitals, veterinary clinics, and veterinary diagnostic centers.
A breakdown of the primary respondents is provided below:
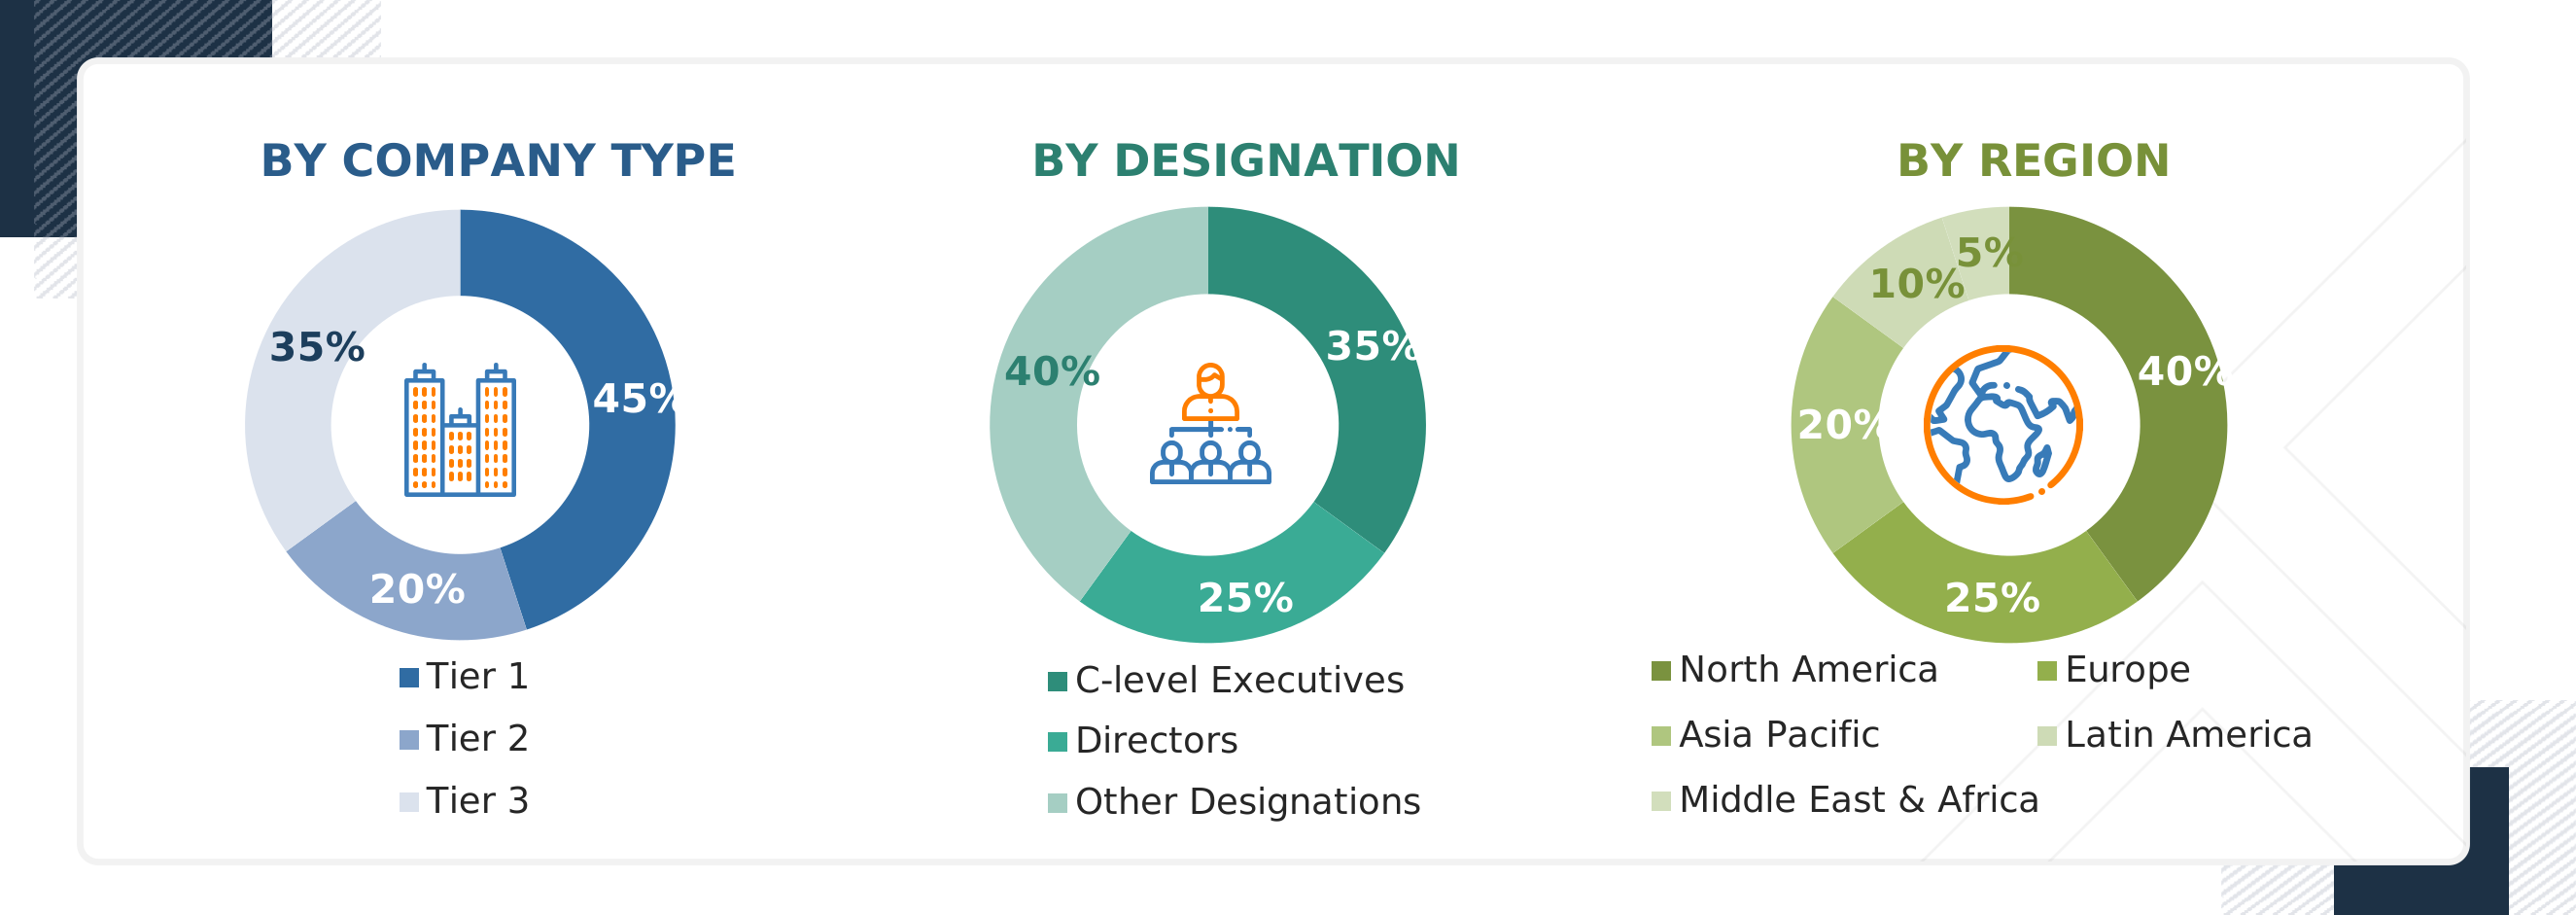
Note 1: C-level executives include CEOs, COOs, CTOs, and VPs.
Note 2: Other designations include sales, marketing, and product managers.
Note 3: Tiers are defined based on a company’s total revenue. As of 2024: Tier 1 = >USD 1 billion, Tier 2 = USD 500 million to USD 1 billion, and Tier 3 = < USD 500 million.
To know about the assumptions considered for the study, download the pdf brochure
Market Size Estimation
The total size of the veterinary software market was determined after data triangulation from three approaches, as mentioned below. After each approach, the weighted average of the three approaches was taken based on the level of assumptions used in each approach.
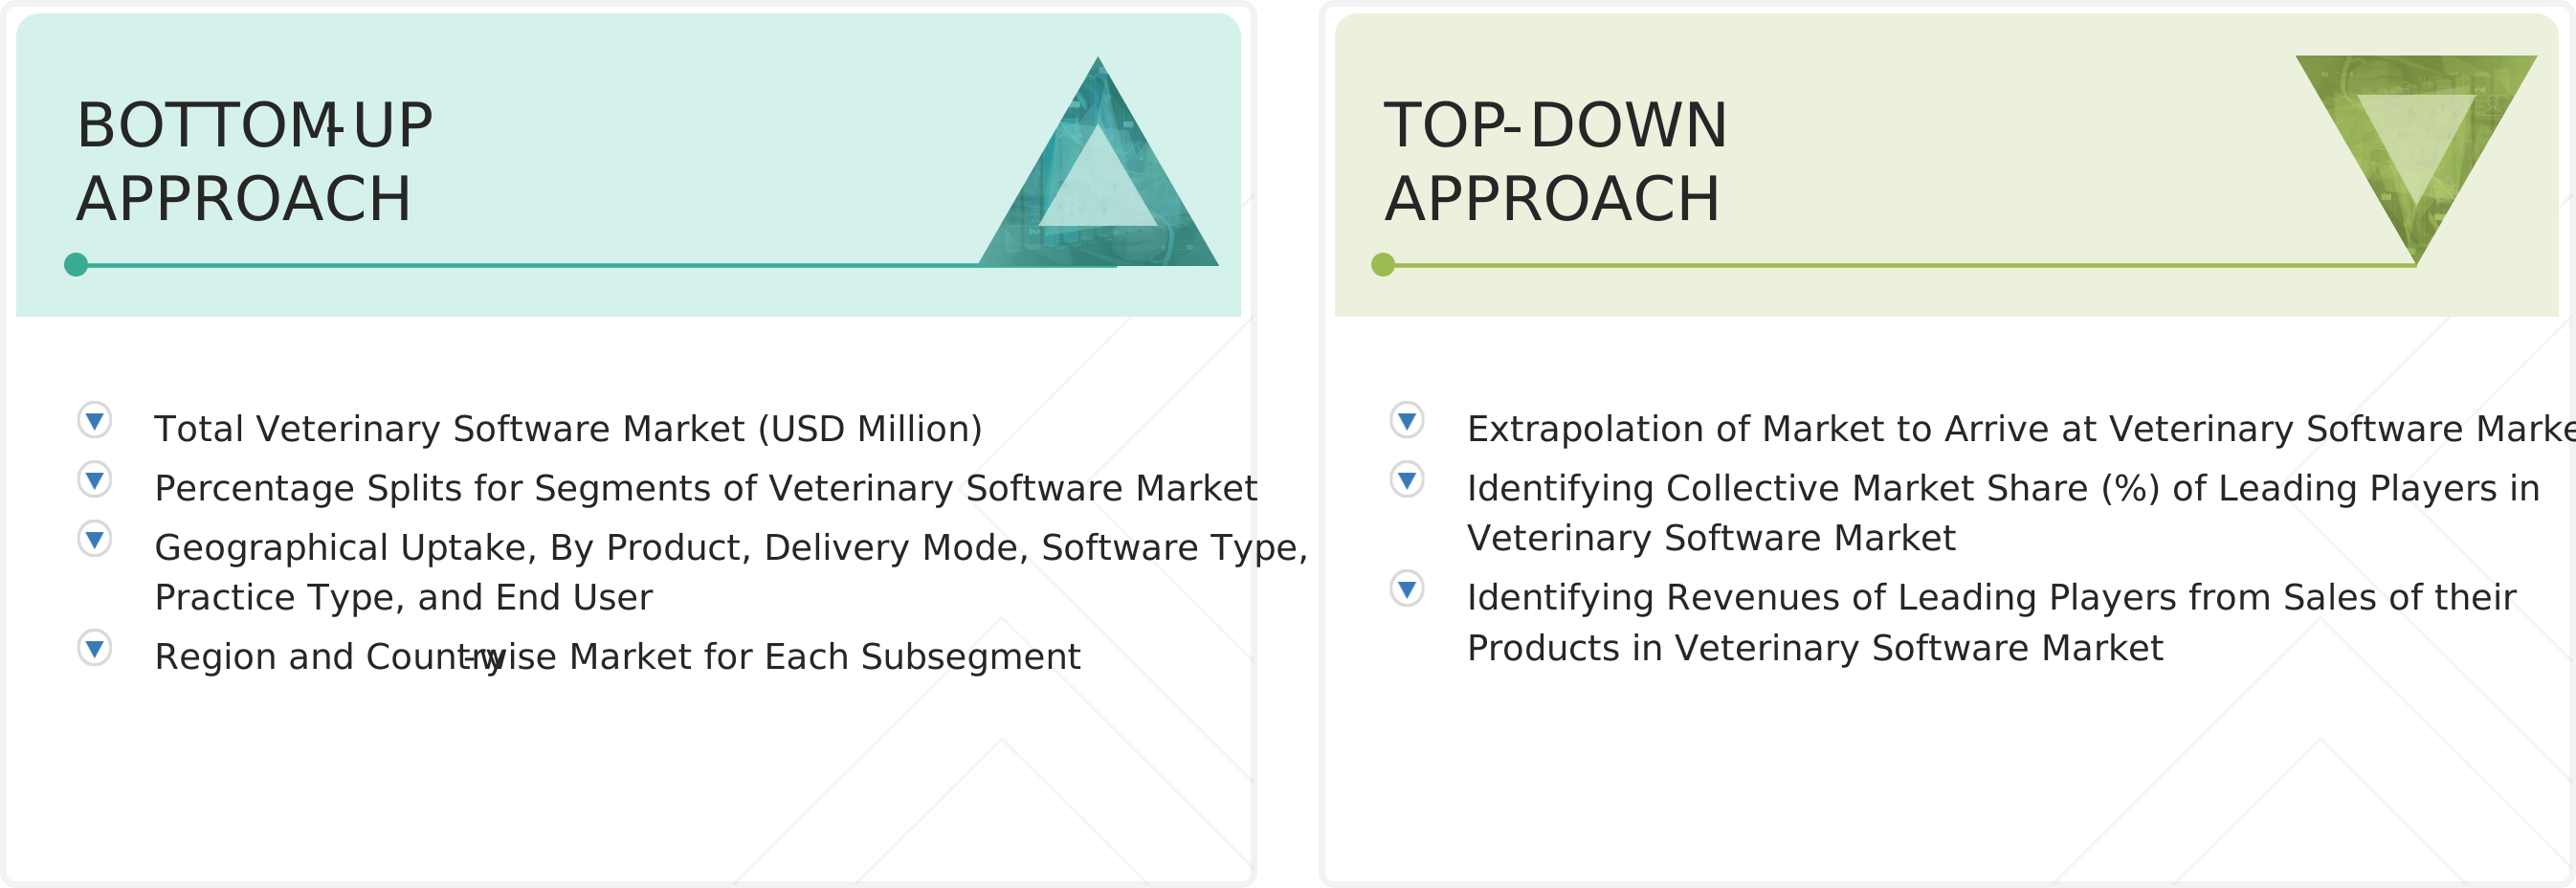
Data Triangulation
After arriving at the market size, the total market was divided into several segments and subsegments. Data triangulation and market breakdown procedures were employed wherever applicable to complete the overall market engineering process and arrive at the exact statistics for all segments and subsegments.
Market Definition
Veterinary software comprises specialized computer programs intentionally developed to optimize and augment diverse facets of veterinary practice administration and healthcare delivery. These comprehensive digital solutions integrate patient records management, appointment scheduling, billing, inventory administration, diagnostic imaging, telemedicine capabilities, and laboratory information systems with the overarching goal of enhancing operational effectiveness, data-driven decision-making, and superior animal healthcare provision in veterinary clinics, hospitals, and diagnostic laboratories.
Stakeholders
- Software Development Companies
- Veterinary Healthcare Institutions (Hospitals & Outpatient Clinics)
- Distributors and Suppliers of Veterinary software
- Research Institutes
- Health Insurance Payers
- Venture capitalists
- Market Research and Consulting Firms
- World Organization for Animal Health
- Organization for Economic Co-operation and Development (OECD)
Report Objectives
- To define, describe, and forecast the veterinary software market based on product, delivery mode, software type, practice type, end user, and region
- To provide detailed information regarding the major factors influencing market growth (such as drivers, restraints, opportunities, and challenges)
- To strategically analyze the micromarkets with respect to individual growth trends, prospects, and contributions to the total veterinary software market
- To analyze the opportunities in the market for stakeholders and provide details of the competitive landscape for market leaders
- To profile the key market players and comprehensively analyze their market shares and core competencies.
- To forecast the revenue of the market segments with respect to five main regions, namely, North America (US and Canada), Europe (Germany, France, UK, Italy, Spain, Netherlands, and Rest of Europe), the Asia Pacific (China, Japan, India, South Korea, New Zealand, Australia, Thailand, Vietnam, Indonesia and Rest of Asia Pacific), Latin America (Brazil, Mexico, and Rest of Latin America), and the Middle East & Africa [GCC Countries (Kingdom of Saudi Arabia, United Arab Emirates, and Rest Of GCC Countries) and Rest of Middle East & Africa
- To track and analyze competitive developments such as product launches & approvals, agreements, partnerships, expansions, acquisitions, and collaborations in the veterinary software market
Get the Full Veterinary Software Market Report
Full forecast, segment splits, and company analysis for all Veterinary Software Market.
- Canada Veterinary Software Market
- US Veterinary Software Market
- Germany Veterinary Software Market
- UK Veterinary Software Market
- France Veterinary Software Market
- Italy Veterinary Software Market
- Spain Veterinary Software Market
- Netherlands Veterinary Software Market
- China Veterinary Software Market
- Japan Veterinary Software Market
- India Veterinary Software Market
- Australia Veterinary Software Market
- South Korea Veterinary Software Market
- New Zealand Veterinary Software Market
- Thailand Veterinary Software Market
- Brazil Veterinary Software Market
- Mexico Veterinary Software Market
- Rest Of Europe Veterinary Software Market
- Rest Of Latin America Veterinary Software Market
Need a Tailored Report?
Customize this report to your needs
Get 10% FREE Customization
Customize This Report
