
Europe Virtual Power Plant Market (2024-2029)

The Europe Virtual Power Plant Market was valued at $581.84 Million in 2024 and projected to reach to $1757.68 Million by 2029, representing a compound annual growth rate of 24.7%. Europe's Virtual Power Plant market is positioned for exceptional growth through 2029, supported by stringent decarbonization policies and substantial investments in grid digitalization.


| Market Size in | USD 26.32 MN |
| Market Forecast in | |
| CAGR | |
| Forecast Period | |
| Units Considered | Value (USD MN) |
Europe Virtual Power Plant Market Trends and Insights
- This represents a compound annual growth rate of 24.7%, driven by Europe's aggressive renewable energy integration targets and grid modernization initiatives.
- Europe's regulatory framework, including the Clean Energy Package and Net Zero commitments, is accelerating VPP adoption across distributed energy resources, demand response, and battery storage systems. The European market benefits from high renewable penetration rates and mature digital infrastructure, positioning Europe as a global leader in VPP deployment.
- Europe's energy transition strategy emphasizes decentralized power generation and smart grid technologies, creating substantial opportunities for VPP solutions.
- Between 2024 and 2029, Europe is expected to see significant investment in aggregation platforms, IoT-enabled devices, and AI-driven optimization tools that enhance grid stability and energy efficiency across the continent..
Key Market Statistics
- CAGR (2024-2029) 24.7% CAGR
- Market Size, 2024 ~USD 581.84 Million
- Forecast, 2029 ~USD 1757.68 Million
- Geography Europe
Europe Virtual Power Plant Market Overview
Strong CAGR Growth :
Europe's Virtual Power Plant market is expanding at 24.7% CAGR from 2024 to 2029, outpacing the global average of 23.4%, driven by aggressive renewable energy targets and grid modernization across the continent.
Regulatory Support :
The EU's Clean Energy Package and Net Zero commitments create a favorable regulatory environment, mandating renewable integration and energy efficiency standards that accelerate VPP adoption across member states.
Market Valuation Growth :
Europe's VPP market is projected to grow from $581.84 million in 2024 to $1,757.68 million by 2029, representing a 202% increase in market value over the five-year forecast period.
Leading European Markets :
Germany ($462.97M) and the UK ($442.93M) lead Europe's VPP adoption, followed by Denmark ($365.25M) and France ($336.77M), reflecting strong renewable infrastructure and digital grid investments.
Europe Virtual Power Plant Market Dynamics
- The continent's commitment to achieving climate neutrality by 2050 necessitates advanced energy management solutions, making VPPs critical infrastructure for balancing renewable generation and demand.
- Leading economies like Germany and Denmark are pioneering VPP deployment, creating a competitive ecosystem that encourages innovation and attracts significant capital investment. The convergence of distributed renewable energy sources, smart grid technologies, and favorable regulatory frameworks creates a compelling growth narrative for European VPP markets.
- Utilities, aggregators, and energy service providers are increasingly adopting VPP solutions to optimize grid stability, reduce operational costs, and meet regulatory compliance requirements.
- This market expansion is expected to accelerate as battery storage costs decline and interoperability standards mature across European energy markets..
Market Ecosystem
Related Ecosystem
Decarbonization
- Battery Electric Vehicle (BEV)
- Energy Management Systems
- Fuel Cell
- Fuel Cell Electric Vehicle (FCEV)
- Geographical Information System (GIS)
- TotalEnergies SE
- Siemens ag
- Mitsui & Co., Ltd.
- General Electric Company
- Thyssenkrupp ag
Power Infrastructure
- Geographical Information System (GIS)
- Cogeneration
- Battery Electric Vehicle (BEV)
- Cellular Network
- Fuel Cell
- ABB India Limited
- Siemens ag
- SCHNEIDER ELECTRIC SE
- General Electric Company
- Eaton Corporation plc
Smart Energy And Digital Solutions
- Cellular Network
- Analytics Software
- Geographical Information System (GIS)
- Meter Data Management (MDM)
- Smart Meters
- Siemens ag
- SCHNEIDER ELECTRIC SE
- ABB India Limited
- General Electric Company
- Eaton Corporation plc
Key Takeaways
- Europe's Virtual Power Plant market will grow from $581.84M (2024) to $1,757.68M (2029) at a 24.7% CAGR, outpacing global growth.
- Europe's regulatory environment and Net Zero targets are primary catalysts accelerating VPP technology adoption across the region.
- Europe's mature digital infrastructure and high renewable penetration create competitive advantages for VPP solution providers.
- Europe's investment in smart grid modernization and distributed energy resources will drive sustained market expansion through 2029.
Virtual Power Plant Market Report Scope
| Report Metric | Details |
|---|---|
| Base Year | 2024 |
| Fastest Growing Segment | MIXED ASSET (Technology) |
| Forecast Period | 2024-2029 |
| Growth Rate | CAGR of 23.4% from 2024 to 2029 |
| Largest Segment | RENEWABLE ENERGY (Source) |
| Market Size Base Year (Billions) | ~USD 1.92 (2024) |
| Revenue Forecast (Billions) | ~USD 5.5 (2029) |
| Segments Covered | Technology, Vertical, Component, Source, Offering, Vertical 2019-2022 |
Europe Virtual Power Plant Market Report Segmentation
6 segment dimensions are covered across the global market.
By Technology
- Demand Response
- Mixed Asset
- Supply Side
By Vertical
- Commercial
- Industrial
- Industries
- Residential
By Component
- Hardware
- Services
- Software
By Source
- Cogeneration
- Renewable Energy
- Storage
By Offering
- Hardware
- Services
- Software
By Vertical 2019-2022
- Commercial
- Industrial
- Residential
EUROPE: VIRTUAL POWER PLANT MARKET, BY VERTICAL, 2023–2029
| Segment | 2023 | 2024 | 2025 | 2026 | 2027 | 2028 | 2029 | CAGR (%) |
|---|---|---|---|---|---|---|---|---|
| COMMERCIAL | 173.57 | 217.78 | 300.43 | 385.93 | 474.32 | 565.64 | 679.69 | 25.6 |
| INDUSTRIAL | 190.21 | 235.44 | 320.39 | 405.99 | 492.22 | 579.04 | 686.37 | 23.9 |
| RESIDENTIAL | 102.96 | 128.62 | 176.61 | 225.79 | 276.13 | 327.62 | 391.61 | 24.9 |
| TOTAL | 466.74 | 581.84 | 797.44 | 1017.72 | 1242.67 | 1472.3 | 1757.68 | 24.7 |
Target Audience
- Energy Utilities & Grid Operators : Utilities need Europe-specific VPP market data to optimize grid management, integrate renewables efficiently, and comply with EU regulatory mandates while improving operational efficiency.
- Energy Aggregators & Service Providers : Aggregators require detailed European market insights to identify growth opportunities, understand competitive dynamics, and develop region-specific business models for VPP deployment.
- Technology & Software Vendors : VPP software and IoT solution providers need European market analysis to guide product development, localization strategies, and go-to-market approaches across diverse regulatory environments.
- Investment & Private Equity Firms : Investors evaluating European energy infrastructure opportunities require comprehensive market sizing, growth forecasts, and competitive landscape data to support investment decisions and valuations.
- Government & Policy Makers : European policymakers and energy regulators need market intelligence to design effective incentive programs, assess VPP adoption rates, and align policies with renewable energy and climate objectives.
Countries within Europe - compare and drill down
| Country | 2025 size (native) |
|---|---|
| UK | USD 442.93 Million |
| Germany | USD 462.97 Million |
| France | USD 336.77 Million |
| Denmark | USD 365.25 Million |
| Turkey | USD 31.6 Million |
| Rest Of Europe | USD 149.75 Million |
Country market size visualization
Reasons to Buy this Report
- Country-Level Market Insights : Detailed market sizing and forecasts for Germany, UK, Denmark, France, and other European nations, enabling targeted investment and expansion strategies in high-growth markets.
- Regulatory Landscape Analysis : Comprehensive assessment of EU Clean Energy Package requirements, Net Zero commitments, and national policies driving VPP adoption across different European regulatory jurisdictions.
- Competitive Positioning : Identify leading VPP providers, aggregators, and technology platforms operating in Europe, with market share analysis and strategic positioning insights for competitive advantage.
- Growth Opportunity Mapping : Pinpoint emerging markets and underserved regions within Europe where VPP penetration is accelerating, supporting market entry and partnership development strategies.
- Technology & Investment Trends : Analyze key technology drivers including battery storage integration, AI-powered demand response, and smart grid connectivity shaping Europe's VPP market evolution through 2029.
Frequently asked questions
What is the current size of Europe's Virtual Power Plant market?
Europe's Virtual Power Plant market was valued at $581.84 million in 2024 and is projected to reach $1,757.68 million by 2029.
What is the growth rate for Europe's Virtual Power Plant market?
Europe's Virtual Power Plant market is expected to grow at a compound annual growth rate (CAGR) of 24.7% from 2024 to 2029.
What factors are driving growth in Europe's Virtual Power Plant market?
Europe's growth is driven by aggressive renewable energy targets, the Clean Energy Package, Net Zero commitments, grid modernization initiatives, and increasing adoption of distributed energy resources and smart grid technologies.
How does Europe's Virtual Power Plant market compare to global trends?
Europe's 24.7% CAGR exceeds the global average of 23.4%, reflecting Europe's leadership in renewable energy integration and regulatory support for VPP technologies.
What technologies are key to Europe's Virtual Power Plant market expansion?
Key technologies include aggregation platforms, IoT-enabled devices, AI-driven optimization tools, battery storage systems, and demand response solutions that enhance grid stability across Europe.
RESEARCH METHODOLOGY
The study involved major activities in estimating the current virtual power plant market size. Exhaustive secondary research was done to collect information on the peer and parent markets. The next step was to validate these findings, assumptions, and sizing with industry experts across the value chain through primary research. Both top-down and bottom-up approaches were employed to estimate the complete market size. Thereafter, market breakdown and data triangulation were used to estimate the market size of the segments and subsegments.
Secondary Research
This research study on the virtual power plant (VPP) market involved the use of extensive secondary sources, directories, and databases, such as Hoovers, Bloomberg, Businessweek, Factiva, International Energy Agency, and United States Energy Association, to identify and collect information useful for a technical, market-oriented, and commercial study of the global virtual power plant market. The other secondary sources included annual reports of the companies involved in the market, press releases & investor presentations of companies, white papers, certified publications, articles by recognized authors, manufacturer associations, trade directories, and databases.
Primary Research
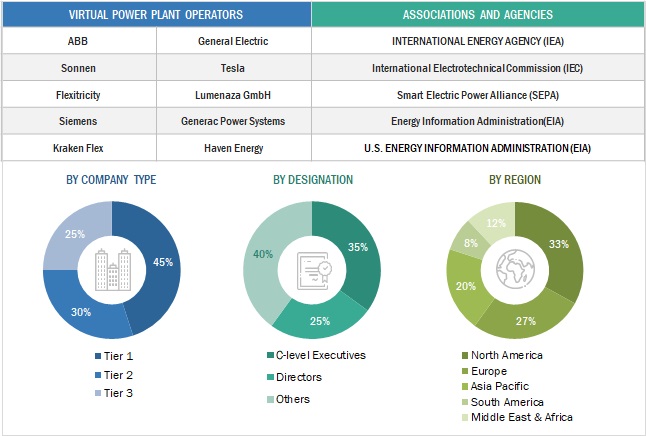
The virtual power plant (VPP) market comprises several stakeholders such as virtual power plant aggregators, manufacturers of subcomponents of virtual power plant, manufacturing technology providers, and technology support providers in the supply chain. The demand side of this market is characterized by the rising demand for energy efficiency. The supply side is characterized by rising demand for contracts from the automotive sector and mergers & acquisitions among big players. Various primary sources from both the supply and demand sides of the market were interviewed to obtain qualitative and quantitative information
Following is the breakdown of primary respondents:
To know about the assumptions considered for the study, download the pdf brochure
Virtual Power Plant Market Size Estimation
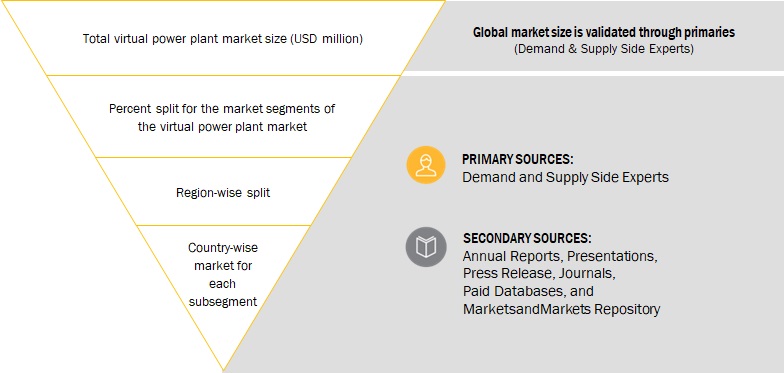
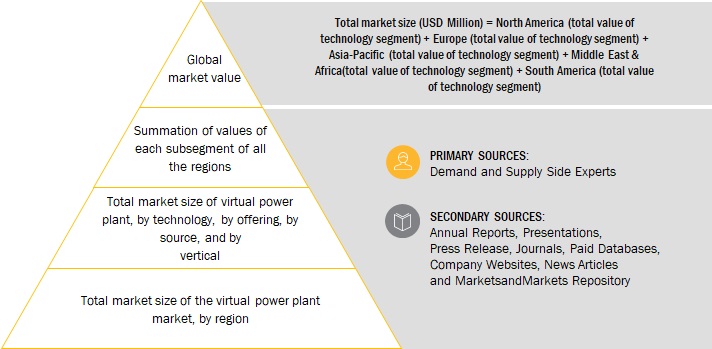
Both top-down and bottom-up approaches were used to estimate and validate the total size of the virtual power plant (VPP) market. These methods were also used extensively to estimate the size of various subsegments in the market. The research methodology used to estimate the market size includes the following:
- The key players in the industry and market have been identified through extensive secondary research, and their market share in the respective regions has been determined through both secondary and primary research.
- The industry’s value chain and market size, in terms of value, have been determined through primary and secondary research processes.
- All percentage shares, splits, and breakdowns have been determined using secondary sources and verified through primaries.
Global Virtual Power Plant Market Size: Top-down Approach
To know about the assumptions considered for the study, Request for Free Sample Report
Global Virtual Power Plant Market Size: Bottom-Up Approach
Data Triangulation
After arriving at the overall market size from the estimation process explained above, the total market has been split into several segments and subsegments. The complete market engineering process is done to arrive at the exact statistics for all the segments and subsegments, also data triangulation and market breakdown processes have been employed, wherever applicable. The data has been triangulated by examining various factors and trends from both the demand- and supply sides. Along with this, the market has been validated through both the top-down and bottom-up approaches.
Market Definition
A virtual power plant (VPP) is a cloud-based distributed power plant that aggregates heterogeneous distributed energy resources (DER) capacities for optimized power generation from existing sources, integration of various renewable energy sources, and, ultimately, trading or selling power in the electricity market. VPPs are networks of small energy-producing or storage devices, like solar panels and batteries, pooled together to serve the electricity grid. With their participants’ approval, their energy can be tapped by utilities during high demand or reserved for later. As a result, the desired power requirement can be met without large-scale power infrastructure upgrades. Virtual power plant solutions can be associated with concepts such as smart grid, microgrid, distributed generation, demand response, and advanced energy storage.
Key Stakeholders
- Public and Private Electric Utilities
- VPP Aggregators
- Distributed Energy Generation Solution Providers
- Virtual Power Plant Component Manufacturers
- Energy & Power Sector Consulting Companies
- Government & Research Organizations
- Independent Power Producers
- Investment Banks
- Electrical Equipment Associations
- Integrated Device Manufacturers (IDMs)
- Process Industries and Power and Energy Associations
- Energy Storage Device/Equipment Manufacturers and Integrators
- Distributed Energy Resource (DER) Owners
Objectives of the Study
- To define, describe, analyze, and forecast the size of the global virtual power plant (VPP) market by technology, vertical, source, offering and region, and in terms of value
- To forecast the market size for five key regions: North America, South America, Europe, Asia Pacific, and Middle East & Africa, along with their key countries
- To provide detailed information about the key drivers, restraints, opportunities, and challenges influencing the growth of the market
- To strategically analyze the subsegments with respect to individual growth trends, prospects, and contributions of each segment to the overall market size
- To analyze market opportunities for stakeholders and the competitive landscape of the market
- To strategically profile the key players and comprehensively analyze their market shares and core competencies
- To analyze competitive developments, such as sales contracts, agreements, investments, expansions, new product launches, mergers, partnerships, collaborations, and acquisitions, in the market
Available Customizations:
With the given market data, MarketsandMarkets offers customizations as per the client’s specific needs. The following customization options are available for this report:
Geographic Analysis
- Further breakdown of region or country-specific analysis
Company Information
- Detailed analyses and profiling of additional market players (up to 5)
Get the Full Virtual Power Plant Market Report
Full forecast, segment splits, and company analysis for all Virtual Power Plant Market.
- Canada Virtual Power Plant Market
- US Virtual Power Plant Market
- Australia Virtual Power Plant Market
- South Korea Virtual Power Plant Market
- Japan Virtual Power Plant Market
- UK Virtual Power Plant Market
- Germany Virtual Power Plant Market
- France Virtual Power Plant Market
- Denmark Virtual Power Plant Market
- South Africa Virtual Power Plant Market
- Turkey Virtual Power Plant Market
- Brazil Virtual Power Plant Market
- Rest Of Europe Virtual Power Plant Market
- Rest Of Asia Pacific Virtual Power Plant Market
- GCC Countries Virtual Power Plant Market
- Rest Of Middle East And Africa Virtual Power Plant Market
- Rest Of GCC Virtual Power Plant Market
- UAE Virtual Power Plant Market
- Rest Of South America Virtual Power Plant Market
Need a Tailored Report?
Customize this report to your needs
Get 10% FREE Customization
Customize This Report
