
UK Wave Energy Converter Market (2026-2031)

The UK Wave Energy Converter Market was valued at $12.02 Million in 2026 and projected to reach to $40.64 Million by 2031, representing a compound annual growth rate of 27.6%. The UK wave energy converter market is poised for exceptional growth through 2031, driven by the nation's strategic positioning as a global wave energy leader.


| Market Size in | USD 26.32 MN |
| Market Forecast in | |
| CAGR | |
| Forecast Period | |
| Units Considered | Value (USD MN) |
UK Wave Energy Converter Market Trends and Insights
- The UK's extensive coastline, strong wave resources, and supportive renewable energy policies position the nation as a leader in wave energy development within Europe.
- The UK's commitment to net-zero emissions and substantial investment in marine renewable technologies are driving accelerated adoption of wave energy converters across the forecast period. The UK wave energy converter market benefits from advanced technological innovation and government backing through initiatives such as the Contracts for Difference scheme.
- The UK's established offshore wind expertise and supply chain infrastructure provide a competitive advantage for wave energy deployment.
- Between 2026 and 2031, the UK market is expected to grow significantly faster than global averages, reflecting the UK's strategic focus on diversifying renewable energy sources and leveraging its marine resources. Key drivers for the UK market include rising electricity demand, declining technology costs, and regulatory frameworks that incentivize clean energy transition.
- The UK's wave energy sector is attracting both domestic and international investment, positioning the country as a critical hub for wave energy converter commercialization and deployment..
Key Market Statistics
- CAGR (2026-2031) 27.6% CAGR
- Market Size, 2026 ~USD 12.02 Million
- Forecast, 2031 ~USD 40.64 Million
- Country UK
UK Wave Energy Converter Market Overview
Rapid Market Growth :
The UK wave energy converter market is expanding at 27.6% CAGR, significantly outpacing the global average of 19%, driven by increasing renewable energy investments and coastal development initiatives.
Extensive Coastline Advantage :
The UK's 11,000+ miles of coastline and exceptional wave resources, particularly in Scotland and Wales, provide optimal conditions for wave energy deployment and commercial viability.
Net-Zero Policy Support :
Strong government backing through net-zero commitments, renewable energy subsidies, and favorable regulatory frameworks accelerate wave energy converter adoption across UK waters.
Substantial Market Valuation :
Market size growing from $12.02 million in 2026 to $40.64 million by 2031, representing a 238% increase and establishing the UK as Europe's leading wave energy market.
UK Wave Energy Converter Market Dynamics
- Government investment in marine renewable energy, combined with technological advancements and reduced deployment costs, will accelerate commercial-scale projects.
- The UK's commitment to achieving net-zero emissions by 2050 creates sustained demand for innovative wave energy solutions. Key growth catalysts include increased funding from the Green Investment Bank, expansion of offshore wind infrastructure that can support wave energy integration, and successful pilot projects demonstrating commercial viability.
- Scotland's Wave Energy Scotland program and Wales's marine energy initiatives will drive regional deployment, while supply chain development and skilled workforce expansion will support market maturation and competitive positioning..
Market Ecosystem
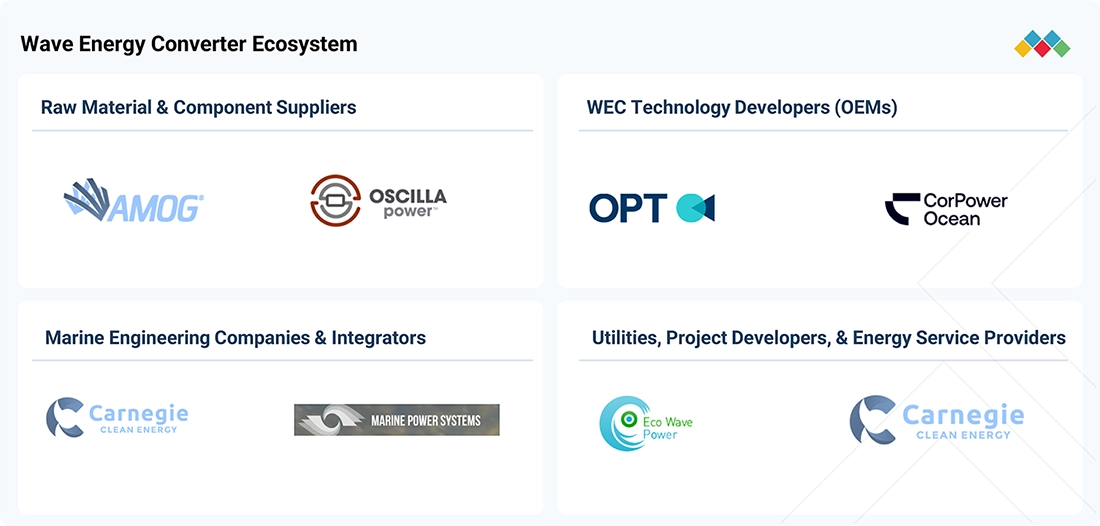
WAVE ENERGY CONVERTER MARKET: COMMERCIAL USE CASES ACROSS INDUSTRIES
| COMPANY | USE CASE DESCRIPTION | BENEFITS |
|---|---|---|
 |
Ocean Power Technologies deployed PowerBuoy® systems off the US coast to provide persistent offshore power, communications, and sensor integration for maritime surveillance. In 2026, the company expanded deployments supporting US Department of Homeland Security operations, including systems operating in deep water. | Demonstrates the use of wave-powered systems for persistent offshore infrastructure where conventional subsea cabling or frequent battery replacement can be difficult. The deployment supports maritime monitoring and communications while demonstrating WEC applicability to defense, security, and offshore infrastructure applications. |
 |
CorPower Ocean's HiWave-5 project at Aguçadoura, Portugal, uses its C4 Wave Energy Converter and is being expanded with next-generation C5 devices. The project is grid-connected and forms the basis for the company's planned larger VianaWave project, a 10-MW wave farm in Portugal. | Demonstrates the transition of wave energy from full-scale demonstration toward commercial-scale wave farms. Grid-connected operation provides real-world performance data and supports validation of device survivability, power generation, certification, and project development processes required for larger wave-energy deployments. |
 |
Eco Wave Power and EDF Renewables IL developed the EWP-EDF One wave energy station at Jaffa Port, Israel. The 100-kW project was connected to Israel's national electricity grid and began exporting electricity, using an onshore configuration integrated with existing port infrastructure. | Demonstrates the integration of wave energy with existing coastal and port infrastructure while supplying renewable electricity to the grid. The project provides operational experience for scaling onshore wave-energy systems and supports applications where offshore foundations and extensive subsea infrastructure can be minimized. |
Logos and trademarks shown above are the property of their respective owners. Their use here is for informational and illustrative purposes only.
Related Ecosystem
Decarbonization
- Battery Electric Vehicle (BEV)
- Hybrid Electric Vehicle (HEV)
- Energy Management Systems
- Fuel Cell
- Fuel Cell Electric Vehicle (FCEV)
- TotalEnergies SE
- Siemens ag
- Mitsui & Co., Ltd.
- General Electric Company
- Thyssenkrupp ag
Key Takeaways
- The UK wave energy converter market is projected to grow from $12.02 million in 2026 to $40.64 million in 2031, representing a 27.6% CAGR.
- The UK's favorable wave resources, extensive coastline, and net-zero policy framework create a highly conducive environment for wave energy converter deployment.
- The UK benefits from established offshore infrastructure and supply chain expertise, accelerating commercialization and reducing deployment costs for wave energy technologies.
- Government support through schemes like Contracts for Difference and increasing private investment are key catalysts driving the UK wave energy converter market expansion.
Wave Energy Converter Market Report Scope
| Report Metric | Details |
|---|---|
| Base Year | 2026 |
| Fastest Growing Segment | OSCILLATING BODY CONVERTERS (Technology) |
| Forecast Period | 2026-2030 |
| Growth Rate | CAGR of 19% from 2026 to 2030 |
| Largest Segment | POWER GENERATION (Application) |
| Market Size Base Year (Billions) | ~USD 0.03 (2026) |
| Revenue Forecast (Billions) | ~USD 0.06 (2030) |
| Segments Covered | Technology, Type, Application |
UK Wave Energy Converter Market Report Segmentation
3 segment dimensions are covered across the global market.
By Technology
- Oscillating Body Converters
- Oscillating Water Columns
- Other Technologies
- Overtopping Devices
By Type
- Attenuators
- Oscillating Wave Surge Converters
- Point Absorbers
- Submerged Pressure Differential Devices
By Application
- Desalination
- Other Applications
- Power Generation
Target Audience
- Energy & Utility Companies : UK-based energy providers need market intelligence to evaluate wave energy converter integration into renewable portfolios, assess investment returns, and plan offshore energy diversification strategies.
- Wave Energy Technology Developers : Manufacturers and innovators require UK market data to identify growth opportunities, understand competitive dynamics, secure funding, and prioritize commercialization efforts in Europe's leading wave energy market.
- Investment & Private Equity Firms : Financial investors targeting UK renewable energy need detailed market forecasts, valuation metrics, and growth projections to evaluate portfolio opportunities and assess risk-adjusted returns.
- Government & Policy Makers : UK government agencies and marine planning authorities require market analysis to inform renewable energy policy, allocate resources effectively, and track progress toward net-zero commitments.
- Supply Chain & Equipment Suppliers : Component manufacturers and service providers need UK market insights to identify demand trends, plan capacity expansion, and develop targeted solutions for wave energy converter deployment.
Reasons to Buy this Report
- Market-Specific Sizing & Forecasts : Access precise UK market valuations ($12.02M in 2026, $40.64M in 2031) with detailed CAGR analysis to support investment decisions and business planning specific to the British wave energy sector.
- Regional Growth Drivers Analysis : Understand UK-specific catalysts including net-zero policies, coastal geography advantages, government funding mechanisms, and regional initiatives in Scotland and Wales driving market expansion.
- Competitive Landscape Intelligence : Identify leading UK wave energy converter manufacturers, emerging startups, and technology providers operating in British waters to benchmark competitive positioning and partnership opportunities.
- Investment & Funding Insights : Discover UK-specific funding sources, grant programs, and investment trends supporting wave energy development, enabling strategic capital allocation and venture identification.
- Regulatory & Policy Framework : Navigate UK marine licensing requirements, renewable energy incentives, and government support mechanisms essential for project development, commercialization, and regulatory compliance.
Frequently asked questions
What is the current size of the UK wave energy converter market?
The UK wave energy converter market was valued at $12.02 million in 2026 and is expected to grow to $40.64 million by 2031.
What is the growth rate of the UK wave energy converter market?
The UK wave energy converter market is growing at a compound annual growth rate (CAGR) of 27.6% from 2026 to 2031.
Why is the UK a leader in wave energy converter development?
The UK possesses extensive coastlines with strong wave resources, established offshore infrastructure, supportive net-zero policies, and government funding mechanisms like Contracts for Difference that facilitate wave energy converter deployment.
What factors are driving growth in the UK wave energy converter market?
Key drivers include rising electricity demand, declining technology costs, regulatory support for renewable energy, net-zero commitments, and increasing private and public investment in marine renewable technologies.
How does the UK wave energy converter market compare to global trends?
The UK market is growing significantly faster than the global average (27.6% CAGR vs. 19% global CAGR), reflecting the UK's strategic prioritization of wave energy and favorable marine conditions.
RESEARCH METHODOLOGY
The research process for this technical, market-oriented, and commercial study of the wave energy converter market involved systematic collection, validation, and analysis of information related to wave-energy technologies, power conversion systems, deployment environments, marine-energy applications, project developments, and commercialization initiatives. Extensive secondary research was conducted using annual reports, investor presentations, technical papers, government publications, company websites, project documents, regulatory publications, industry databases, and financial reports to identify key market participants, technology trends, deployment activity, market developments, and competitive strategies. The findings were further validated through primary interviews with executives from wave energy technology developers, marine energy companies, project developers, engineering firms, utilities, government agencies, research institutions, and industry experts to assess market estimates, technology adoption, project pipelines, customer requirements, and competitive positioning.
Key market players and their market positions were established through a combination of secondary research and primary validation involving senior executives, business development managers, technology specialists, project managers, engineering experts, and commercial professionals across the wave energy ecosystem.
Secondary Research
In the secondary research process, various secondary sources were referred to for identifying and collecting information relevant to the study. Secondary sources included annual reports, investor presentations, press releases, company websites, technical papers, project reports, government publications, regulatory documents, industry journals, marine-energy databases, and recognized industry sources.
Publications and datasets from organizations such as the US Department of Energy (DOE), National Renewable Energy Laboratory (NREL), European Commission, European Marine Energy Centre (EMEC), Ocean Energy Europe, International Energy Agency (IEA), Pacific Marine Energy Center (PMEC), and national marine-energy and renewable-energy agencies were reviewed to understand wave-energy technology development, deployment activity, testing infrastructure, policy developments, marine-energy funding, and commercialization trends.
Secondary research was primarily conducted to obtain information on the wave energy converter value chain, key market participants, technology developments, product portfolios, project pipelines, wave-energy demonstrations, market drivers and restraints, regional deployment patterns, application trends, power-rating requirements, location-specific opportunities, and recent industry developments.
Primary Research
During the primary research phase, wave-energy technology developers, marine-energy companies, project developers, engineering and consulting firms, utilities, equipment suppliers, research institutions, government agencies, and industry experts were interviewed to obtain qualitative and quantitative insights on the Wave Energy Converter Market. Interviews were conducted to validate market estimates, technology adoption, project development trends, pricing and cost considerations, deployment requirements, regional demand, competitive positioning, and customer buying criteria.
A combination of top-down and bottom-up approaches, supported by data triangulation, was used to estimate and forecast the market across all segments and subsegments. Primary interviews also helped assess technology maturity, wave-resource requirements, installation and maintenance requirements, survivability, power-take-off systems, project financing, grid integration, marine permitting, and emerging applications. The findings were further validated against company disclosures, government statistics, project announcements, testing-facility information, and industry sources to refine market estimates, segment shares, regional forecasts, and competitive assessments.
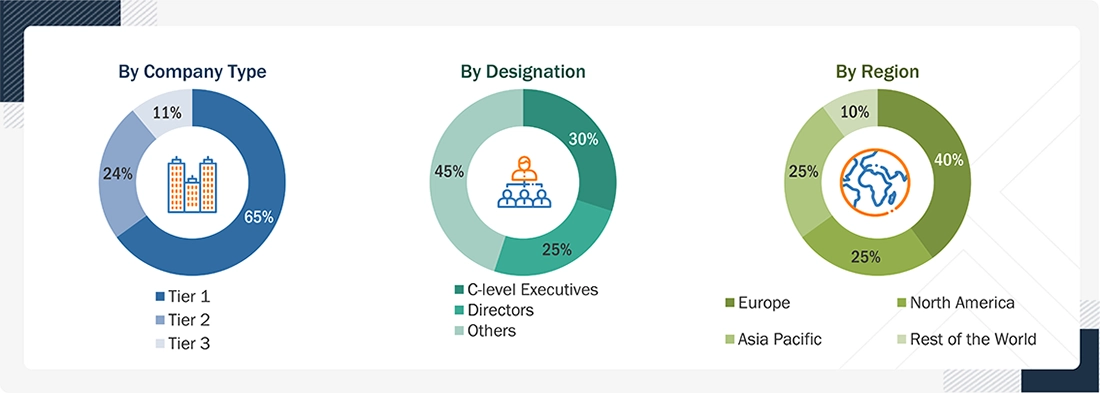
Note: Others include sales managers, engineers, project managers, technology specialists, business development managers, and regional managers.
Tier 1 Company-Revenue > USD 5 billion, Tier 2 Company-Revenue between USD 1 and USD 5 billion, and Tier 3 Company-Revenue < USD 1 billion.
To know about the assumptions considered for the study, download the pdf brochure
Market Size Estimation
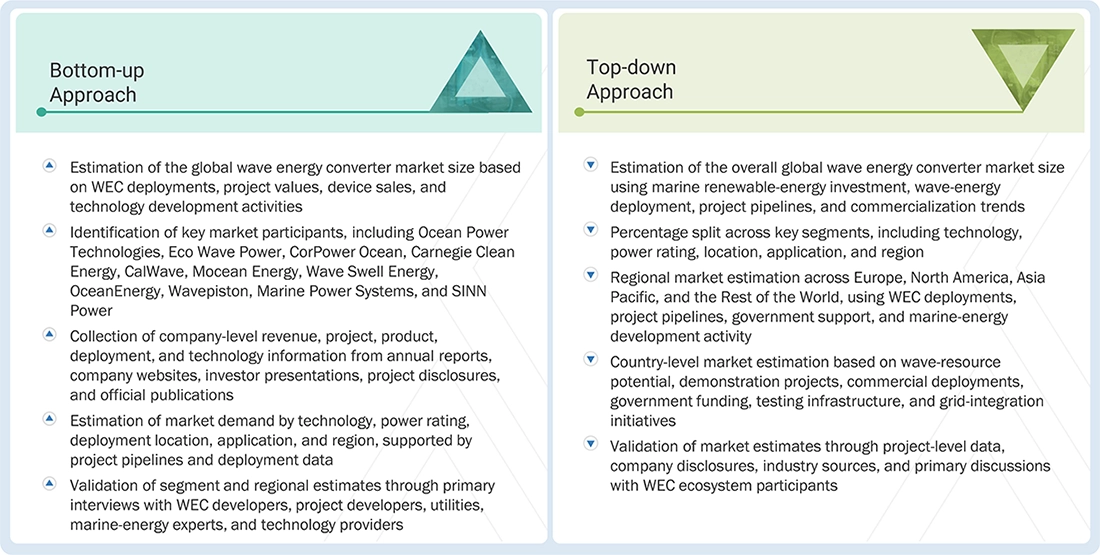
Both top-down and bottom-up approaches have been used to estimate and validate the size of the wave energy converter market and its dependent submarkets. The key players in the market have been identified through secondary research, and their market positions across respective regions and technology segments have been assessed through both primary and secondary research. The research methodology includes the study of annual and financial reports of publicly listed market participants, company disclosures, project announcements, technology documentation, and interviews with industry experts, including chief executive officers, vice presidents, directors, project managers, business development managers, engineering managers, and technical specialists, to obtain key quantitative and qualitative insights related to the wave energy converter market.
Bottom-up Approach
- Estimating the wave energy converter market size across technology, oscillating body converter sub-technology, power rating, location, application, and region by analyzing revenues and project values generated from WEC systems, equipment, deployments, and related commercial activities and consolidating segment-level estimates to derive the overall market size.
- Mapping leading market participants, including Ocean Power Technologies (US), Eco Wave Power Global (Israel), Carnegie Clean Energy (Australia), CorPower Ocean (Sweden), Mocean Energy (UK), Wave Swell Energy (Australia), CalWave (US), AWS Ocean Energy (UK), Oscilla Power (US), OceanEnergy (Ireland), Wavepiston (Denmark), Exowave (France), Checkmate SeaEnergy (UK), Wave Dragon (Denmark), Marine Power Systems (UK), Bombora Wave Power (Australia), INGINE (South Korea), AMOG Consulting (Australia), Atargis Energy Corporation (US), Hann-Ocean Energy (Singapore), Accumulated Ocean Energy (UK), Aquanet Power (Taiwan), Arrecife Energy Systems (Spain), and SINN Power (Germany).
- Collecting technology, product, project, deployment, and commercial information from annual reports, investor presentations, company websites, product documentation, technical papers, project announcements, press releases, government programs, regulatory filings, and other publicly available disclosures.
- Estimating demand across major applications, including power generation, desalination, and others, with further assessment of remote power, offshore power, coastal infrastructure, marine applications, and other emerging use cases based on WEC deployments, project pipelines, wave-resource availability, renewable-energy targets, and marine-energy development programs.
- Estimating market demand across major technologies, including oscillating water columns, oscillating body converters, overtopping devices, and others, using manufacturer technology portfolios, project deployment data, open-water testing, technology maturity, and regional development trends.
- Estimating the oscillating body converters market across point absorbers, attenuators, oscillating wave surge converters, and submerged pressure differential devices based on technology portfolios, project activity, deployment environment, and commercialization status.
- Incorporating qualitative factors, including government marine energy programs, renewable energy policies, wave resource availability, technology maturity, levelized cost of energy, survivability requirements, installation and maintenance costs, marine permitting, grid integration, project financing, supply chain availability, and technology advancements into the market forecasting model.
Top-down Approach
- Estimating the overall global wave energy converter market by analyzing global marine renewable-energy investment, wave-energy project development, renewable-energy deployment, coastal electricity demand, offshore infrastructure development, government marine-energy programs, and the transition toward low-carbon electricity generation.
- Allocating the market across technology (oscillating water column, oscillating body converters, overtopping devices, and others), oscillating body converter sub-technology, power rating, location, and application using regional deployment patterns, technology penetration, manufacturer portfolios, project pipelines, and industry data.
- Distributing market estimates across North America, Europe, Asia Pacific, and the Rest of the World based on regional wave-energy projects, installed and demonstrated capacity, government funding, marine-energy testing infrastructure, wave-resource availability, policy support, and technology adoption.
- Validating the final market estimates through primary discussions with technology developers, project developers, engineering companies, utilities, and channel participants to validate regional project activity, deployment trends, technology preferences, project economics, and commercialization prospects, followed by data triangulation to ensure consistency and accuracy.
Global Wave Energy Converter Market Size: Bottom-up Approach and Top-down Approach
Data Triangulation
The process of determining the overall market size involved the methodologies described earlier, followed by segmenting the market into multiple segments and subsegments. To finalize the comprehensive market analysis and obtain precise statistics for each market segment and subsegment, data triangulation and market breakdown procedures were applied, wherever appropriate.
Data triangulation was accomplished by examining factors and trends from both the demand and supply sides of the wave energy converter ecosystem, including WEC project deployments, technology demonstrations, manufacturer revenues and product portfolios, project pipelines, government funding, marine-energy policies, wave-resource availability, testing infrastructure, project economics, technology maturity, and regional market dynamics.
Market Definition
A wave energy converter (WEC) is a marine-energy device designed to capture the kinetic and potential energy contained in ocean waves and convert it into usable electrical energy or other forms of useful energy. WECs use different mechanical, hydraulic, pneumatic, or electrical power-take-off systems to convert wave-induced motion into energy. Depending on the technology, systems may be installed onshore, nearshore, or offshore and may use floating, submerged, seabed-mounted, or coastal-infrastructure-integrated configurations.
The wave energy converter market encompasses the revenue generated globally from the sale, deployment, and commercial implementation of different WEC technologies, including oscillating water columns, oscillating body converters, overtopping devices, and other wave-energy technologies. Oscillating body converters include point absorbers, attenuators, oscillating wave surge converters and submerged pressure differential devices. WEC systems are deployed across shoreline, nearshore, and offshore locations. The primary applications considered in the market are power generation and desalination.
Key Stakeholders
- Wave energy converter manufacturers and technology developers
- Marine-energy equipment and component manufacturers
- Power-take-off system and generator manufacturers
- Marine engineering, EPC, and system integration companies
- Wave energy project developers and renewable-energy companies
- Installation, operations, maintenance, and marine-service providers
- Government agencies and regulatory authorities
- Marine-energy testing centers and research institutions
- Utilities and electricity-generation companies
- Ports, coastal infrastructure operators, and offshore asset owners
- Research institutions, universities, and marine-energy associations
- Technology standards organizations, industry forums, alliances, and trade associations
- Institutional investors, infrastructure funds, and private equity firms
- Desalination companies and water infrastructure developers
Report Objectives
- To define, describe, segment, and forecast the wave energy converter market by technology, oscillating body converter sub-technology, location, and application, in terms of value
- To forecast the market sizes for four major regions, namely, North America, Europe, Asia Pacific, and the Rest of the World, along with their key countries, in terms of value
- To forecast the wave energy converter market by technology and region, in terms of volume where reliable deployment and capacity data are available
- To provide detailed information regarding key drivers, restraints, opportunities, and challenges influencing the growth of the wave energy converter market
- To provide the supply chain analysis, trends/disruptions impacting customer business, ecosystem analysis, regulatory landscape, patent analysis, case study analysis, technology analysis, key conferences & events, the impact of AI/Gen AI, macroeconomic outlook, pricing and cost analysis, Porter’s five forces analysis, and regulatory analysis influencing the wave energy converter market
- To analyze opportunities for stakeholders in the wave energy converter market and draw a competitive landscape of the market
- To benchmark market players using the company evaluation matrix, which analyzes market players based on broad categories of business and technology strategies adopted by them
- To compare key market players based on technology, product portfolio, deployment activity, project pipeline, applications, geographic presence, and commercialization stage
- To strategically profile key players and comprehensively analyze their market positioning, technology capabilities, project activity, and core competencies
- To analyze competitive developments, such as contracts, agreements, partnerships, collaborations, demonstrations, project deployments, product launches, technology developments, and expansions in the wave energy converter market.
Available customizations:
With the given market data, MarketsandMarkets offers customizations based on the company’s specific needs. The following customization options are available for the report:
PRODUCT ANALYSIS
- Product Matrix, which provides a detailed comparison of the product portfolio of each company
COMPANY INFORMATION
- Detailed analyses and profiling of additional market players (up to 5)
Get the Full Wave Energy Converter Market Report
Full forecast, segment splits, and company analysis for all Wave Energy Converter Market.
- Canada Wave Energy Converter Market
- US Wave Energy Converter Market
- Mexico Wave Energy Converter Market
- France Wave Energy Converter Market
- Spain Wave Energy Converter Market
- Portugal Wave Energy Converter Market
- China Wave Energy Converter Market
- Japan Wave Energy Converter Market
- Brazil Wave Energy Converter Market
- Chile Wave Energy Converter Market
- Israel Wave Energy Converter Market
- Rest Of Europe Wave Energy Converter Market
- Rest Of Asia Pacific Wave Energy Converter Market
Need a Tailored Report?
Customize this report to your needs
Get 10% FREE Customization
Customize This Report