
Asia Pacific X Ray Machine Market (2025-2030)

The Asia Pacific X Ray Machine Market was valued at $109.6 Million in 2025 and projected to reach to $129.4 Million by 2030, representing a compound annual growth rate of 2.4%. The Asia Pacific X Ray Machine Market is poised for steady growth through 2030, supported by robust automotive manufacturing expansion across China, India, and Japan.


| Market Size in | USD 26.32 MN |
| Market Forecast in | |
| CAGR | |
| Forecast Period | |
| Units Considered | Value (USD MN) |
Asia Pacific X Ray Machine Market Trends and Insights
- Asia Pacific represents a significant portion of the global automotive and transportation sector's diagnostic infrastructure, driven by increasing vehicle production, regulatory compliance requirements, and modernization of inspection facilities across the region.
- The market in Asia Pacific is characterized by steady adoption of advanced imaging technologies in manufacturing and quality control processes. Growth in Asia Pacific is supported by rising automotive manufacturing output in countries such as China, India, and Southeast Asia, where X-ray machines are essential for non-destructive testing and component inspection.
- Asia Pacific's market expansion from 2025 to 2030 reflects ongoing investments in transportation infrastructure and stricter safety standards.
- The region's competitive landscape includes both established global players and emerging local manufacturers adapting solutions to Asia Pacific's specific operational and regulatory needs..
Key Market Statistics
- CAGR (2025-2030) 2.4% CAGR
- Market Size, 2025 ~USD 109.6 Million
- Forecast, 2030 ~USD 129.4 Million
- Geography Asia Pacific
Asia Pacific X Ray Machine Market Overview
China Dominates Regional Market :
China leads the Asia Pacific X Ray Machine Market with USD 43.9 million in 2025, driven by massive automotive manufacturing output and stringent vehicle safety regulations requiring advanced diagnostic equipment.
India's Rapid Growth Trajectory :
India represents the second-largest market at USD 28.4 million, fueled by expanding automotive production capacity, increasing FDI in manufacturing, and rising adoption of quality control technologies.
Japan's Technology Leadership :
Japan contributes USD 24.7 million to the regional market, leveraging its advanced automotive sector and preference for high-precision diagnostic equipment in vehicle assembly and maintenance.
Steady 2.4% CAGR Growth :
The Asia Pacific region is projected to grow from USD 109.6 million in 2025 to USD 129.4 million by 2030, reflecting consistent demand from vehicle manufacturers and regulatory compliance initiatives.
Asia Pacific X Ray Machine Market Dynamics
- Increasing vehicle production volumes, coupled with stricter emission and safety regulations, are driving demand for advanced diagnostic and inspection equipment.
- The region's growing middle class and rising vehicle ownership rates further amplify the need for reliable maintenance and quality assurance infrastructure. Key growth drivers include technological advancements in portable and digital X-ray systems, increased investment in automotive manufacturing facilities, and heightened focus on product quality and safety compliance.
- Emerging economies within Asia Pacific are rapidly modernizing their automotive sectors, creating substantial opportunities for X-ray machine suppliers.
- However, market growth remains moderate at 2.4% CAGR, reflecting competitive pricing pressures and the maturity of established markets like Japan and South Korea..
Market Ecosystem
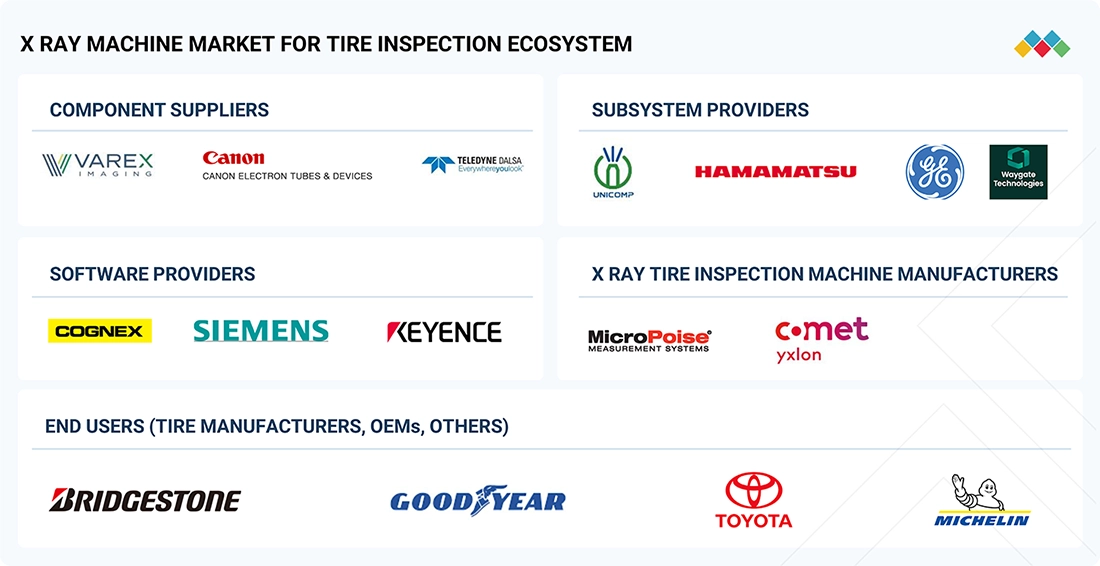
X RAY MACHINE MARKET: COMMERCIAL USE CASES ACROSS INDUSTRIES
| COMPANY | USE CASE DESCRIPTION | BENEFITS |
|---|---|---|
 |
Providing integrated X ray tire inspection systems within uniformity and balance lines for high-volume tire manufacturing | Enabling inline defect detection, reducing scrap rates, and improving tire structural consistency |
 |
Supplying customized industrial X ray systems for internal defect inspection in passenger, TBR, and specialty tires | Supporting cost-effective quality control with adaptable configurations for varied tire sizes |
 |
Delivering high resolution 2D and CT-based X ray systems for detailed internal structure analysis of complex tire architectures | Providing high penetration imaging, precise defect localization, and suitability for advanced EV tires |
 |
Offering fully automated X ray inspection machines integrated with smart tire production lines | Improving throughput efficiency, enabling digital traceability, and reducing manual inspection dependency |
 |
Providing high-precision X ray and CT systems for R and D validation and failure analysis of tire components | Delivering superior image clarity for root cause analysis and material characterization in advanced tire designs |
Logos and trademarks shown above are the property of their respective owners. Their use here is for informational and illustrative purposes only.
Related Ecosystem
Automotive Advance Technologies
- Battery Electric Vehicle (BEV)
- Light Commercial Vehicles (LCVs)
- Fuel Cell Electric Vehicle (FCEV)
- Hybrid Electric Vehicle (HEV)
- Internal Combustion Engine (ICE)
- BOSCH LIMITED
- Continental ag
- Visteon Corporation
- DENSO Corporation
- ZF FRIEDRICHSHAFEN AG
Key Takeaways
- Asia Pacific X Ray Machine Market is valued at USD 109.6 million in 2025 with projected growth to USD 129.4 million by 2030.
- Asia Pacific maintains a steady CAGR of 2.4% driven by automotive manufacturing expansion and regulatory compliance demands.
- Asia Pacific's market growth is supported by modernization of inspection facilities and adoption of non-destructive testing technologies.
- Asia Pacific represents a critical regional market within the global automotive and transportation diagnostic equipment sector.
X Ray Machine Market Report Scope
| Report Metric | Details |
|---|---|
| Base Year | 2025 |
| Fastest Growing Segment | MOBILE (System Type) |
| Forecast Period | 2025–2030 |
| Growth Rate | CAGR of 2.4% from 2025 to 2030 |
| Largest Segment | STATIONARY (System Type) |
| Market Size Base Year (Billions) | ~USD 253.69 (2025) |
| Revenue Forecast (Billions) | ~USD 285.63 (2030) |
| Segments Covered | System Type, Stationary System Type, Technology, Use Case |
Asia Pacific X Ray Machine Market Report Segmentation
4 segment dimensions are covered across the global market.
By System Type
- Mobile
- Stationary
By Stationary System Type
- Inline
- Offline
By Technology
- 2D
- 3D
By Use Case
- Aftermarket
- OEM
- Tier 1
Target Audience
- Automotive Manufacturers : OEMs and Tier-1 suppliers across Asia Pacific need market intelligence to optimize diagnostic equipment procurement, ensure regulatory compliance, and maintain quality standards in vehicle assembly.
- X-Ray Equipment Suppliers : Manufacturers and distributors of X-ray machines require regional market data to identify growth opportunities, benchmark competitive positioning, and develop targeted sales strategies in Asia Pacific.
- Investment & Private Equity Firms : Investors evaluating opportunities in automotive diagnostics and manufacturing infrastructure need comprehensive market sizing and growth forecasts to assess portfolio companies and acquisition targets.
- Automotive Service & Maintenance Networks : Independent service centers and authorized dealerships across Asia Pacific require market insights to justify capital investments in diagnostic equipment and plan facility upgrades.
- Government & Regulatory Bodies : Transportation authorities and regulatory agencies in Asia Pacific countries use market data to develop safety standards, emission regulations, and infrastructure policies affecting the diagnostic equipment sector.
Key Companies in the Asia Pacific X Ray Machine Market
| Company | HQ | Ownership | Strongest segments |
|---|---|---|---|
| TECHNIP ENERGIES N.V. | France | Public Company | Stationary systems – software, automation, and integration,Mobile systems – software enablement and integration,2D inspection enablement, |
| COMET | Switzerland | Public Company | Stationary X-ray systems for tire inspection (2D/3D, Tier 1 and OEM),Industrial X-ray modules for OEM integration into tire inspection equipment,Mobile and portable X-ray solutions for aftermarket and plant maintenance, |
| MESNAC | China | Public Company | Stationary Systems,Mobile Systems,2D Technology, |
| NIKON CORPORATION INDUSTRIAL SOLUTIONS | Japan | InvalidIdentifier | Stationary 2D X-ray systems,Stationary 3D / CT X-ray systems,Mobile / inline retrofit X-ray units, |
| TMSI | United States | Private Company | Stationary systems,Mobile systems,2D technology, |
| HAMAMATSU PHOTONICS K.K. | Japan | Public Company | Stationary systems – 2D tire inspection (cameras, detectors, sources),Stationary systems – 3D / advanced imaging (high-resolution cameras, TDI, sources),Mobile / aftermarket inspection solutions (compact sources, detectors, modules), |
| DETECTION TECHNOLOGY PLC. | Finland | Public Company | Stationary systems – detector content,Mobile systems – detector content,2D detector solutions for tire and tread inspection, |
TECHNIP ENERGIES N.V.
TechnipEnergies N.V. is a French public company founded in 2019 that employs 18,000 people. The company operates in the energy sector, providing engineering and technology solutions.
COMET
Comet is a Swiss public company founded in 1948 with 1,656 employees. The company specializes in industrial technology and solutions.
MESNAC
Mesnac is a Chinese public company founded in 2000. The company operates in the industrial sector.
NIKON CORPORATION INDUSTRIAL SOLUTIONS
Unable to provide description due to insufficient data.
TMSI
TMSI is a United States-based private company founded in 1926 with 4,400 employees. The company provides industrial technology and solutions.
HAMAMATSU PHOTONICS K.K.
Hamamatsu Photonics K.K. is a Japanese public company founded in 1953 with 6,601 employees. The company specializes in photonics and optical technology solutions.
DETECTION TECHNOLOGY PLC.
Detection Technology PLC. is a Finnish public company founded in 1991 with 497 employees. The company specializes in detection technology solutions.
Countries within Asia Pacific - compare and drill down
| Country | 2025 size (native) |
|---|---|
| China | USD 43.9 Million |
| India | USD 28.4 Million |
| Japan | USD 24.7 Million |
| South Korea | USD 14.7 Million |
| Rest Of Asia Pacific | USD 21.5 Million |
Country market size visualization
Reasons to Buy this Report
- Market-Specific Sizing & Forecasts : Access precise market valuations for Asia Pacific (USD 109.6M in 2025) with country-level breakdowns for China, India, Japan, and South Korea, enabling targeted investment and expansion decisions.
- Competitive Landscape Intelligence : Understand regional market dynamics, key players, and competitive positioning specific to Asia Pacific's automotive and transportation sector to identify partnership and acquisition opportunities.
- Regulatory & Compliance Insights : Gain detailed knowledge of Asia Pacific regulatory requirements driving X-ray machine adoption across different countries, essential for product development and market entry strategies.
- Growth Opportunity Identification : Identify high-growth segments within Asia Pacific, including emerging markets and underserved regions, to prioritize resource allocation and maximize ROI in the automotive diagnostics sector.
- Strategic Planning & Forecasting : Leverage 5-year forecasts (2025-2030) and 2.4% CAGR projections to develop long-term business strategies, capacity planning, and market penetration roadmaps for Asia Pacific operations.
Frequently asked questions
What is the current market size of X Ray Machines in Asia Pacific?
The Asia Pacific X Ray Machine Market is valued at USD 109.6 million in 2025.
What is the projected market size for X Ray Machines in Asia Pacific by 2030?
Asia Pacific's X Ray Machine Market is projected to reach USD 129.4 million by 2030.
What is the CAGR for the X Ray Machine Market in Asia Pacific?
Asia Pacific's X Ray Machine Market is expected to grow at a CAGR of 2.4% from 2025 to 2030.
What are the primary drivers of growth in Asia Pacific's X Ray Machine Market?
Growth in Asia Pacific is driven by increasing automotive manufacturing, regulatory compliance requirements, and modernization of inspection facilities across the region.
Which countries in Asia Pacific are leading the X Ray Machine Market?
China, India, and Southeast Asian countries are major contributors to Asia Pacific's X Ray Machine Market due to their significant automotive manufacturing output.
RESEARCH METHODOLOGY
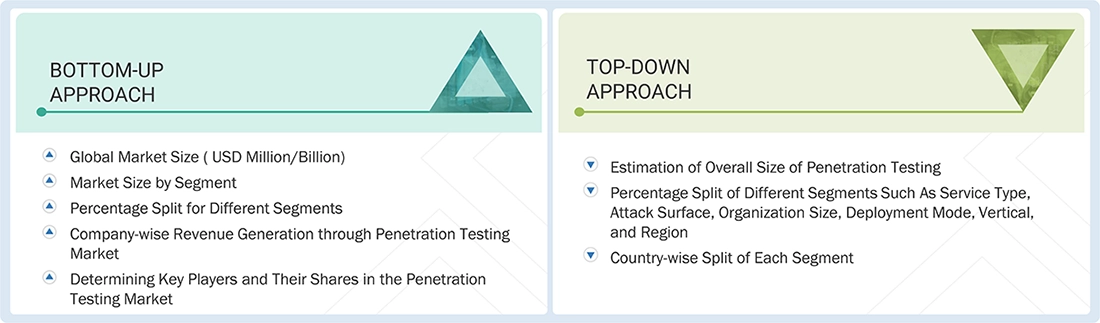
The study involved four major activities in estimating the current size of the X ray machine market for tire inspection. Exhaustive secondary research was done to collect information on the market, the peer market, and the parent market. The next step was to validate these findings, assumptions, and sizing with the industry experts across value chains through primary research. The top-down approach was employed to estimate the complete market size. Thereafter, market breakdown and data triangulation processes were used to estimate the market size of segments and subsegments.
Secondary Research
In the secondary research process, various secondary sources such as company annual reports/presentations, press releases, industry association publications [for instance, publications of X ray machine manufacturers for tire inspection, American Society for Non-destructive Testing, International Committee for Non Destructive Testing, European Federation for Non Destructive Testing, ASTM International, International Organization for Standardization, International Electrotechnical Commission, Tire Industry Association, U.S. Tire Manufacturers Association, European Tyre and Rubber Manufacturers Association, China Rubber Industry Association, Japan Automobile Tyre Manufacturers Association, All India Rubber Industries Association, and Society of Automotive Engineers)], X ray machine related magazine articles, directories, technical handbooks, World Economic Outlook, trade websites, government organizations websites, and technical articles, company websites, whitepapers, databases, and articles from recognized associations and government publishing sources. The secondary data was collected and analyzed to arrive at the overall market size, which was further validated by primary research for an extensive commercial study of the X-ray machine market for tire inspection..
Primary Research
Extensive primary research was conducted after acquiring an understanding of this market scenario through secondary research. Several primary interviews were conducted with market experts from the demand- and supply-side OEMs (in terms of component supply, country-level government associations, and trade associations) and component manufacturers across four major regions: Asia Pacific, Europe, North America, and Rest of the World. Approximately 50% of primary interviews were conducted from the demand side and the supply side each. Primary data was collected through questionnaires, emails, LinkedIn, and telephonic interviews. In the canvassing of primaries, various departments within organizations, such as sales, operations, and administration, were covered to provide a holistic viewpoint in the report.
Brief sessions with highly experienced independent consultants were conducted to reinforce findings from primaries after interacting with industry experts. This, along with the in-house subject matter experts’ opinions, led to the findings described in the remainder of this report.
In the primary research process, various primary sources from the supply and demand sides were interviewed to obtain qualitative and quantitative information for the report. The primary sources from the supply side included industry experts, such as Vice Presidents (VPs), marketing directors, technology and innovation directors, and related key executives from various key companies and organizations. The primary sources from the demand side included end users, such as Chief Information Officers (CIOs), consultants, service professionals, technicians and technologists, and managers at public and investor-owned utilities.
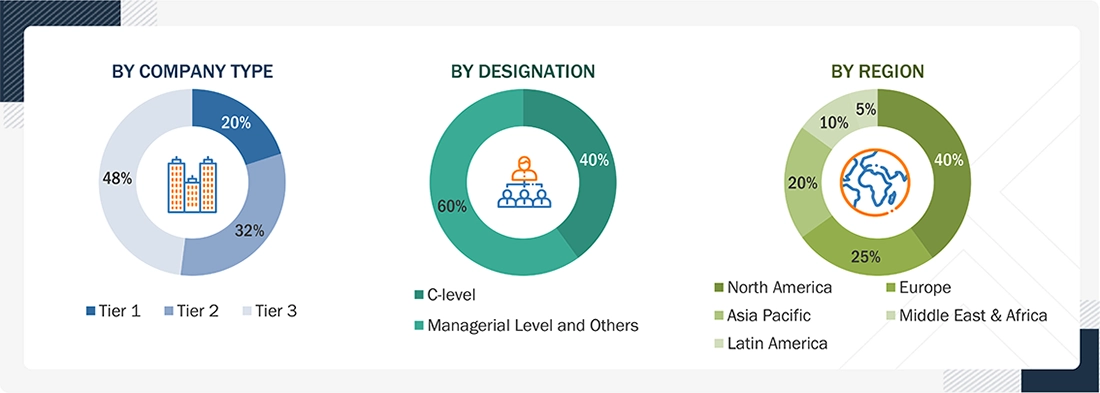
Note: Others include purchase and sales managers, marketing managers, and product managers.
To know about the assumptions considered for the study, download the pdf brochure
Market Size Estimation
The top-down methodology was followed to estimate the size of the X ray machine market for tire inspection by technology. More than 30 companies were covered, and their X ray machine for tire inspection revenue was mapped after discussing with industry experts. Supply-side analysis was done, by technology, for understanding the revenue size of 2D and 3D CT. Revenue share breakdown for each of these segments was mapped by considering the revenue share of respective companies, mapped & verified by industry experts. Market penetration was mapped at the regional level for technology through secondary research, and insights were verified from industry experts. Segmentation for technology was determined by multiplying the market size by the penetration rate. Similarly, it was done for the system type and use case.
X Ray Machine Market : Top-Down and Bottom-Up Approach
Data Triangulation
After arriving at the overall market size using the market size estimation processes as explained above, the market was split into several segments and subsegments. To complete the overall market engineering process and arrive at the exact statistics of each market segment and subsegment, data triangulation and market breakdown procedures were employed, wherever applicable. The data was triangulated by studying various factors and trends from both the demand and supply sides.
Market Definition
A tire X ray inspection machine is a specialized industrial non-destructive testing (NDT) system that uses X-ray technology to visualize the internal structure of tires. It identifies hidden defects such as cord separations, bubbles, steel belt misalignment, and foreign objects by producing high-resolution 2D/3D images. These systems are essential for quality control in manufacturing and R&D.
Report Objectives
- To segment and forecast the X ray machine market for tire inspection in terms of volume (units) and value (USD million)
- To define, describe, and forecast the market based on system type, technology, use case, application, and region
- To analyze regional markets for growth trends, prospects, and their contribution to the overall market
- To define, describe, and forecast the size of the market with respect to growth trends and prospects, and determine the contribution of the segments to the total market
- To segment the market and forecast its size, by volume and value, based on region (Asia Pacific, Europe, North America, and Rest of the World)
- To segment and forecast the market size by volume and value, based on system type (stationary (in-line and off-line), mobile)
- To segment and forecast the market size, by volume and value, based on technology (2D X ray and 3D CT)
- To segment and forecast the market size by value, based on use case (Tier 1, OEM, and aftermarket)
- To segment qualitatively, based on application (tire inspection, tread inspection, sidewall inspection, bead inspection, and others)
- To provide detailed information regarding the major factors (drivers, challenges, restraints, and opportunities) influencing market growth
- To strategically analyze markets with respect to individual growth trends, prospects, and contribution to the total market
- To analyze opportunities for stakeholders and the competitive landscape for market leaders
-
To study the following with respect to the market -
- Supply chain analysis
- Ecosystem analysis
- Technology analysis
- HS code
- Case study analysis
- Patent analysis
- Regulatory landscape
- Key stakeholders and buying criteria
- Funding by application
- Key conferences & events
- To strategically profile key players and comprehensively analyze their market share and core competencies
- To analyze the impact of AI on the market
- To track and analyze competitive developments such as deals (mergers & acquisitions, partnerships, collaborations), product developments, and other activities carried out by key industry participants
Customization Options
With the given market data, MarketsandMarkets offers customizations in line with company-specific needs.
- X ray machine market for tire inspection, by machine size, at the regional level (for regions covered in the report)
- X ray machine market for tire inspection, by vehicle type, at the regional level (for the regions covered in the report)
Company information
- Profiling of additional market players (up to 5)
Get the Full X Ray Machine Market Report
Full forecast, segment splits, and company analysis for all X Ray Machine Market.
- China X Ray Machine Market
- India X Ray Machine Market
- Japan X Ray Machine Market
- South Korea X Ray Machine Market
- Germany X Ray Machine Market
- France X Ray Machine Market
- Italy X Ray Machine Market
- Spain X Ray Machine Market
- UK X Ray Machine Market
- Canada X Ray Machine Market
- Mexico X Ray Machine Market
- US X Ray Machine Market
- UAE X Ray Machine Market
- Saudi Arabia X Ray Machine Market
- Rest Of Europe X Ray Machine Market
- Rest Of Asia Pacific X Ray Machine Market
Need a Tailored Report?
Customize this report to your needs
Get 10% FREE Customization
Customize This Report
