Health Information Exchange Market

Health Information Exchange Market by Set Up Type (Public, Private), Implementation Model (Federated, Hybrid), Type (Pull, Push), Application (Web Portal, Secure Messaging), Solution (Portal, Platform Centric), End User & Region - Global Forecast to 2025

Report Code: HIT 2265 Apr, 2021, by marketsandmarkets.com

Updated on : May 04, 2023

The global health information exchange market in terms of revenue was estimated to be worth $1.1 billion in 2020 and is poised to reach $2.0 billion by 2025, growing at a CAGR of 12.2% from 2020 to 2025. The new research study consists of an industry trend analysis of the market. The new research study consists of industry trends, pricing analysis, patent analysis, conference and webinar materials, key stakeholders, and buying behaviour in the market. Growth in this market can be attributed to factors such as the growing need to curb increasing healthcare costs, the focus on patient-centric care delivery, rising support for EMR/EHR and other HCIT solutions, increasing funding for healthcare interoperability, and government initiatives to enhance patient safety and care. On the other hand, issues pertaining to data privacy, the high cost of deployment, and the use of outdated legacy systems may restrain market growth to a certain extent during the forecast period.

Health Information Exchange Market

To know about the assumptions considered for the study, download the pdf brochure

Health Information Exchange Market Dynamics

Driver: Growing focus on patient-centric care delivery

The increasing penetration of communication technologies in the healthcare industry results in a gradual shift away from institution-centric frameworks and towards patient-centered care delivery. Patient-centric care is associated with a number of advantages, including reduced hospital admissions, decreased expenditure, and reduced pressure on an already burdened system. Increased engagement of healthcare systems with stakeholders helps decrease overall healthcare expenses. Also, patients who report positive experiences have more trust in their providers and are less likely to switch physicians, allowing for more continuity in care. Owing to these benefits, patients are increasingly opting for more personalised treatments to better integrate their opinions and needs with those of their caregivers. This creates a greater demand among patients for their health data and also for platforms that can enable effective communication with doctors and researchers.

With real-time access to relevant data, providers can ensure better physician-patient engagement. Efficient communication and personalised monitoring can translate into more informed decisions and increased patient compliance. These factors ultimately improve medical outcomes and prevent adverse health situations.

Opportunity: Improving healthcare infrastructure in emerging markets

The healthcare industry in emerging countries such as India, China, Brazil, and Mexico is expected to offer significant growth opportunities for companies offering health information exchange solutions. This can be attributed to the increasing healthcare data and the rising adoption of health IT solutions in these countries. According to the India Brand Equity Foundation, the country's healthcare sector has witnessed rapid growth; it was estimated to reach USD 280 billion by 2020 at a CAGR of 17%, wherein the contribution of revenue coming from hospitals is a significant 71%. The lack of proper standards and government regulations in emerging markets is expected to offer huge opportunities for providers of healthcare interoperability solutions who are unable to meet the standards of the US and developed European countries such as Germany and France.

In most of these emerging countries, interoperability solutions in the healthcare market are still in the early stages due to lack of awareness, minimum availability of interoperable solutions, lack of IT infrastructure, and financial and social constraints. The growing population in these countries is also expected to increase the volume of healthcare data in their respective healthcare systems. This represents a significant growth opportunity for players operating in the market.

Restraint: Use of outdated legacy systems

Legacy systems (usually electronic medical record systems) with limited interoperability capabilities are those systems implemented prior to the introduction of common national standards. These systems are still in use today. Their data storage, input, and inventory of data items are unique and often proprietary. The problem associated with legacy systems is that they are designed for a particular task or facility. Many of these systems are designed to prevent data exchange with other vendors' solutions to protect market shares and encourage purchases by hospitals or clinic chains. The information in healthcare facilities is also enormously complex because it covers different types of data, such as patient administration, organisational information, clinical data, and laboratory and pathology data.

However, safe and effective healthcare relies heavily on the ability to exchange data from one software to another and from one person to another. Hence, the connection of legacy systems to the healthcare network is one solution to achieving complete interoperability in healthcare. This is because legacy systems are critical to medicine, and they cannot be shut down by interoperable systems. However, the growth of incompatible medical terminologies within the healthcare domain is exponential, thus contributing to the problem of interoperability. This is because heterogeneous terminologies consist of multiple representations for the same clinical concept. Hence, these factors are expected to pose a major restraint on the growth of the healthcare information exchange market.

Challenge: Data privacy concerns

Health information exchange solutions have several useful applications in healthcare. However, the adoption of these solutions is restricted to an extent owing to data security and privacy concerns. Patient health data is protected under federal laws in many countries, and any data breaches or failure to maintain its integrity result in financial and legal penalties. Patient data contains private, personal, or confidential information and requires strict safeguarding to prevent its misuse. These solutions are required to adhere to all the data security protocols implemented by governments and regulatory authorities, since the interoperable solutions used for patient care require access to multiple health data sets. However, this is a difficult task as most interoperability platforms are consolidated and require extensive computing power, owing to which patient data, or parts of it, can be required to reside in a vendor's data center.

Further, health information exchange solutions that connect and share patient-generated data increase the number of potential vulnerabilities within a system. In most healthcare organizations, a multitude of such solutions are deployed on the same network. Networking technologies such as second-generation ultrasound and RTLS also add an extra layer to already complicated networks. These outside networks may or may not be as secure or protected as required. The information being transferred over these networks can be accessed by external parties, such as government agencies, data collectors, or hackers. This might interfere with the privacy of the concerned individual and pose a security threat to the organization. Also, personal information might be passed to the wrong recipient and may be misused, eventually causing a security breach. Thus, concerns regarding data privacy and security are likely to hinder the adoption of healthcare interoperability solutions, which, in turn, may challenge market growth to a certain extent.

The Asia Pacific region is expected to register the highest growth in the health information exchange market during the forecast period.

The high regional growth can be attributed to the various government initiatives to support healthcare interoperability, advancements in the healthcare infrastructure, and the growing investments by global HCIT companies in the Asia Pacific market to capitalize on the growing opportunities.

Health Information Exchange Market by Region

Epic Systems Corporation (US), Cerner Corporation (US), Health Catalyst (US), Intersystems Corporation (US), and MEDITECH (US) are some of the leading players in the health information exchange market.

Health Information Exchange Market Report Scope

Report Metric

Details

Market Revenue in 2020

$1.1 billion

Projected Revenue by 2025

$2.0 billion

Revenue Rate

Poised to grow at a CAGR of 12.2%

Market Driver

Growing focus on patient-centric care delivery

Market Opportunity

Improving healthcare infrastructure in emerging markets

This research report categorizes the health information exchange market to forecast revenue and analyze trends in each of the following submarkets:

By Setup Type

  • Private HIE
  • Public HIE

By Implementation Model

  • Hybrid Models
  • Centralized Models
  • Decentralized/Federated Models Gastrointestinal Surgeries

By Type

  • Directed Exchange
  • Query-based Exchange
  • Consumer-mediated Exchange

By Application

  • Web Portal Development
  • Workflow Management
  • Secure Messaging
  • Internal Interfacing
  • Other Applications

By Solution

  • Portal-centric Solutions
  • Messaging-centric Solutions
  • Platform-centric Solutions

By End User

  • Healthcare Providers
  • Healthcare Payers
  • Pharmacies

By Region

  • North America
    • US
    • Canada
  • Europe
    • Germany
    • UK
    • France
    • Rest of Europe (RoE)
  • Asia Pacific
    • Japan
    • China
    • India
    • Rest of APAC (RoAPAC)
  • RoW

Recent Developments

  • In 2021, MEDITECH (US) entered into an agreement with Steward Health Care, wherein the latter implemented MEDITECH’s EHR system in 18 sites located across Arizona, Texas, Utah, Arkansas, and Louisiana. This decision was a part of Steward’s “One Platform” strategy to bring all 35 hospitals under a single HER
  • In 2021, Change Healthcare launched its nationwide Clinical Data Retrieval Solution, a new cloud-based interoperability solution that makes it possible for payers to quickly and easily retrieve patient records from the electronic health record (EHR) systems
  • In 2020, Epic Systems Corporation partnered with Adena Health System to implement Epic’s EHR across Adena’s health system. This partnership will help increase patient data exchange with the Ohio State Wexner Medical Center.
  • In 2020, Health Catalyst (US) entered into a multi-year strategic partnership with Middle East Healthcare Company (MEAHCO) (Saudi Arabia).Under this partnership, six Saudi-German Hospitals in the Kingdom of Saudi Arabia (KSA) will have access to Health Catalyst’s DOS technology.
  • In 2019, Cerner Corporation collaborated with Amazon Web Services, Inc. (AWS).Under this collaboration agreement, Cerner Corporation (US) named AWS its preferred cloud provider. The agreement also focuses on accelerating Artificial Intelligence (AI), Machine Learning (ML), and other cutting-edge innovations in healthcare

Frequently Asked Questions (FAQ):

To speak to our analyst for a discussion on the above findings, click Speak to Analyst

TABLE OF CONTENTS

1 INTRODUCTION (Page No. - 25)
    1.1 OBJECTIVES OF THE STUDY
    1.2 MARKET DEFINITION
    1.3 INCLUSIONS AND EXCLUSIONS
           1.3.1 MARKETS COVERED
           FIGURE 1 HEALTH INFORMATION EXCHANGE MARKET SEGMENTATION
           1.3.2 YEARS CONSIDERED FOR THE REPORT
    1.4 CURRENCY
    1.5 LIMITATIONS
    1.6 STAKEHOLDERS
    1.7 SUMMARY OF CHANGES

2 RESEARCH METHODOLOGY (Page No. - 29)
    2.1 RESEARCH DATA
    2.2 RESEARCH METHODOLOGY STEPS
           FIGURE 2 RESEARCH METHODOLOGY: HEALTH INFORMATION EXCHANGE MARKET
           FIGURE 3 RESEARCH DESIGN
           2.2.1 SECONDARY DATA
                    2.2.1.1 Key data from secondary sources
           2.2.2 PRIMARY DATA
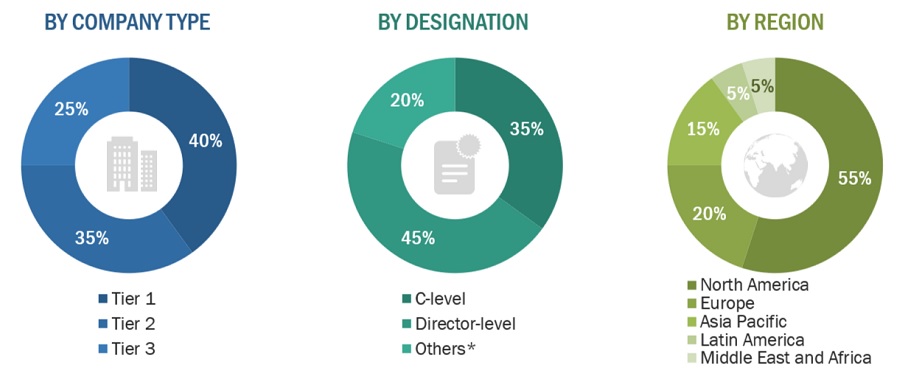
           FIGURE 4 BREAKDOWN OF PRIMARY INTERVIEWS: BY COMPANY TYPE, DESIGNATION, AND REGION
           FIGURE 5 PRIMARY SOURCES
                    2.2.2.1 Key data from primary sources
    2.3 MARKET SIZE ESTIMATION METHODOLOGY
           FIGURE 6 RESEARCH METHODOLOGY: HYPOTHESIS BUILDING
           FIGURE 7 MARKET SIZE ESTIMATION: REVENUE SHARE ANALYSIS
           FIGURE 8 ADOPTION-BASED MARKET SIZE ESTIMATION: GLOBAL MARKET
    2.4 MARKET DATA ESTIMATION AND TRIANGULATION
           FIGURE 9 DATA TRIANGULATION METHODOLOGY
    2.5 ASSUMPTIONS FOR THE STUDY
    2.6 COVID-19-SPECIFIC ASSUMPTIONS
    2.7 RISK ASSESSMENT
           TABLE 1 RISK ASSESSMENT: GLOBAL MARKET

3 EXECUTIVE SUMMARY (Page No. - 40)
           FIGURE 10 HIE MARKET, BY SETUP TYPE, 2020 VS. 2025 (USD MILLION)
           FIGURE 11 HIE MARKET, BY IMPLEMENTATION MODEL, 2020 VS. 2025 (USD MILLION)
           FIGURE 12 HIE MARKET, BY TYPE, 2020 VS. 2025 (USD MILLION)
           FIGURE 13 HIE MARKET, BY APPLICATION, 2020 VS. 2025 (USD MILLION)
           FIGURE 14 HIE MARKET, BY SOLUTION, 2020 VS. 2025 (USD MILLION)
           FIGURE 15 HIE MARKET, BY END USER, 2020 VS. 2025 (USD MILLION)
           FIGURE 16 GEOGRAPHICAL SNAPSHOT OF THE GLOBAL MARKET

4 PREMIUM INSIGHTS (Page No. - 45)
    4.1 GLOBAL HEALTH INFORMATION EXCHANGE MARKET OVERVIEW
           FIGURE 17 EMPHASIS ON COST CONTROL IS EXPECTED TO DRIVE THE HIE MARKET
    4.2 NORTH AMERICA: HIE MARKET, BY SETUP TYPE, 2019
           FIGURE 18 PRIVATE HIE ACCOUNTED FOR THE LARGEST SHARE OF THE NORTH AMERICAN HIE MARKET IN 2019
    4.3 HIE MARKET, BY IMPLEMENTATION MODEL
           FIGURE 19 HYBRID MODELS ACCOUNTED FOR THE LARGEST MARKET SHARE IN 2020
    4.4 HIE MARKET: GEOGRAPHIC GROWTH OPPORTUNITIES
           FIGURE 20 ASIA PACIFIC TO WITNESS THE HIGHEST GROWTH DURING THE FORECAST PERIOD

5 MARKET OVERVIEW (Page No. - 48)
    5.1 INTRODUCTION
    5.2 MARKET DYNAMICS
           FIGURE 21 HEALTH INFORMATION EXCHANGE MARKET: DRIVERS, RESTRAINTS, OPPORTUNITIES, AND CHALLENGES
           5.2.1 DRIVERS
                    5.2.1.1 Government support for the adoption of EMR solutions
                    5.2.1.2 Growing focus on patient-centric care delivery
                    5.2.1.3 Need to curtail healthcare costs
                    5.2.1.4 Government initiatives for enhancing patient safety and care
                    5.2.1.5 Government funding for healthcare interoperability
           5.2.2 RESTRAINTS
                    5.2.2.1 Need for significant investments in infrastructure development and high cost of deployment
                    5.2.2.2 Lack of true interoperability solutions
                    5.2.2.3 Use of outdated legacy systems
           5.2.3 OPPORTUNITIES
                    5.2.3.1 Improving healthcare infrastructure in emerging markets
           5.2.4 CHALLENGES
                    5.2.4.1 Data privacy concerns
    5.3 IMPACT OF COVID-19 ON THE GLOBAL MARKET
           FIGURE 22 IMPACT OF COVID-19 ON THE HIE MARKET
    5.4 ECOSYSTEM ANALYSIS
           FIGURE 23 GLOBAL MARKET: ECOSYSTEM
    5.5 TECHNOLOGY ANALYSIS
    5.6 RULES & REGULATIONS
           5.6.1 CMS INTEROPERABILITY AND PATIENT ACCESS FINAL RULE
           5.6.2 CMS INTEROPERABILITY AND PRIOR AUTHORIZATION PROPOSED RULE
           5.6.3 OFFICE OF THE NATIONAL COORDINATOR FOR HEALTH INFORMATION TECHNOLOGY’S (ONC) 21ST CENTURY CURES ACT FINAL RULE
           5.6.4 GENERAL DATA PROTECTION REGULATION (GDPR)
    5.7 PRICING ANALYSIS
    5.8 CASE STUDIES
           5.8.1 WIRRAL UNIVERSITY TEACHING HOSPITAL NHS FOUNDATION TRUST (UK)
           5.8.2 RUSH HEALTH (US)

6 HEALTH INFORMATION EXCHANGE MARKET, BY SETUP TYPE (Page No. - 62)
    6.1 INTRODUCTION
           TABLE 2 HIE MARKET, BY SETUP TYPE, 2018–2025 (USD MILLION)
    6.2 PRIVATE HIE
           6.2.1 PRIVATE HIE SEGMENT COMMANDED THE LARGEST SHARE OF THE HIE MARKET
           TABLE 3 PRIVATE HIE MARKET, BY REGION, 2018–2025 (USD MILLION)
    6.3 PUBLIC HIE
           6.3.1 GOVERNMENT FUNDING TO SUPPORT THE GROWTH OF THE PUBLIC HIE MARKET
           TABLE 4 PUBLIC HIE MARKET, BY REGION, 2018–2025 (USD MILLION)

7 HEALTH INFORMATION EXCHANGE MARKET, BY IMPLEMENTATION MODEL (Page No. - 66)
    7.1 INTRODUCTION
           TABLE 5 HIE MARKET, BY IMPLEMENTATION MODEL, 2018–2025 (USD MILLION)
    7.2 HYBRID MODELS
           7.2.1 HYBRID MODELS COMMANDED THE LARGEST SHARE OF THE GLOBAL MARKET
           TABLE 6 HIE MARKET FOR HYBRID MODELS, BY REGION, 2018–2025 (USD MILLION)
    7.3 CENTRALIZED MODELS
           7.3.1 PRIVACY AND SECURITY CONCERNS ARE THE MAJOR FACTORS HINDERING THE ADOPTION OF CENTRALIZED HIE MODELS
           TABLE 7 HIE MARKET FOR CENTRALIZED MODELS, BY REGION, 2018–2025 (USD MILLION)
    7.4 DECENTRALIZED/FEDERATED MODELS
           7.4.1 BENEFITS SUCH AS REAL-TIME UPDATED DATA AVAILABILITY AND INCREASED SECURITY ARE DRIVING THE ADOPTION OF DECENTRALIZED HIE MODELS
           TABLE 8 HIE MARKET FOR DECENTRALIZED/FEDERATED MODELS, BY REGION, 2018–2025 (USD MILLION)

8 HEALTH INFORMATION EXCHANGE MARKET, BY TYPE (Page No. - 71)
    8.1 INTRODUCTION
           TABLE 9 HIE MARKET, BY TYPE, 2018–2025 (USD MILLION)
    8.2 DIRECTED EXCHANGE
           8.2.1 DIRECTED EXCHANGE SEGMENT COMMANDED THE LARGEST SHARE OF THE GLOBAL MARKET
           TABLE 10 DIRECTED EXCHANGE HIE MARKET, BY REGION, 2018–2025 (USD MILLION)
    8.3 QUERY-BASED EXCHANGE
           8.3.1 QUERY-BASED EXCHANGE SEGMENT TO REGISTER THE HIGHEST GROWTH RATE DURING THE FORECAST PERIOD
           TABLE 11 QUERY-BASED HIE MARKET, BY REGION, 2018–2025 (USD MILLION)
    8.4 CONSUMER-MEDIATED EXCHANGE
           8.4.1 GROWING PATIENT-PHYSICIAN INTERACTION TO DRIVE THE POPULARITY OF CONSUMER-MEDIATED EXCHANGE SOLUTIONS
           TABLE 12 CONSUMER-MEDIATED HIE MARKET, BY REGION,2018–2025 (USD MILLION)

9 HEALTH INFORMATION EXCHANGE MARKET, BY APPLICATION (Page No. - 75)
    9.1 INTRODUCTION
           TABLE 13 HIE MARKET, BY APPLICATION, 2018–2025 (USD MILLION)
    9.2 WEB PORTAL DEVELOPMENT
           9.2.1 WEB PORTAL DEVELOPMENT APPLICATIONS TO COMMAND THE LARGEST SHARE OF THE HIE MARKET
           TABLE 14 HIE MARKET FOR WEB PORTAL DEVELOPMENT APPLICATIONS, BY REGION, 2018–2025 (USD MILLION)
    9.3 WORKFLOW MANAGEMENT
           9.3.1 BETTER DECISION-MAKING FOR ENHANCED PATIENT CARE TO DRIVE THE MARKET FOR WORKFLOW MANAGEMENT APPLICATIONS
           TABLE 15 HIE MARKET FOR WORKFLOW MANAGEMENT APPLICATIONS, BY REGION, 2018–2025 (USD MILLION)
    9.4 SECURE MESSAGING
           9.4.1 ABILITY TO PROVIDE SECURE COMMUNICATION WITHIN AND OUTSIDE THE CARE NETWORK IS A MAJOR FACTOR DRIVING THE ADOPTION OF DSM AMONG PROVIDERS AND PAYERS
           TABLE 16 HIE MARKET FOR SECURE MESSAGING APPLICATIONS, BY REGION, 2018–2025 (USD MILLION)
    9.5 INTERNAL INTERFACING
           9.5.1 INTERNAL INTERFACING SEGMENT TO REGISTER THE HIGHEST GROWTH RATE DURING THE FORECAST PERIOD
           TABLE 17 HIE MARKET FOR INTERNAL INTERFACING APPLICATIONS, BY REGION, 2018–2025 (USD MILLION)
    9.6 OTHER APPLICATIONS
           TABLE 18 HIE MARKET FOR OTHER APPLICATIONS, BY REGION, 2018–2025 (USD MILLION)

10 HEALTH INFORMATION EXCHANGE MARKET, BY SOLUTION (Page No. - 82)
     10.1 INTRODUCTION
           TABLE 19 HIE MARKET, BY SOLUTION, 2018–2025 (USD MILLION)
     10.2 PORTAL-CENTRIC SOLUTIONS
             10.2.1 PORTAL-CENTRIC SOLUTIONS TO DOMINATE THE GLOBAL MARKET DURING THE FORECAST PERIOD
           TABLE 20 HIE MARKET FOR PORTAL-CENTRIC SOLUTIONS, BY REGION, 2018–2025 (USD MILLION)
     10.3 MESSAGING-CENTRIC SOLUTIONS
             10.3.1 HIGH PERFORMANCE AND RELIABILITY OF MESSAGING-CENTRIC SOLUTIONS TO DRIVE MARKET GROWTH
           TABLE 21 HIE MARKET FOR MESSAGING-CENTRIC SOLUTIONS, BY REGION, 2018–2025 (USD MILLION)
     10.4 PLATFORM-CENTRIC SOLUTIONS
             10.4.1 PLATFORM-CENTRIC SOLUTIONS TO REGISTER THE HIGHEST GROWTH RATE DURING THE FORECAST PERIOD
           TABLE 22 HIE MARKET FOR PLATFORM-CENTRIC SOLUTIONS, BY REGION, 2018–2025 (USD MILLION)

11 HEALTH INFORMATION EXCHANGE MARKET, BY END USER (Page No. - 87)
     11.1 INTRODUCTION
           TABLE 23 HIE MARKET, BY END USER, 2018–2025 (USD MILLION)
     11.2 HEALTHCARE PROVIDERS
             11.2.1 HEALTHCARE PROVIDERS COMMANDED THE LARGEST SHARE OF THE GLOBAL MARKET
           TABLE 24 HIE MARKET FOR HEALTHCARE PROVIDERS, BY REGION, 2018–2025 (USD MILLION)
     11.3 HEALTHCARE PAYERS
             11.3.1 EFFECTIVE MANAGEMENT OF PATIENT HEALTH RECORDS AND CLAIMS PROCESSING AND REIMBURSEMENT TASKS TO DRIVE THE ADOPTION OF HIE BY HEALTHCARE PAYERS
           TABLE 25 HIE MARKET FOR HEALTHCARE PAYERS, BY REGION, 2018–2025 (USD MILLION)
     11.4 PHARMACIES
             11.4.1 FOCUS ON PROVIDING INDIVIDUALIZED CARE AND SUPPORT TO PATIENTS TO DRIVE THE ADOPTION OF HIE AMONG PHARMACIES
           TABLE 26 HIE MARKET FOR PHARMACIES, BY REGION, 2018–2025 (USD MILLION)

12 HEALTH INFORMATION EXCHANGE MARKET, BY REGION (Page No. - 92)
     12.1 INTRODUCTION
           TABLE 27 HIE MARKET, BY REGION, 2018–2025 (USD MILLION)
     12.2 NORTH AMERICA
           FIGURE 24 NORTH AMERICA: HIE MARKET SNAPSHOT
           TABLE 28 NORTH AMERICA: HIE MARKET, BY COUNTRY, 2018–2025 (USD MILLION)
           TABLE 29 NORTH AMERICA: HIE MARKET, BY SETUP TYPE, 2018–2025 (USD MILLION)
           TABLE 30 NORTH AMERICA: HIE MARKET, BY IMPLEMENTATION MODEL, 2018–2025 (USD MILLION)
           TABLE 31 NORTH AMERICA: HIE MARKET, BY TYPE, 2018–2025 (USD MILLION)
           TABLE 32 NORTH AMERICA: HIE MARKET, BY APPLICATION, 2018–2025 (USD MILLION)
           TABLE 33 NORTH AMERICA: HIE MARKET, BY SOLUTION, 2018–2025 (USD MILLION)
           TABLE 34 NORTH AMERICA: HIE MARKET, BY END USER, 2018–2025 (USD MILLION)
             12.2.1 US
                        12.2.1.1 The US dominates the North American market during the forecast period
           TABLE 35 US: HEALTH INFORMATION EXCHANGE MARKET, BY SETUP TYPE, 2018–2025 (USD MILLION)
           TABLE 36 US: HIE MARKET, BY IMPLEMENTATION MODEL, 2018–2025 (USD MILLION)
           TABLE 37 US: HIE MARKET, BY TYPE, 2018–2025 (USD MILLION)
           TABLE 38 US: HIE MARKET, BY APPLICATION, 2018–2025 (USD MILLION)
           TABLE 39 US: HIE MARKET, BY SOLUTION, 2018–2025 (USD MILLION)
           TABLE 40 US: HIE MARKET, BY END USER, 2018–2025 (USD MILLION)
             12.2.2 CANADA
                        12.2.2.1 Government initiatives to support the adoption of health information exchange solutions in Canada
           TABLE 41 CANADA: HEALTH INFORMATION EXCHANGE MARKET, BY SETUP TYPE, 2018–2025 (USD MILLION)
           TABLE 42 CANADA: HIE MARKET, BY IMPLEMENTATION MODEL, 2018–2025 (USD MILLION)
           TABLE 43 CANADA: HIE MARKET, BY TYPE, 2018–2025 (USD MILLION)
           TABLE 44 CANADA: HIE MARKET, BY APPLICATION, 2018–2025 (USD MILLION)
           TABLE 45 CANADA: HIE MARKET, BY SOLUTION, 2018–2025 (USD MILLION)
           TABLE 46 CANADA: HIE MARKET, BY END USER, 2018–2025 (USD MILLION)
     12.3 EUROPE
           TABLE 47 EUROPE: HIE MARKET, BY COUNTRY, 2018–2025 (USD MILLION)
           TABLE 48 EUROPE: HIE MARKET, BY SETUP TYPE, 2018–2025 (USD MILLION)
           TABLE 49 EUROPE: HIE MARKET, BY IMPLEMENTATION MODEL, 2018–2025 (USD MILLION)
           TABLE 50 EUROPE: HIE MARKET, BY TYPE,2018–2025 (USD MILLION)
           TABLE 51 EUROPE: HIE MARKET, BY APPLICATION, 2018–2025 (USD MILLION)
           TABLE 52 EUROPE: HIE MARKET, BY SOLUTION, 2018–2025 (USD MILLION)
           TABLE 53 EUROPE: HIE MARKET, BY END USER, 2018–2025 (USD MILLION)
             12.3.1 GERMANY
                        12.3.1.1 Germany dominates the European market during the forecast period
           TABLE 54 GERMANY: HEALTH INFORMATION EXCHANGE MARKET, BY SETUP TYPE, 2018–2025 (USD MILLION)
           TABLE 55 GERMANY: HIE MARKET, BY IMPLEMENTATION MODEL, 2018–2025 (USD MILLION)
           TABLE 56 GERMANY: HIE MARKET, BY TYPE, 2018–2025 (USD MILLION)
           TABLE 57 GERMANY: HIE MARKET, BY APPLICATION, 2018–2025 (USD MILLION)
           TABLE 58 GERMANY: HIE MARKET, BY SOLUTION, 2018–2025 (USD MILLION)
           TABLE 59 GERMANY: HIE MARKET, BY END USER, 2018–2025 (USD MILLION)
             12.3.2 UK
                        12.3.2.1 Growing patient volumes to drive market growth in the UK
           TABLE 60 UK: HEALTH INFORMATION EXCHANGE MARKET, BY SETUP TYPE, 2018–2025 (USD MILLION)
           TABLE 61 UK: HIE MARKET, BY IMPLEMENTATION MODEL, 2018–2025 (USD MILLION)
           TABLE 62 UK: HIE MARKET, BY TYPE, 2018–2025 (USD MILLION)
           TABLE 63 UK: HIE MARKET, BY APPLICATION, 2018–2025 (USD MILLION)
           TABLE 64 UK: HIE MARKET, BY SOLUTION, 2018–2025 (USD MILLION)
           TABLE 65 UK: HIE MARKET, BY END USER, 2018–2025 (USD MILLION)
             12.3.3 FRANCE
                        12.3.3.1 Favorable government initiatives to drive the market for health information exchange solutions in the country in the coming years
           TABLE 66 FRANCE: HEALTH INFORMATION EXCHANGE MARKET, BY SETUP TYPE, 2018–2025 (USD MILLION)
           TABLE 67 FRANCE: HIEMARKET, BY IMPLEMENTATION MODEL, 2018–2025 (USD MILLION)
           TABLE 68 FRANCE: HIE MARKET, BY TYPE, 2018–2025 (USD MILLION)
           TABLE 69 FRANCE: HIE MARKET, BY APPLICATION, 2018–2025 (USD MILLION)
           TABLE 70 FRANCE: HIE MARKET, BY SOLUTION, 2018–2025 (USD MILLION)
           TABLE 71 FRANCE: HIE MARKET, BY END USER, 2018–2025 (USD MILLION)
             12.3.4 REST OF EUROPE
           TABLE 72 ROE: HIE MARKET, BY SETUP TYPE, 2018–2025 (USD MILLION)
           TABLE 73 ROE: HIE MARKET, BY IMPLEMENTATION MODEL, 2018–2025 (USD MILLION)
           TABLE 74 ROE: HIE MARKET, BY TYPE, 2018–2025 (USD MILLION)
           TABLE 75 ROE: HIE MARKET, BY APPLICATION, 2018–2025 (USD MILLION)
           TABLE 76 ROE: HIE MARKET, BY SOLUTION, 2018–2025 (USD MILLION)
           TABLE 77 ROE: HIE MARKET, BY END USER, 2018–2025 (USD MILLION)
     12.4 ASIA PACIFIC
           FIGURE 25 ASIA PACIFIC: MARKET SNAPSHOT
           TABLE 78 ASIA PACIFIC: MARKET, BY COUNTRY, 2018–2025 (USD MILLION)
           TABLE 79 ASIA PACIFIC: MARKET, BY SETUP TYPE, 2018–2025 (USD MILLION)
           TABLE 80 ASIA PACIFIC: MARKET, BY IMPLEMENTATION MODEL, 2018–2025 (USD MILLION)
           TABLE 81 ASIA PACIFIC: MARKET, BY TYPE, 2018–2025 (USD MILLION)
           TABLE 82 ASIA PACIFIC: MARKET, BY APPLICATION, 2018–2025 (USD MILLION)
           TABLE 83 ASIA PACIFIC: MARKET, BY SOLUTION, 2018–2025 (USD MILLION)
           TABLE 84 ASIA PACIFIC: MARKET, BY END USER, 2018–2025 (USD MILLION)
             12.4.1 JAPAN
                        12.4.1.1 Japan is the largest healthcare IT market in the APAC
           TABLE 85 JAPAN: MARKET, BY SETUP TYPE, 2018–2025 (USD MILLION)
           TABLE 86 JAPAN: MARKET, BY IMPLEMENTATION MODEL, 2018–2025 (USD MILLION)
           TABLE 87 JAPAN: MARKET, BY TYPE, 2018–2025 (USD MILLION)
           TABLE 88 JAPAN: MARKET, BY APPLICATION, 2018–2025 (USD MILLION)
           TABLE 89 JAPAN: MARKET, BY SOLUTION, 2018–2025 (USD MILLION)
           TABLE 90 JAPAN: MARKET, BY END USER, 2018–2025 (USD MILLION)
             12.4.2 CHINA
                        12.4.2.1 Large patient population and healthcare infrastructure improvements to drive market growth in China
           TABLE 91 CHINA: MARKET, BY SETUP TYPE, 2018–2025 (USD MILLION)
           TABLE 92 CHINA: MARKET, BY IMPLEMENTATION MODEL, 2018–2025 (USD MILLION)
           TABLE 93 CHINA: MARKET, BY TYPE, 2018–2025 (USD MILLION)
           TABLE 94 CHINA: MARKET, BY APPLICATION, 2018–2025 (USD MILLION)
           TABLE 95 CHINA: MARKET, BY SOLUTION, 2018–2025 (USD MILLION)
           TABLE 96 CHINA: MARKET, BY END USER, 2018–2025 (USD MILLION)
             12.4.3 INDIA
                        12.4.3.1 Rising need for cost-effective technologies has increased the demand for healthcare IT integration solutions in India
           TABLE 97 INDIA: HEALTH INFORMATION EXCHANGE MARKET, BY SETUP TYPE, 2018–2025 (USD MILLION)
           TABLE 98 INDIA: MARKET, BY IMPLEMENTATION MODEL, 2018–2025 (USD MILLION)
           TABLE 99 INDIA: MARKET, BY TYPE, 2018–2025 (USD MILLION)
           TABLE 100 INDIA: MARKET, BY APPLICATION, 2018–2025 (USD MILLION)
           TABLE 101 INDIA: MARKET, BY SOLUTION, 2018–2025 (USD MILLION)
           TABLE 102 INDIA: MARKET, BY END USER, 2018–2025 (USD MILLION)
             12.4.4 ROAPAC
           TABLE 103 REST OF ASIA PACIFIC: MARKET, BY SETUP TYPE, 2018–2025 (USD MILLION)
           TABLE 104 REST OF ASIA PACIFIC: MARKET, BY IMPLEMENTATION MODEL, 2018–2025 (USD MILLION)
           TABLE 105 REST OF ASIA PACIFIC: MARKET, BY TYPE, 2018–2025 (USD MILLION)
           TABLE 106 REST OF ASIA PACIFIC: MARKET, BY APPLICATION, 2018–2025 (USD MILLION)
           TABLE 107 REST OF ASIA PACIFIC: MARKET, BY SOLUTION, 2018–2025 (USD MILLION)
           TABLE 108 REST OF ASIA PACIFIC: MARKET, BY END USER, 2018–2025 (USD MILLION)
     12.5 REST OF THE WORLD
           TABLE 109 REST OF THE WORLD: MARKET, BY SETUP TYPE, 2018–2025 (USD MILLION)
           TABLE 110 REST OF THE WORLD: MARKET, BY IMPLEMENTATION MODEL, 2018–2025 (USD MILLION)
           TABLE 111 REST OF THE WORLD: MARKET, BY TYPE, 2018–2025 (USD MILLION)
           TABLE 112 REST OF THE WORLD: MARKET, BY APPLICATION, 2018–2025 (USD MILLION)
           TABLE 113 REST OF THE WORLD: MARKET, BY SOLUTION, 2018–2025 (USD MILLION)
           TABLE 114 REST OF THE WORLD: MARKET, BY END USER, 2018–2025 (USD MILLION)

13 COMPETITIVE LANDSCAPE (Page No. - 136)
     13.1 INTRODUCTION
     13.2 MARKET EVALUATION FRAMEWORK
           FIGURE 26 MARKET EVALUATION FRAMEWORK
     13.3 PRODUCT FOOTPRINT ANALYSIS OF THE TOP PLAYERS IN THE HEALTH INFORMATION EXCHANGE MARKET
           TABLE 115 COMPANY INDUSTRY FOOTPRINT
           TABLE 116 COMPANY REGION FOOTPRINT
     13.4 MARKET RANKING/SHARE ANALYSIS
           TABLE 117 GLOBAL MARKET RANKING ANALYSIS, BY PLAYER, 2019
     13.5 COMPANY EVALUATION MATRIX DEFINITIONS AND METHODOLOGY
           TABLE 118 COMPANY EVALUATION MATRIX: CRITERIA
             13.5.1 STARS
             13.5.2 EMERGING LEADERS
             13.5.3 PERVASIVE PLAYERS
             13.5.4 PARTICIPANTS
           FIGURE 27 GLOBAL MARKET: COMPANY EVALUATION MATRIX, 2019
     13.6 COMPETITIVE LEADERSHIP MAPPING (EMERGING PLAYERS)
             13.6.1 PROGRESSIVE COMPANIES
             13.6.2 STARTING/EMERGING BLOCKS
             13.6.3 RESPONSIVE COMPANIES
             13.6.4 DYNAMIC COMPANIES
           FIGURE 28 GLOBAL MARKET (GLOBAL) COMPETITIVE LEADERSHIP MAPPING, EMERGING PLAYERS, 2019
     13.7 COMPETITIVE SITUATIONS AND TRENDS
             13.7.1 PRODUCT LAUNCHES & APPROVALS
           TABLE 119 KEY PRODUCT LAUNCHES & APPROVALS, 2018–2020
             13.7.2 DEALS
           TABLE 120 KEY DEALS, 2018–2020
             13.7.3 OTHER DEVELOPMENTS
           TABLE 121 OTHER KEY DEVELOPMENTS, 2018–2020

14 COMPANY PROFILES (Page No. - 146)
     14.1 KEY PLAYERS
(Business Overview, Products Offered, Recent Developments, MnM View)* 
             14.1.1 EPIC SYSTEMS CORPORATION
           TABLE 122 EPIC SYSTEMS CORPORATION: BUSINESS OVERVIEW
             14.1.2 CERNER CORPORATION
           TABLE 123 CERNER CORPORATION: BUSINESS OVERVIEW
           FIGURE 29 CERNER CORPORATION: COMPANY SNAPSHOT (2019)
             14.1.3 HEALTH CATALYST
           TABLE 124 HEALTH CATALYST: BUSINESS OVERVIEW
           FIGURE 30 HEALTH CATALYST: COMPANY SNAPSHOT (2019)
             14.1.4 MEDICAL INFORMATION TECHNOLOGY, INC.
           TABLE 125 MEDITECH: BUSINESS OVERVIEW
           FIGURE 31 MEDITECH: COMPANY SNAPSHOT (2019)
             14.1.5 CHANGE HEALTHCARE
           TABLE 126 CHANGE HEALTHCARE: BUSINESS OVERVIEW
           FIGURE 32 CHANGE HEALTHCARE: COMPANY SNAPSHOT (2019)
             14.1.6 ALLSCRIPTS HEALTHCARE SOLUTIONS, INC.
           TABLE 127 ALLSCRIPTS HEALTHCARE SOLUTIONS, INC.: BUSINESS OVERVIEW
           FIGURE 33 ALLSCRIPTS HEALTHCARE SOLUTIONS, INC.: COMPANY SNAPSHOT (2019)
             14.1.7 INTERSYSTEMS CORPORATION
           TABLE 128 INTERSYSTEMS CORPORATION: BUSINESS OVERVIEW
             14.1.8 ECLINICALWORKS
           TABLE 129 ECLINICALWORKS: BUSINESS OVERVIEW
             14.1.9 UNITEDHEALTH GROUP
           TABLE 130 UNITEDHEALTH GROUP: BUSINESS OVERVIEW
           FIGURE 34 UNITEDHEALTH GROUP: COMPANY SNAPSHOT (2019)
             14.1.10 NEXTGEN HEALTHCARE INC.
           TABLE 131 NEXTGEN HEALTHCARE INC.: BUSINESS OVERVIEW
           FIGURE 35 NEXTGEN HEALTHCARE INC.: COMPANY SNAPSHOT (2019)
     14.2 OTHER PLAYERS
             14.2.1 ORION HEALTH
           TABLE 132 ORION HEALTH: BUSINESS OVERVIEW
             14.2.2 INFOR INC.
           TABLE 133 INFOR INC.: BUSINESS OVERVIEW
             14.2.3 OPENTEXT CORPORATION
           TABLE 134 OPENTEXT CORPORATION: BUSINESS OVERVIEW
           FIGURE 36 OPENTEXT CORPORATION: COMPANY SNAPSHOT (2019)
             14.2.4 ARCADIA SOLUTIONS, LLC
           TABLE 135 ARCADIA SOLUTIONS LLC: BUSINESS OVERVIEW
             14.2.5 AXIOM SYSTEMS
           TABLE 136 AXIOM SYSTEMS: BUSINESS OVERVIEW
             14.2.6 CIRACET
           TABLE 137 CIRACET: BUSINESS OVERVIEW
             14.2.7 MEDIPORTAL
           TABLE 138 MEDIPORTAL: BUSINESS OVERVIEW
             14.2.8 DATATRANS SOLUTIONS INC.
           TABLE 139 DATATRANS SOLUTIONS INC: BUSINESS OVERVIEW
             14.2.9 INXITE HEALTH SYSTEMS
           TABLE 140 INXITE HEALTH SYSTEMS: BUSINESS OVERVIEW
             14.2.10 LIGHTBEAM HEALTH SOLUTIONS
           TABLE 141 LIGHTBEAM HEALTH SOLUTIONS: BUSINESS OVERVIEW
*Business Overview, Products Offered, Recent Developments, MnM View might not be captured in case of unlisted companies. 

15 APPENDIX (Page No. - 192)
     15.1 DISCUSSION GUIDE
     15.2 KNOWLEDGE STORE: MARKETSANDMARKETS’ SUBSCRIPTION PORTAL
     15.3 AVAILABLE CUSTOMIZATIONS
     15.4 RELATED REPORTS
     15.5 AUTHOR DETAILS 
      

This study involved four major activities in estimating the size of the health information exchange market. Exhaustive secondary research was done to collect information on the market, peer market, and parent market. The next step was to validate these findings, assumptions, and sizing with industry experts across value chains through primary research. The bottom-up approach was employed to estimate the overall market size. After that, market breakdown and data triangulation were used to estimate the market size of segments and sub-segments.

Secondary Research

The secondary research process involved the widespread use of secondary sources, directories, databases (such as Bloomberg Businessweek, Factiva, and D&B Hoovers), white papers, annual reports, company house documents, investor presentations, and SEC filings of companies. Some non-exclusive secondary sources include Healthcare Information and Management Systems Society (HIMSS), American Medical Association (AMA), National Association for Trusted Exchange (NATE), US Health Resources and Services Administration (HRSA), Office of the National Coordinator for Health Information Technology (ONC), Agency for Healthcare Research and Quality (AHRQ), National Health Service (NHS), Healthcare IT News, Healthcare Informatics, Electronic Journal of Health Informatics (eJHI), Organisation for Economic Co-operation and Development (OECD), American Medical Group Association (AMGA), American Hospital Association (AHA), Expert Interviews, and MarketsandMarkets Analysis.

Secondary research was used to identify and collect information useful for the extensive, technical, market-oriented, and commercial study of the health information exchange market. It was also used to obtain important information about the key players and market classification and segmentation according to industry trends to the bottom-most level, and key developments related to market and technology perspectives. A database of the key industry leaders was also prepared using secondary research.

Primary Research

In the primary research process, various sources from both the supply and demand sides were interviewed to obtain qualitative and quantitative information for this report. The primary sources from the supply side include industry experts such as CEOs, vice presidents, marketing and sales directors, technology & innovation directors, and related key executives from various key companies and organizations operating in the health information exchange market. The primary sources from the demand side included industry experts, consultants, healthcare providers, healthcare payers, hospital administration, and government bodies. Primary research was conducted to validate the market segmentation, identify key players in the market, and gather insights on key industry trends and key market dynamics.

Health Information Exchange Market Size

To know about the assumptions considered for the study, download the pdf brochure

Market Size Estimation

Both top-down and bottom-up approaches were used to estimate and validate the total size of the health information exchange market. These methods were also used extensively to estimate the size of various subsegments in the market. The research methodology used to estimate the market size includes the following:

  • The key players in the industry and markets have been identified through extensive secondary research
  • The industry’s supply chain and market size, in terms of value, have been determined through primary and secondary research processes
  • All percentage shares, splits, and breakdowns have been determined using secondary sources and verified through primary sources

Data Triangulation

After arriving at the overall market size—using the market size estimation processes as explained above—the market was split into several segments and sub-segments. To complete the overall market engineering process and arrive at the exact statistics of each market segment and subsegment, the data triangulation, and market breakdown procedures were employed, wherever applicable. The data was triangulated by studying various factors and trends from both the demand and supply sides, in the provider, payer, and other industries.

Report Objectives

  • To define, describe, and forecast the global health information exchange market by setup type, implementation model, type,  application, solution, end user and region
  • To provide detailed information regarding the major factors influencing the market growth (such as drivers, restraints, opportunities, and challenges)
  • To analyze the micromarkets with respect to individual growth trends, prospects, and contributions to the overall health information exchange market
  • To analyze the opportunities for stakeholders and provide details of the competitive landscape for market leaders
  • To forecast the size of the market segments with respect to four main regions, namely,
  • North America, Europe, the Asia Pacific, and the Rest of the World
  • To profile the key players and analyze their market shares and core competencies
  • To track and analyze competitive developments such as product launches, partnerships, agreements, collaborations, expansions, and acquisitions in the overall health information exchange market

Available Customizations

MarketsandMarkets offers the following customizations for this market report:

  • Additional country-level analysis of health information exchange market.
  • Profiling of additional market players (up to 3)
Custom Market Research Services

We will customize the research for you, in case the report listed above does not meet with your exact requirements. Our custom research will comprehensively cover the business information you require to help you arrive at strategic and profitable business decisions.

Request Customization

Instant Answers with GPT - Ask Now!

Ask real questions. Get complete answers !
Report Code
HIT 2265
Published ON
Apr, 2021
Choose License Type
BUY NOW
  • SHARE
X
Request Customization
Speak to Analyst
Speak to Analyst
OR FACE-TO-FACE MEETING
PERSONALIZE THIS RESEARCH
  • Triangulate with your Own Data
  • Get Data as per your Format and Definition
  • Gain a Deeper Dive on a Specific Application, Geography, Customer or Competitor
  • Any level of Personalization
REQUEST A FREE CUSTOMIZATION
LET US HELP YOU!
  • What are the Known and Unknown Adjacencies Impacting the Health Information Exchange Market
  • What will your New Revenue Sources be?
  • Who will be your Top Customer; what will make them switch?
  • Defend your Market Share or Win Competitors
  • Get a Scorecard for Target Partners
CUSTOMIZED WORKSHOP REQUEST
+1-888-600-6441
  • Call Us
  • +1-888-600-6441 (Corporate office hours)
  • +1-888-600-6441 (US/Can toll free)
  • +44-800-368-9399 (UK office hours)
CONNECT WITH US
ABOUT TRUST ONLINE
©2024 MarketsandMarkets Research Private Ltd. All rights reserved
DMCA.com Protection Status Website Feedback