
Intumescent Coatings Market

Intumescent Coatings Market by Type (Thin-film and Thick-film), Substrate (Structural Steel & Cast Iron, Wood), Application Technique (Spray, Brush & Roller), End-use Industry (Building & Construction, Industrial, Aerospace), and Region - Global Forecast to 2030
Updated on : November 27, 2025


INTUMESCENT COATINGS MARKET OVERVIEW
Source: Secondary Research, Interviews with Experts, MarketsandMarkets Analysis
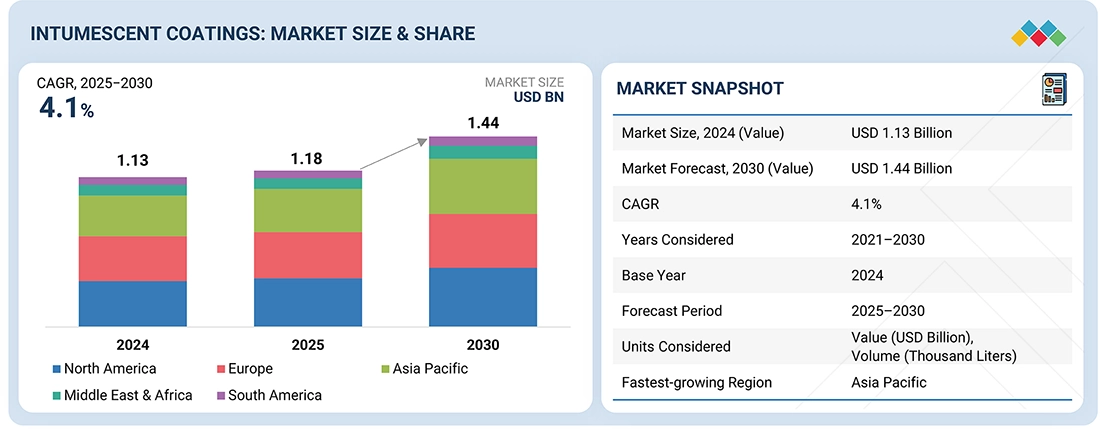
The global intumescent coatings market is projected to reach USD 1.44 billion by 2030 from USD 1.18 billion in 2025, at a CAGR of 4.1%. The market is going to experience significant growth in the forecast period, thanks to the ever-rising demand from building & construction, industrial, aerospace, and other end-use industries. One of the key growth factors is that fire safety regulations are growing in importance, which require the use of intumescent coatings on structural steel and other materials. The growing developments in construction, especially commercial and residential complexes, propel the market since these coatings can enhance both safety and durability of their application area. These coatings have now been adopted by the industrial sector to protect assets in refineries, chemical plants, and power plants where there are high fire hazards.
KEY TAKEAWAYS
-
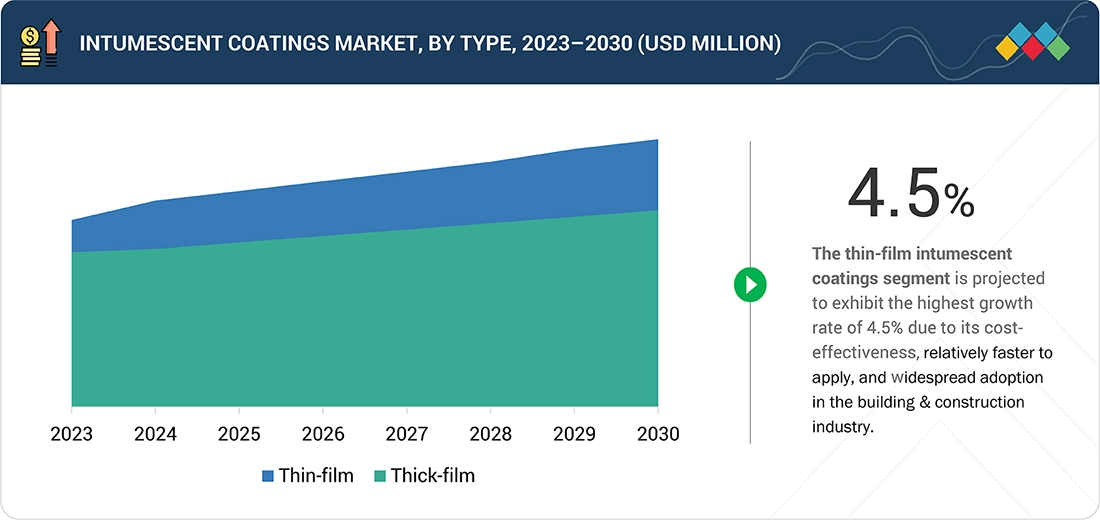
BY TYPEThe intumescent coatings market by type includes thin-film intumescent coatings and thick-film intumescent coatings. Thin-film intumescent coatings dominate the market in terms of demand, as they offer a high level of fire protection achieved with a thinness that does not pose a significant problem in terms of size and weight, especially in cases where space and weight are very important.
-
BY SUBSTRATEThe intumescent coatings market by substrate includes structural steel & cast iron, wood, and other substrates. The structural steel & cast iron segment held the largest market share in the intumescent coatings market due to their widespread use in construction and industrial applications.
-
BY APPLICATION TECHNIQUEThe intumescent coatings market by application technique includes spray and brush & rollers. The spray application method represented the largest share of the intumescent coatings market segment due to its effectiveness and versatility. Spray methods can cover large areas quickly, including structural steel and complex shapes, while ensuring uniformity and fire protection.
-
BY END-USE INDUSTRYThe intumescent coatings market by end-use industry includes building & construction, aerospace, industrial, and other end-use industries. The building & construction industry had the largest market share in the intumescent coatings industry due to a major requirement for passive fire protection for structural elements. With urbanization continuing and high-rise buildings on the rise, the protection of life and property is of utmost importance.
-
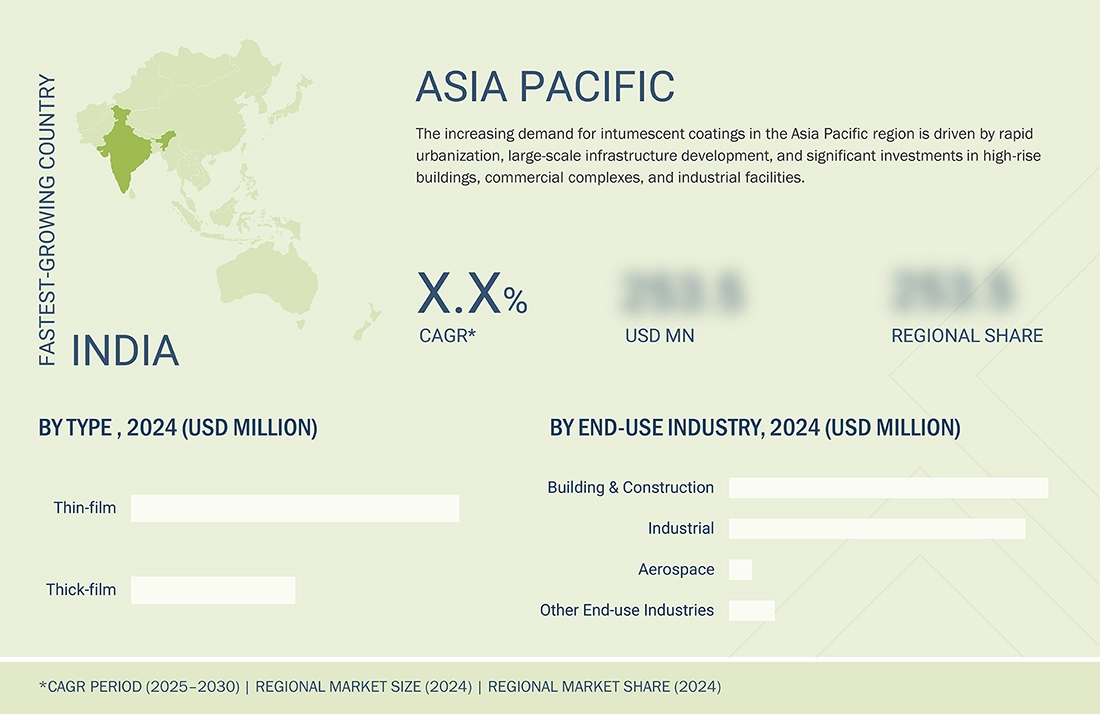
BY REGIONThe Asia Pacific is projected to grow the fastest, at a CAGR of 5.0%, driven by growing urbanization, the growth of infrastructure, and increasing fire regulations.
-
COMPETITIVE LANDSCAPESherwin-Williams (US), PPG (US), AkzoNobel (Netherlands), Jotun (Norway), and Hempel A/S (Denmark) are leading companies of intumescent coatings market. These companies are pursuing both organic and inorganic growth strategies, such as product launches, acquisitions, and expansions, to increase their market presence.
The intumescent coating market will continue to increase at a high rate in the world market due to the high demand for the same in sectors where activities are growing very fast, like construction, oil and gas, energy, transport, and aerospace. Following the large-scale use of high-rise buildings, advanced infrastructure, and industrial structures, which utilize structural steel as a construction material, there has been a massive demand for passive fire protection, which cannot be compromised. One of the solutions is the use of intumescent coating, which has safety and aesthetic benefits. The thick-film finishes in energy-intensive industries are important because they can be used to protect equipment and pipelines in harsh environments, whereas the thin-film finishes are becoming increasingly popular in the architectural industries due to their capability of providing finishes with less fire resistance but a smooth finish. The stricter building codes, insurance incentives, and stricter regulations requiring greater fire safety standards further support the market. Asia Pacific is the most growth-proponent due to urbanization, industrialization, and government-sponsored infrastructure development. With the increased levels of sustainability pressure, manufacturers are directing investment towards environmentally friendly low-VOC formulations and water-based technologies. These advances make intumescent coatings necessary facilitators of safer and more sustainable infrastructure and essential assets of future industries.
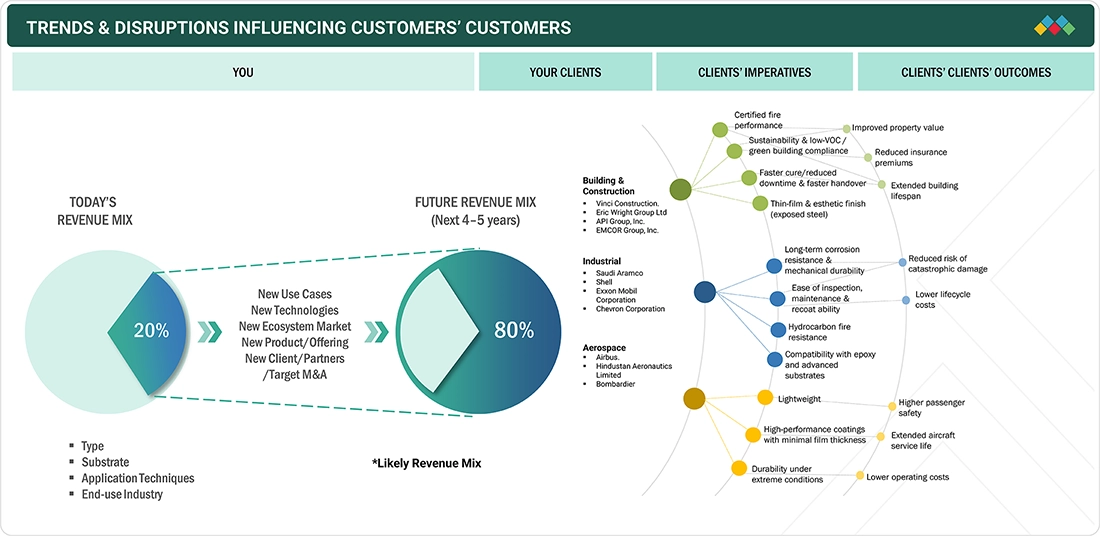
TRENDS & DISRUPTIONS IMPACTING CUSTOMERS' CUSTOMERS
The impact on consumers’ business emerges from customer trends or disruptions. Shifts, which are changing trends or disruptions, will impact the revenues of end users. One of the most significant trends shaping the intumescent coatings market is the rising emphasis on fire safety coupled with sustainability goals. End users across building & construction, industrial, aerospace, and other end-use industries are increasingly adopting intumescent coatings to meet stringent fire protection regulations while also minimizing environmental impact. Rapid urbanization and large-scale infrastructure projects globally have fueled the demand for advanced passive fire protection solutions. In commercial and residential buildings, intumescent coatings are being specified more frequently to protect structural steel and meet safety codes. On the other hand, innovation in coating chemistry and application methods is transforming the intumescent coatings market. The adoption of epoxy-based intumescents for hydrocarbon fire protection, as well as advancements in waterborne and hybrid systems, is allowing end users to balance safety, performance, and sustainability.
Source: Secondary Research, Interviews with Experts, MarketsandMarkets Analysis
MARKET DYNAMICS
Level
-
Stringent fire-safety regulations and building codes

-
Rising investments in construction

Level
-
Long, costly, certification and testing cycles

-
Stringent application and installation requirements

Level
-
Renovation and retrofitting of old buildings

-
Growth and development in emerging markets

Level
-
High competition and pricing pressure

Source: Secondary Research, Interviews with Experts, MarketsandMarkets Analysis
Driver: Awareness & insurance incentives
The intumescent coatings market is driven by awareness and insurance incentives. Passive fire protection is now becoming a priority for construction companies, industries, and owners of facilities due to the increased awareness of the disastrous effects of fire accidents on lives and properties and business continuity. This change is being strengthened by the insurance companies by providing lower costs and better terms of cover to projects and facilities that incorporate certified fire-resistant systems, such as intumescent coatings. This is not only motivating for adoption but also makes investment in such coatings cost-effective. Since corporate safety training, awareness initiatives, and risk evaluation are growing, the two-fold advantage of increased safety and reduced costs is driving demand faster, making intumescent coatings a must-have option in compliance and survival.
Restraint: Long, costly, certification and testing cycles
Long and costly certification and testing cycles act as a significant restraint for the intumescent coatings market. Since these coatings are passive fire protection systems, they are highly evaluated before they are permitted to be used to satisfy the international and regional fire safety requirements. The procedure involves extensive time, special equipment, and is expensive, and tends to delay the introduction of the product in the market and restrain the capacity of smaller producers to compete with the market leaders. Moreover, the differences between the regulatory requirements in different areas further complicate certification by making it necessary to undergo numerous testing and documentation processes. These hurdles escalate the total cost of development, slow down innovation, and limit entry into the market, putting up barricades that can hinder the pace of growth despite strong underlying demand.
Opportunity: Renovation and retrofitting of old buildings
Renovation and retrofitting of old buildings present a significant opportunity for the intumescent coatings market. Most of the structures, particularly in developed regions, were constructed prior to the introduction of modern fire safety measures, and hence they do not provide adequate protection. With more stringent building codes being implemented by governments and other regulatory authorities, owners of property are increasingly compelled to invest in upgrading their fire protection systems to achieve compliance and add to their safety measures. The use of intumescent coating presents a viable option because it does not require significant modification to structural steel, wood, and concrete, and as such can be easily sprayed on these materials and reduces the costs of projects that require retrofitting. This trend of urban redevelopment, heritage building preservation, and adaptive reuse of older infrastructure is increasingly a demand driver, making intumescent coating a major facilitator to re-engineered and safer buildings.
Challenge: High competition and pricing pressure
High competition and pricing pressure remain critical challenges in the intumescent coatings market. The presence of several global leaders together with a multitude of regional and local players has created a fragmented landscape, which has heightened competition in terms of price. Large firms can use their scale of operations, developed distribution channels, and strong brand recognition, and small manufacturers may counter it with cheaper substitute products or niche, tailored products. This dynamism exerts strain on profits, especially markets that are price sensitive, such as the Asia Pacific and South America. Meanwhile, the necessity to invest much in R&D, certification, and compliance contributes to the total expenses, and manufacturers cannot afford innovation and cost-effectiveness at once. Maintaining competitiveness and still gaining profitability consequently becomes a pressing challenge for industry participants.
Intumescent Coatings Market: COMMERCIAL USE CASES ACROSS INDUSTRIES
| COMPANY | USE CASE DESCRIPTION | BENEFITS |
|---|---|---|
 |
Sasol Chemicals USA - Lake Charles Chemical Project (LCCP) required a robust fireproofing and corrosion-resistant solution for modular and stick-built fabrication. Modules were manufactured in both the US and China and had to be transported across continents. | This offered resistance to cracking during long-distance cross-continental transportation and minimized the need for on-site fixing and rework, helping to maintain project schedules. |
 |
In this project, 28,000 m² (300,000 ft²) of structural steel required fireproofing to meet strict construction schedules set by CB&I for the expansion of the Reficar refinery in Cartagena, Colombia. | The PITT-CHAR XP coating provided robust fire protection, achieving a UL 1709 2-hour fire rating through its intumescent properties, which expand under heat to insulate the steel from extreme hydrocarbon fire scenarios. |
 |
The reconstruction of Wembley National Stadium in London took five years from 2002 to 2007. For this prestigious and iconic structure, the challenge was to provide an extremely durable anticorrosive and fire-protective coating system that would meet all British fire protection standards, while producing an attractive finish to complement the structure's visual appeal. | The complete anticorrosive and fire-protective coating system proposed and supplied by PPG for all externally and internally exposed steelwork of the stadium combined SIGMAFAST 302, SIGMACOVER 435, SIGMACOVER 456 HS, and SIGMADUR 520 coatings to provide a high level of anticorrosive protection tailored to the various environmental conditions around the stadium. |
Logos and trademarks shown above are the property of their respective owners. Their use here is for informational and illustrative purposes only.
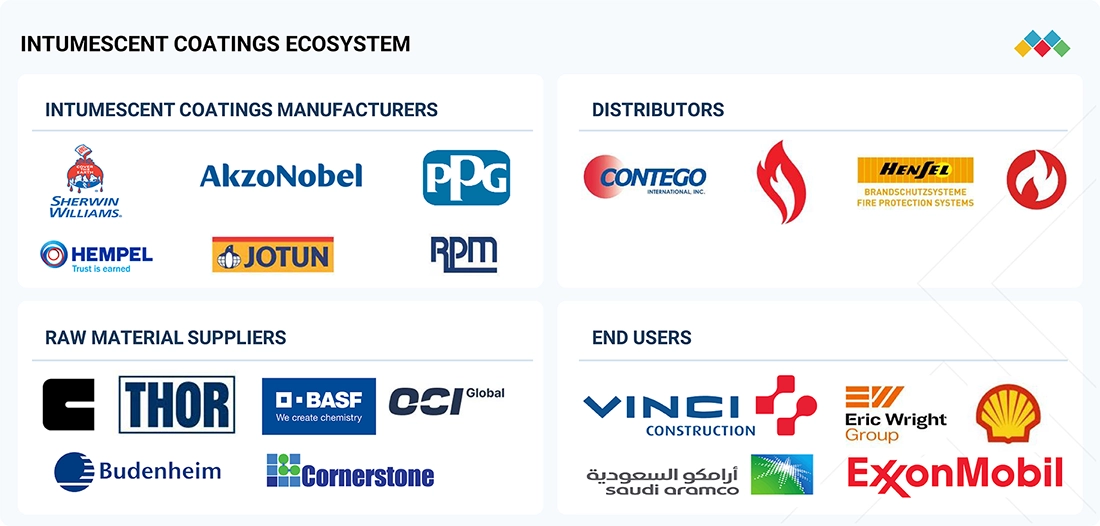
MARKET ECOSYSTEM
The market ecosystem of the intumescent coatings market involves a vertically integrated framework from raw material production to deployment in end-use applications across various industries. Key raw materials, including resins, fillers, and additives, are sourced and formulated to meet specific fire protection standards. Coating manufacturers develop and optimize formulations to enhance char formation, adhesion, and thermal insulation properties. These formulations undergo rigorous testing for fire resistance, durability, and compliance with building and safety regulations. Application techniques such as spraying, brushing, or rolling ensure uniform coverage on substrates like structural steel, wood, and cast iron. Finished coatings are then customized to meet the performance requirements of different end-use industries, including construction, transportation, and industrial facilities. Regulatory frameworks, sustainability initiatives, and evolving building codes influence production, innovation, and adoption. The integration of technological advancements in application methods and materials enhances efficiency, safety, and compliance across the value chain.
Logos and trademarks shown above are the property of their respective owners. Their use here is for informational and illustrative purposes only.
MARKET SEGMENTS
Source: Secondary Research, Interviews with Experts, MarketsandMarkets Analysis
Intumescent Coatings Market, By Type
In 2024, thin-film intumescent coatings captured the largest market share due to their efficient application and performance. Such coatings create a protective carbonaceous layer in the presence of heat, which in effect protects substrates and retards the structural degradation of structures in fire incidents. They are popular because they offer a high level of fire protection that is achieved with a thinness that does not pose a significant problem in terms of size and weight, especially in cases where space and weight are very important. Also, the aesthetic flexibility of the thin-film coatings enables them to be easily incorporated in the construction of buildings without jeopardizing security. Their prevalence in different sectors of the economy, such as construction and transport industries, is a testimony to their efficacy and consistency with high fire safety standards. This has given them an edge in the market as they have become the choice due to the combination of performance, efficiency and design flexibility.
Intumescent Coatings Market, By Substrate
In 2024, the structural steel & cast iron segment held the largest market share in the intumescent coatings market due to their widespread use in construction and industrial applications. These materials are integral to the structural integrity of buildings and infrastructure, necessitating effective fire protection solutions. Structural steel and cast iron are coated with an intumescent coating that expands in the presence of heat, creating an insulating layer of char that covers the substrate and prevents it from being damaged by fire. This expansion retards the transfer of heat, which keeps the structural integrity of important components intact in case there is a fire. The strict fire safety laws and the use of passive fire protection in construction are also other factors that spur the need to use intumescent coating on these surfaces. They are a good choice in the industry due to their efficiency in improving fire resistance.
Intumescent Coatings Market, By Application Technique
In 2024, the spray application method represented the largest share of the intumescent coatings market segment due to its effectiveness and versatility. Spray methods can cover large areas quickly, including structural steel and complex shapes, while ensuring uniformity and fire protection. Spray techniques provide flexibility to enable coatings to access complex locations that might be difficult with other methods, improving safety. Also, spray methods can help reduce labor costs and the time it takes to apply coatings, which is particularly useful with large projects. The added value of speed, uniformity, and a generally lower cost has made spray application the dominant application method in the intumescent coatings segment.
Intumescent Coatings Market, By End-Use Industry
In 2024, the building & construction industry accounted for the largest market share in the intumescent coatings industry due to a major requirement for passive fire protection for structural elements. With urbanization continuing and high-rise buildings on the rise, the protection of life and property is of utmost importance. Intumescent coatings applied to materials such as structural steel and wood expand when heat is applied to the surface, creating an insulating layer of char to slow the fire spread. This is necessary in order to comply with strict fire safety regulations and building codes. With the building industry becoming more focused on sustainable and efficient fire protection solutions, the use of intumescent coatings has been encouraged, strengthening their position in the market.
REGION
Asia Pacific's Urban Growth and Regulations Drive Intumescent Coatings Demand
The Asia Pacific region is set to be the fastest-growing intumescent coatings market, mainly due to urbanization, the growth of infrastructure, and increasing fire regulations. The rapid construction and industrial projects in countries like China and India require advanced fire protection. China’s dual goals of petrochemical independence and creating safer high-rises have driven demand for fire-resistant coatings in both cellulosic and hydrocarbons. India’s Smart Cities initiative, which stipulates passive fire protection in municipal projects, will also contribute to demand for intumescent coatings. Construction activity is increasing in Southeast Asian countries as well and is likely to drive demand for fireproofing materials. The region’s sustainability initiatives and desire to meet international building codes have favored the adoption of intumescent coatings as the market standard, and solidified its position.
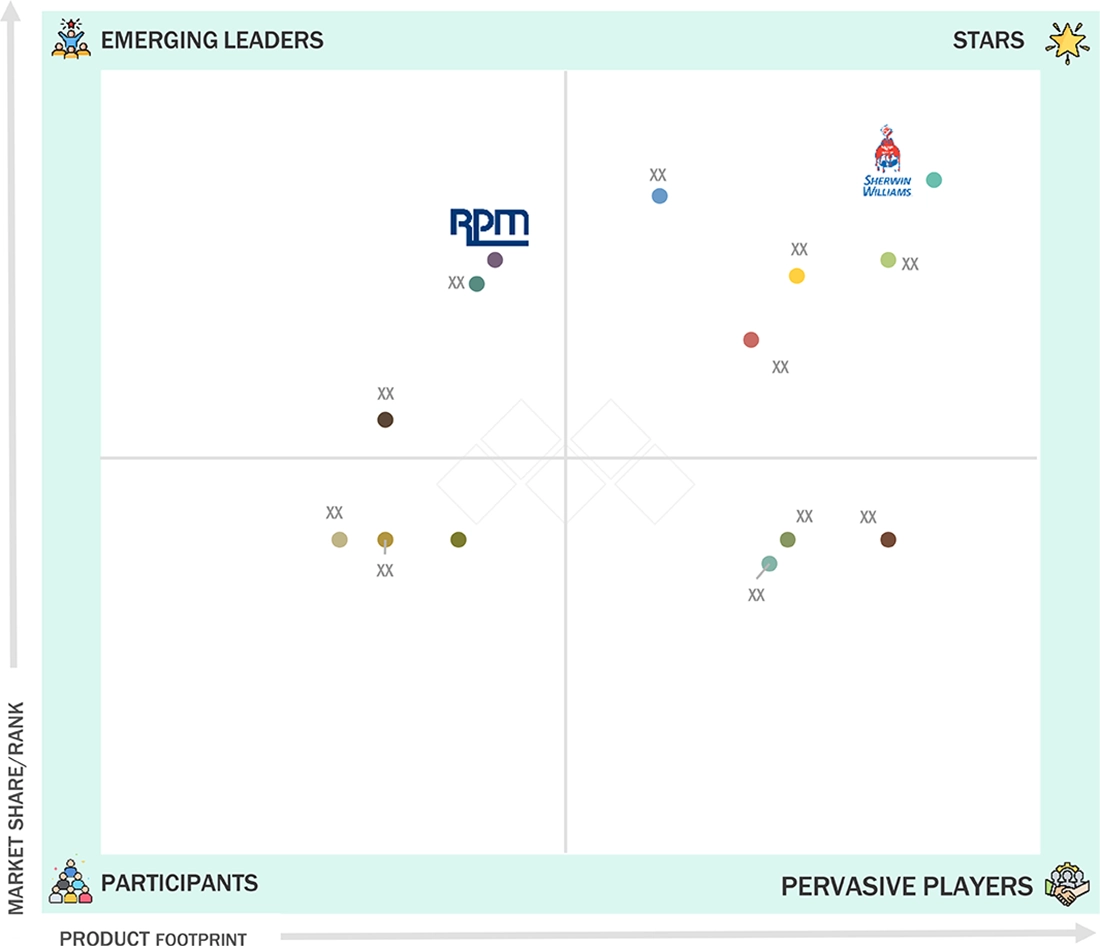
Intumescent Coatings Market: COMPANY EVALUATION MATRIX
In the intumescent coatings market matrix, Sherwin-Williams (Star) leads the market. It is the clear leader in the intumescent coatings market; the company has developed a strong position in construction and energy, utilizing a complete product range, long-standing technical reputation, and global supply chains to impact the market. RPM International, Inc. is an emerging leader that is developing momentum through R&D efforts, technical innovation, and coordination with specialty brands like Carboline and AD Fire Protection.
Source: Secondary Research, Interviews with Experts, MarketsandMarkets Analysis
KEY MARKET PLAYERS
MARKET SCOPE
| REPORT METRIC | DETAILS |
|---|---|
| Market Size, 2024 (Value) | USD 1.13 Billion |
| Market Forecast, 2030 (Value) | USD 1.44 Billion |
| Growth Rate | CAGR of 4.1% from 2025 to 2030 |
| Years Considered | 2021–2030 |
| Base Year | 2024 |
| Forecast Period | 2025–2030 |
| Units Considered | Value (USD Million), Volume (Thousand Liters) |
| Report Coverage | Revenue forecast, company ranking, competitive landscape, growth factors, and trends |
| Segments Covered |
|
| Regions Covered | North America, Asia Pacific, Europe, South America, the Middle East & Africa |
WHAT IS IN IT FOR YOU: Intumescent Coatings Market REPORT CONTENT GUIDE
DELIVERED CUSTOMIZATIONS
We have successfully delivered the following deep-dive customizations:
| CLIENT REQUEST | CUSTOMIZATION DELIVERED | VALUE ADDS |
|---|---|---|
| Cellulosic Fire Protection Intumescent Coatings |
|
|
RECENT DEVELOPMENTS
- March 2025 : Hempel A/S introduced Hempafire Extreme 550, an advanced epoxy-based passive fire protection (PFP) coating engineered for structural steel exposed to cellulosic fires.
- November 2024 : AkzoNobel unveiled Chartek ONE at ADIPEC 2024, a revolutionary single-coat, mesh-free epoxy intumescent passive fire protection (PFP) solution for the energy sector.
- September 2024 : PPG announced the launch of Steelguard 951 epoxy intumescent fire protection coating in the Americas region. It was designed for advanced manufacturing facilities, including semiconductor plants, electric vehicle battery facilities, data centers, and other commercial infrastructure.
- March 2024 : Sherwin-Williams launched FIRETEX FX7002, a solvent-based acrylic intumescent fire protection coating designed especially for steel in commercial construction.
- June 2023 : The Jotun announced the completion of a significant expansion of its Global Intumescent R&D Laboratory in Flixborough, UK, more than doubling its size to 2,900 m². This enhancement boosts the company's capacity for fire testing and product development, enabling faster innovation in intumescent fire protection coatings.
Table of Contents
 Exclusive indicates content/data unique to MarketsandMarkets and not available with any competitors.
Methodology
The study involved major activities for estimating the current size of the global intumescent coatings market. Exhaustive secondary research was carried out to collect information on the market, the peer product market, and the parent product group market. The next step was to validate these findings, assumptions, and sizes with the industry experts across the value chain of Intumescent Coatings through primary research. Both the top-down and bottom-up approaches were employed to estimate the overall size of the intumescent coatings market. After that, market breakdown and data triangulation procedures were used to determine the size of different segments and sub-segments of the market.
Secondary Research
The market for the companies offering intumescent coatings is arrived at by secondary data available through paid and unpaid sources, analyzing the product portfolios of the major companies in the ecosystem, and rating the companies by their performance and quality. Various secondary sources, such as Business Standard, Bloomberg, World Bank, and Factiva, were referred to to identify and collect information for this study on the Intumescent Coatings market. The secondary sources include annual reports, press releases, investor presentations of companies, white papers, journals, certified publications, and articles from recognized authors, directories, and databases. In the secondary research process, various secondary sources were referred to for identifying and collecting information related to the study. Secondary sources included annual reports, press releases, and investor presentations of Intumescent Coatings vendors, forums, certified publications, and whitepapers. The secondary research was used to obtain critical information on the industry’s value chain, the total pool of key players, market classification, and segmentation from the market and technology-oriented perspectives.
Primary Research
In the primary research process, various primary sources from both the supply and demand sides were interviewed to obtain qualitative and quantitative information for this report. The primary sources from the supply side included industry experts, such as C-level executives, directors, and related key executives from various key companies and organizations operating in the Intumescent Coatings market. After the complete market engineering (calculations for market statistics, market breakdown, market size estimations, market forecasting, and data triangulation), extensive primary research was conducted to gather information and verify and validate the critical numbers arrived at. Primary research was also conducted to identify the segmentation type, industry trends, competitive landscape of intumescent coatings offered by various market players, and key market dynamics, such as drivers, restraints, opportunities, challenges, industry trends, and key player strategies. In the complete market engineering process, the top-down and bottom-up approaches were extensively used, along with several data triangulation methods, to perform the market estimation and market forecasting for the overall market segments and subsegments listed in this report. Extensive qualitative and quantitative analysis was performed on the complete market engineering process to list the key information/insights throughout the report.
Following is the breakdown of primary respondents

Notes: Others include sales, marketing, and product managers.
Tier 1: >USD 1 Billion; Tier 2: USD 500 million–1 Billion; and Tier 3: < USD 500 million.
To know about the assumptions considered for the study, download the pdf brochure
Market Size Estimation
Both the top-down and bottom-up approaches were used to estimate and validate the global size of the intumescent coatings market. These approaches were also used extensively to estimate the size of various dependent segments of the market. The research methodology used to estimate the market size included the following:

Data Triangulation
After arriving at the overall market size using the market size estimation processes explained above, the market was split into several segments and subsegments. The data triangulation and market breakup procedures were employed, wherever applicable, to complete the overall market engineering process and arrive at the exact statistics of each market segment and subsegment. The data was triangulated by studying various factors and trends from both the demand and supply sides.
Market Definition
Intumescent coatings represent a class of modern fire protection materials that expand upon heat exposure, producing an insulating char cell that retards heat transmission and structural failure. The coatings feature excellent thermal stability, adhesion, and versatility, which find their way across construction, oil & gas, aerospace, and industrial applications. The foremost types of intumescent coatings comprise water-based formulations, commonly accepted for their low VOC content and environmental concern; solvent-based, offering high adhesion and durable performance in hostile environments; and epoxy systems for eminent chemical and moisture resistance, especially within marine and offshore fields. Their unique fire-retardant ability, compounded with corrosion resistance, weatherability, and ease of application, creates reliance on them in the protection of steel structures, pipelines, and crucial infrastructure. Intumescent coatings also help safety regulations by increasing evacuation times during fire situations that preserve human lives and also protect assets in higher-risk surroundings. On a worldwide basis, the demand for Intumescent Coatings is significantly on the upswing owing to fast-paced urbanization, raising fire safety concerns, and growing demand from all over the industries. The Asia Pacific region emerges as the fastest-growing region in the intumescent coatings market, followed by the Middle East & Africa, North America, and South America, because of growing end-use industries and innovation in intumescent coatings chemistry. With sustainability initiatives and several product developments, the intumescent coatings market is expected to keep growing.
Stakeholders
- Intumescent coating manufacturers
- Raw material suppliers
- Service providers
- Distributors and retailers
- Research & development entities
- Industry associations and regulatory bodies
- End users
Report Objectives
- To estimate and forecast the intumescent coatings market, in terms of value and volume
- To provide detailed information about the major factors (drivers, restraints, opportunities, and challenges) influencing the market growth
- To define, describe, and forecast the market type, application technique, substrate, end-use industry, and region
- To forecast the market size along with segments and submarkets, in key regions: North America, Europe, Asia Pacific (APAC), Middle East & Africa (MEA), and South America, along with their key countries
- To strategically analyze micro markets for individual growth trends, prospects, and their contribution to the total market
- To analyze growth opportunities in the market for stakeholders and provide details on the competitive landscape for market leaders
- To strategically profile key players and comprehensively analyze their market shares and core competencies
- To analyze competitive developments, such as acquisitions, agreements, and expansions in the intumescent coatings market
Key Questions Addressed by the Report
What are intumescent coatings?
Intumescent coatings are fire-retardant paints that expand when exposed to heat, forming a thick, insulating char layer to protect underlying substrates like steel from fire damage.
How do intumescent coatings work?
They swell rapidly under high temperatures (above 200°C), creating a foam-like barrier that delays heat transfer and structural failure for 30–120 minutes.
Which industries use them most of intumescent coatings?
Building & construction leads demand, followed by oil & gas, industrial facilities, and power generation for passive fire protection on steel structures.
Why is the intumescent coatings market growing?
Stricter fire safety regulations, urbanization, and infrastructure projects drive growth, with the market projected at 5–10% CAGR to reach USD 1.4–2.8B by 2030–2032.
Which type dominates the intumescent coatings market?
Thin-film intumescent coatings hold the largest share due to their lightweight application on steel in buildings, offering effective fire resistance without bulk.
Need a Tailored Report?
Customize this report to your needs
Get 10% FREE Customization
Customize This ReportPersonalize This Research
- Triangulate with your Own Data
- Get Data as per your Format and Definition
- Gain a Deeper Dive on a Specific Application, Geography, Customer or Competitor
- Any level of Personalization
Let Us Help You
- What are the Known and Unknown Adjacencies Impacting the Intumescent Coatings Market
- What will your New Revenue Sources be?
- Who will be your Top Customer; what will make them switch?
- Defend your Market Share or Win Competitors
- Get a Scorecard for Target Partners

Custom Market Research Services
We Will Customise The Research For You, In Case The Report Listed Above Does Not Meet With Your Requirements
Get 10% Free CustomisationTESTIMONIALS

We at Nissan Chemicals Corporation have been clients of MarketsandMarkets for more than a year now. We recently consulted MarketsandMarkets for a study, the team at MarketsandMarkets was extremely professional and organized. The business insights were very detailed and aligned well with our expectations that really helped us formulate the Business Plans and device new strategies for development themes. MarketsandMarkets offers a unique combination of expertise and dedicated engagement model. Their research findings have helped us in designing our Pricing Strategy which will make it easier for us to predict the future sales and profits for the next ten years. We look forward to working with MarketsandMarkets in the future.
VP of Strategy & New Business Development
Leading Specialty Chemical Company
The MarketsandMarkets Engagement Model, composed of both the Knowledge Store and advisory custom research, has greatly helped us in understanding our markets and making strategic decisions. The Knowledge Store is a fast way to allow everyone in our organization to understand more about most any market they are interested in. The ability to then get custom research done and get answers to specific strategic questions and market insight has been spectacular. The Markets and Markets team feel more like colleagues than vendors and their services have helped us change our culture where statements of things like growth opportunities and competitive position are always backed by industry research.

Rich Gibson,
Director, Corporate Strategy
Milliken & Company,
Leading Industrial Manufacturer of specialty chemical, floor covering, performance and protective textile materials, and healthcaremilliken.com
MarketsandMarkets is a trusted resource that helps us to better understand markets that are near-adjacencies-whether its technology, value chain or geography. Their Knowledge Store platform provides a dashboard of markets and their characteristics which is easy to use and saves us time.
Adam Shaw,
Market Development and Strategy Manager
AdvanSix Inc. USA,
An American Leader in Chemicalswww.advansix.com
The Knowledge Store from MarketsandMarkets is a valuable tool which has helped my team acquire greater insight in to the end markets that our business serves. This has enabled us to help our company build stronger strategies throughout our planning process.
TOSHIO KINOSHITA
Senior Chif Consultion Research & Consulting Division
Mitsubishi Chemical Research Corporation,
Leading Manufacturer of Chemical Productswww.mitsubishichem-res.co.jp/en/

We recently engaged with MarketsandMarkets for a study, the team not only clearly understood our business objectives but was also extremely professional in the way they handled the entire project. The study was efficiently conducted in a phase-wise manner, and the engagement model furnished us with high-quality business insights that far exceeded our expectations at each phase. We were especially happy that MarketsandMarkets could provide us with both, an English as well as a Japanese version of the study. A special thanks to the Analyst Team and Client Services Team, whose fluency in Japanese enhanced our comfort level, as we could converse with them in our preferred language.
Independent entrepreneurs
Arrow Precision
We approached MarketsandMarkets for study on Proppants Market, and their work exceeded our expectations. The study conducted was comprehensive and enabled us to view the market through the various dimensions. In addition, the team was extraordinarily responsive throughout the process and resolved our queries on time. I strongly recommend MarketsandMarkets and will certainly consider them for additional market assessments we will need in the future.
Global engineering company, Japan
Deputy Manager,
Strategic Planning OfficeThe high-quality insights shared by the MarketsandMarkets team helped us understand the pharmaceutical plant designers in a specific geography. It also captured the risks that we may likely face in communicating with our potential partners. The study would enable us identify partners, which would impact our future growth.


Growth opportunities and latent adjacency in Intumescent Coatings Market