
IoT Medical Devices Market: Growth, Size, Share, and Trends

IoT Medical Devices Market by Product (Wearable (Vital Sign (BP, Glucose, ECG, Oximeter), Resp., Fetal), Implant (Neuro, Cardiac-Defib, Pacemaker) Pumps), Connectivity (Bluetooth, WiFi), End User (Hospital, Nursing Home) & Region - Global Forecast to 2030


OVERVIEW
Source: Secondary Research, Interviews with Experts, MarketsandMarkets Analysis
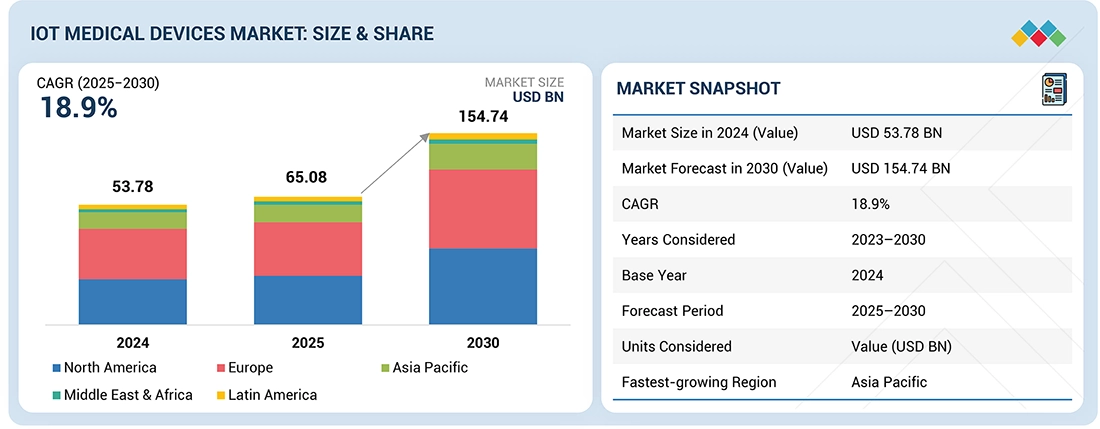
The IoT Medical Devices Market is projected to reach USD 154.74 billion by 2030 from USD 65.08 billion in 2025, at a CAGR of 18.9% from 2025 to 2030. The growth of the IoT medical device market is driven by the increasing adoption of connected healthcare solutions, rising demand for remote patient monitoring, and growing integration of advanced sensors and AI technologies in medical devices.
KEY TAKEAWAYS
- The North America IoT medical devices Market accounted for a 42.8 % revenue share in 2024.
- By product, the patient monitors segment is expected to register the highest CAGR of 22.6%.
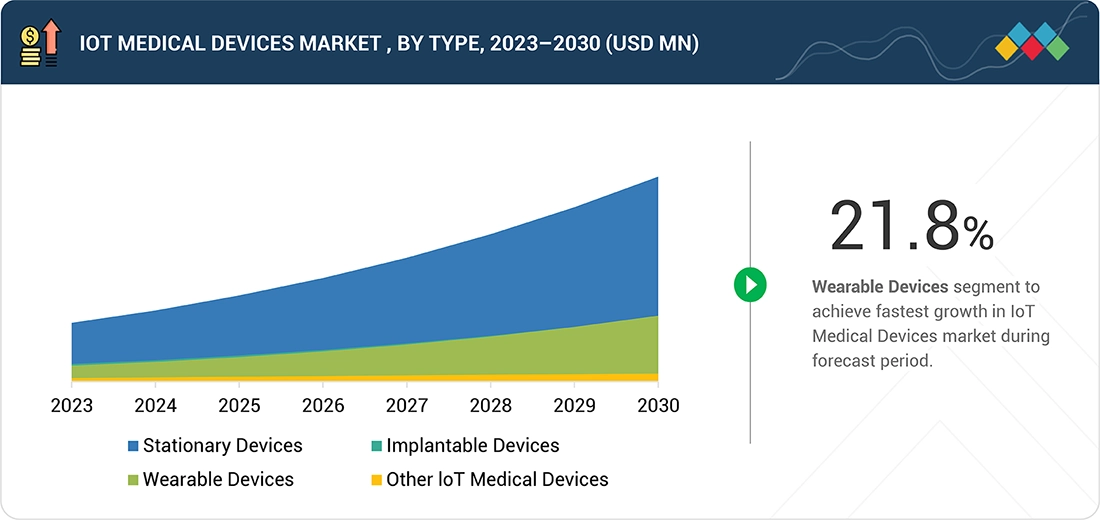
- By type, the wearable devices segment is projected to grow at the fastest rate from 2025 to 2030.
- By Connectivity technology, the bluetooth segment is expected to register the highest CAGR
- By end user, the hospitals and clinics segment is expected to dominate the market with 66.6% market share.
- Major market players have adopted both organic and inorganic strategies, including partnerships and investments. For instance, Medtronic (Ireland), GE HealthCare. (US), and Koninklijke Philips N.V. (US) have entered into a number of agreements and partnerships to cater to the growing demand for IoT Medical Devices across innovative applications.
The IoT medical device market is growing rapidly, driven by the rising need for real-time patient monitoring, increasing chronic diseases, and the shift toward connected healthcare. Advances in sensors, wireless connectivity, AI, and cloud integration are enabling personalized, data-driven care and remote diagnostics. Emerging markets such as India, China, Brazil, and Southeast Asia are also fueling growth through rapid healthcare digitalization and infrastructure investments.
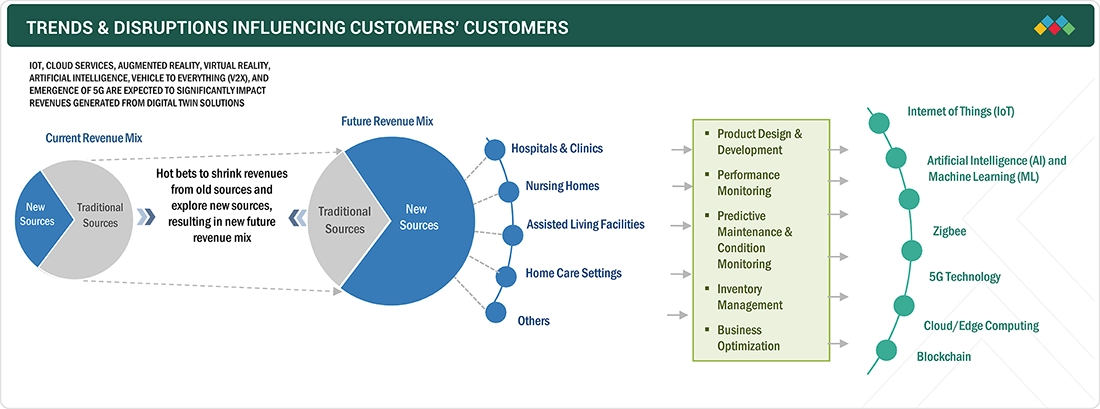
TRENDS & DISRUPTIONS IMPACTING CUSTOMERS' CUSTOMERS
The impact on consumers' business emerges from customer trends or disruptions. Hotbets are clients of IoT medical device solution providers, and target applications are clients of IoT medical device solution providers. Shifts, which are changing trends or disruptions, will impact the revenues of end users. The revenue impact on end users will affect the revenue of hotbets, which will further affect the revenues of IoT medical device solution providers.
Source: Secondary Research, Interviews with Experts, MarketsandMarkets Analysis
MARKET DYNAMICS
Level
-
Government initiatives to promote digital health

-
Growing need for cost-containment in healthcare delivery

Level
-
High deployment costs of connected medical devices

-
Lack of skilled IT personnel across healthcare organizations

Level
-
Low doctor-to-patient ratio in several countries

Level
-
Data security issues

-
Data management and interoperability concerns

Source: Secondary Research, Interviews with Experts, MarketsandMarkets Analysis
Driver: Government initiatives to promote digital health
Government initiatives to promote digital health are playing a significant role in driving the growth of the IoT medical devices market. In North America and other developed regions, policymakers are actively encouraging the adoption of connected healthcare technologies through funding programs, regulatory support, and digital health strategies aimed at improving patient outcomes, enhancing remote care, and reducing healthcare costs. These initiatives facilitate the integration of IoT-enabled devices in hospitals, clinics, and home care settings, thereby accelerating market adoption and innovation.
Restraint: High deployment costs of connected medical devices
A key barrier to the broader adoption of IoT-based medical devices is the significant cost involved in their implementation. Beyond the upfront investment in hardware and connectivity solutions, healthcare providers must also consider the recurring expenses tied to data storage, cybersecurity, software updates, and technical support. Smaller hospitals and clinics, particularly in low-resource settings, often face difficulties in allocating sufficient budgets for such technologies. Furthermore, integrating these devices with existing health IT systems and meeting regulatory and compliance standards can add to the overall financial and operational burden. These factors collectively limit the scalability of IoT solutions, despite their potential to enhance care quality and patient outcomes.
Opportunity: Low doctor-to-patient ratio in several countries
In countries with a limited number of healthcare professionals relative to the patient population, IoT-enabled medical devices offer a valuable solution to ease the strain on healthcare systems. These devices support remote monitoring and virtual care, allowing a single physician to oversee and manage multiple patients more efficiently. By automating the collection and transmission of health data, IoT technologies reduce the need for frequent in-person consultations and enable faster response times to emerging health issues. This is especially beneficial in remote or underserved regions, where access to medical facilities and specialists is often limited. As a result, IoT devices play a crucial role in expanding the reach of healthcare services and improving patient outcomes despite workforce shortages.
Challenge: Data security issues
Data security issues remain a key challenge in the IoT medical device market. As these devices collect, transmit, and store sensitive patient health information, they become vulnerable to cyberattacks, unauthorized access, and data breaches. Ensuring robust encryption, secure network connectivity, and compliance with healthcare data regulations such as HIPAA is critical, yet many healthcare providers and device manufacturers face difficulties in fully implementing these measures. These concerns can slow adoption and limit the deployment of IoT medical devices, particularly in settings handling large volumes of patient data.
IoT Medical Devices Market: COMMERCIAL USE CASES ACROSS INDUSTRIES
| COMPANY | USE CASE DESCRIPTION | BENEFITS |
|---|---|---|
 |
IoT-enabled connected devices for cardiac monitoring, insulin pumps, and remote patient monitoring. | Enhances real-time patient monitoring, improves chronic disease management, and enables predictive analytics for personalized care. |
 |
Connected imaging systems, IoT-enabled diagnostic equipment, and remote patient monitoring platforms. | Improves operational efficiency, enables real-time imaging insights, and supports proactive patient care. |
 |
Smart hospital solutions, wearable devices, and telehealth platforms with IoT connectivity. | Enhances remote monitoring, optimizes clinical workflows, and improves patient engagement and outcomes. |
 |
IoT-enabled glucose monitoring systems, cardiovascular devices, and wearable health trackers. | Provides continuous health monitoring, supports data-driven interventions, and empowers patients with self-management tools. |
 |
Connected implantable devices and remote monitoring systems for cardiac, vascular, and neurological conditions. | Enables real-time patient monitoring, reduces hospital visits, and facilitates timely clinical interventions. |
Logos and trademarks shown above are the property of their respective owners. Their use here is for informational and illustrative purposes only.
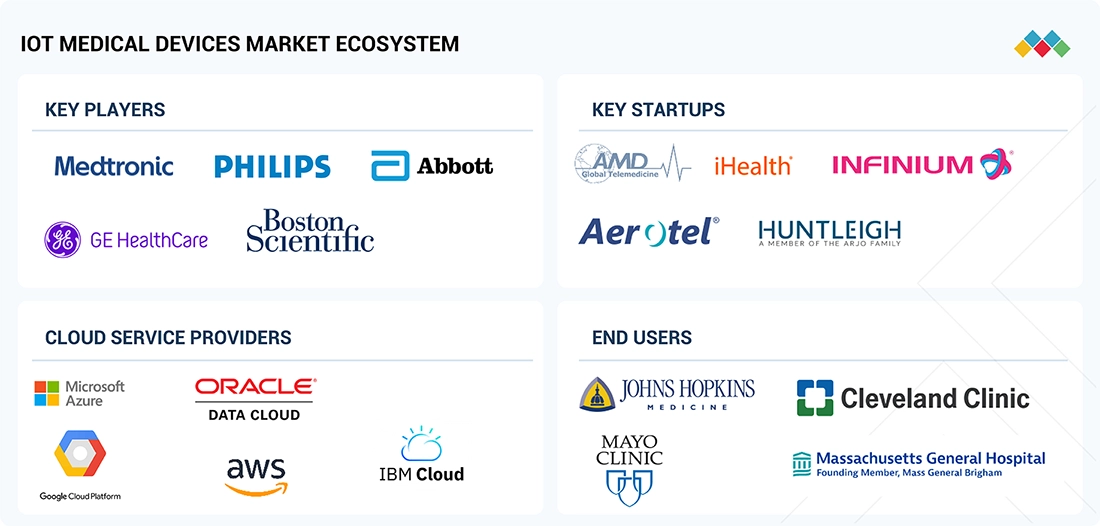
MARKET ECOSYSTEM
The IoT medical devices market is expanding rapidly as healthcare providers adopt connected devices such as wearables, remote monitoring systems, and smart sensors to improve patient care and operational efficiency. Integration with AI, cloud computing, and 5G enables real-time data access, predictive insights, and better care coordination across hospitals, clinics, and home care settings. Regulatory support, cybersecurity measures, and interoperability initiatives further strengthen secure data exchange, fostering a connected ecosystem that drives innovation and enhances patient outcomes.
Logos and trademarks shown above are the property of their respective owners. Their use here is for informational and illustrative purposes only.
MARKET SEGMENTS
Source: Secondary Research, Interviews with Experts, MarketsandMarkets Analysis
IoT Medical Devices Market, By Product Type
In 2024, the vital signs monitoring devices segment held the largest share of the IoT medical devices market, driven by rising demand for continuous patient monitoring across hospitals, clinics, and home care settings. Devices such as wearable heart rate monitors, blood pressure monitors, and oxygen saturation sensors enable real-time tracking and early detection of health issues. Integration with remote monitoring platforms and AI-powered analytics supports proactive care, improved outcomes, and efficient clinical workflows. Strong connectivity, cybersecurity, and interoperability with healthcare IT systems ensure secure, reliable data management, allowing providers to deliver patient-centered, high-quality care.
IoT Medical Devices Market, By Type
In 2024, the stationary medical devices segment accounted for the largest share of the IoT medical devices market, driven by their extensive use in hospitals, clinics, and diagnostic centers for continuous patient monitoring and critical care. Devices such as bedside monitors, fixed imaging systems, and connected infusion pumps enable real-time health data collection, support clinical decision-making, and improve operational efficiency. Integration with AI, remote monitoring platforms, and healthcare IT systems allows predictive insights and better care coordination, while robust connectivity, cybersecurity, and interoperability ensure secure and reliable data management across healthcare settings.
IoT Medical Devices Market, By Connectivity Technology
In 2024, the Wi-Fi segment commanded the largest share of the IoT medical devices market, driven by its widespread adoption for reliable, high-speed connectivity in hospitals, clinics, and home care settings. Wi-Fi-enabled devices facilitate real-time data transmission, seamless integration with remote monitoring platforms, and interoperability with healthcare IT systems. This connectivity supports continuous patient monitoring, timely clinical decision-making, and efficient care coordination, while ensuring secure and reliable management of sensitive health data.
IoT Medical Devices Market, By End User
In 2024, the hospitals & clinics segment accounted for the largest share of the IoT medical devices market, driven by the increasing adoption of connected devices for patient monitoring, diagnostics, and critical care. IoT-enabled solutions such as wearable sensors, vital signs monitors, and smart infusion pumps support real-time data collection, enhance clinical decision-making, and streamline hospital workflows. Integration with remote monitoring platforms, AI analytics, and healthcare IT systems enables predictive insights and efficient care coordination, while robust connectivity and cybersecurity measures ensure secure and reliable management of patient data.
REGION
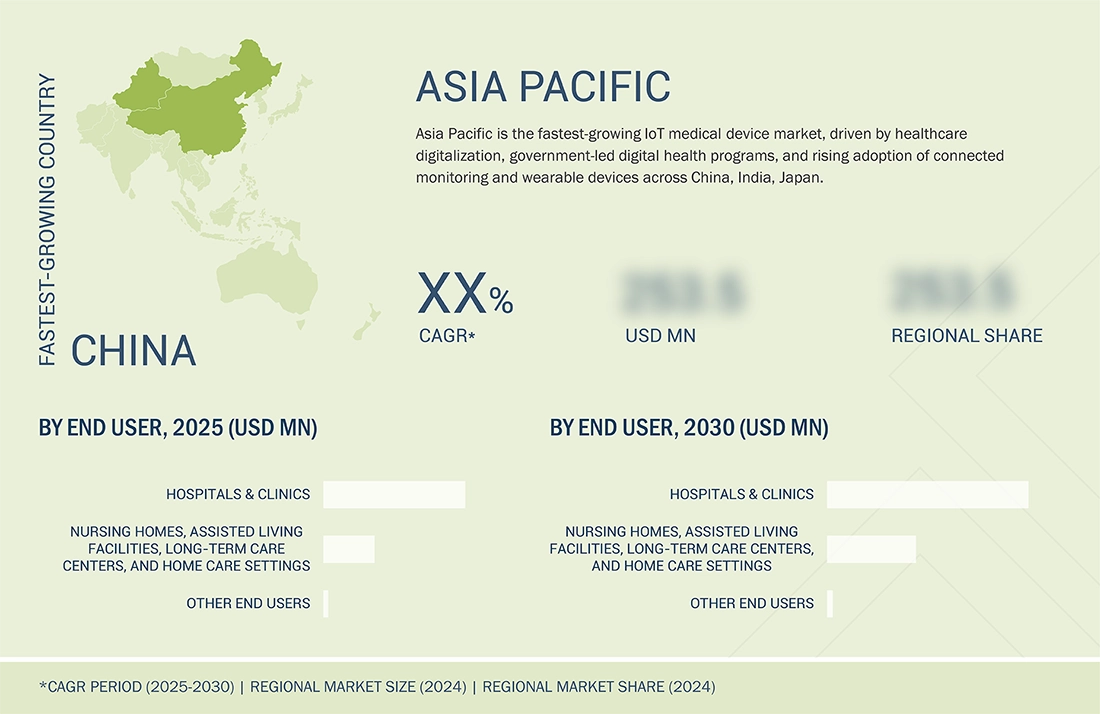
Asia Pacific to be fastest-growing Region in IoT Medical Devices market during forecast period
Based on region, Asia Pacific is expected to register the fastest growth in the IoT medical devices market during the forecast period. This rapid expansion is driven by increasing healthcare infrastructure investments, growing adoption of connected medical devices, rising demand for remote patient monitoring, and supportive government initiatives promoting digital health solutions. Additionally, the region’s large patient population and expanding home care and hospital networks are fueling the adoption of IoT-enabled devices for improved care delivery and operational efficiency.
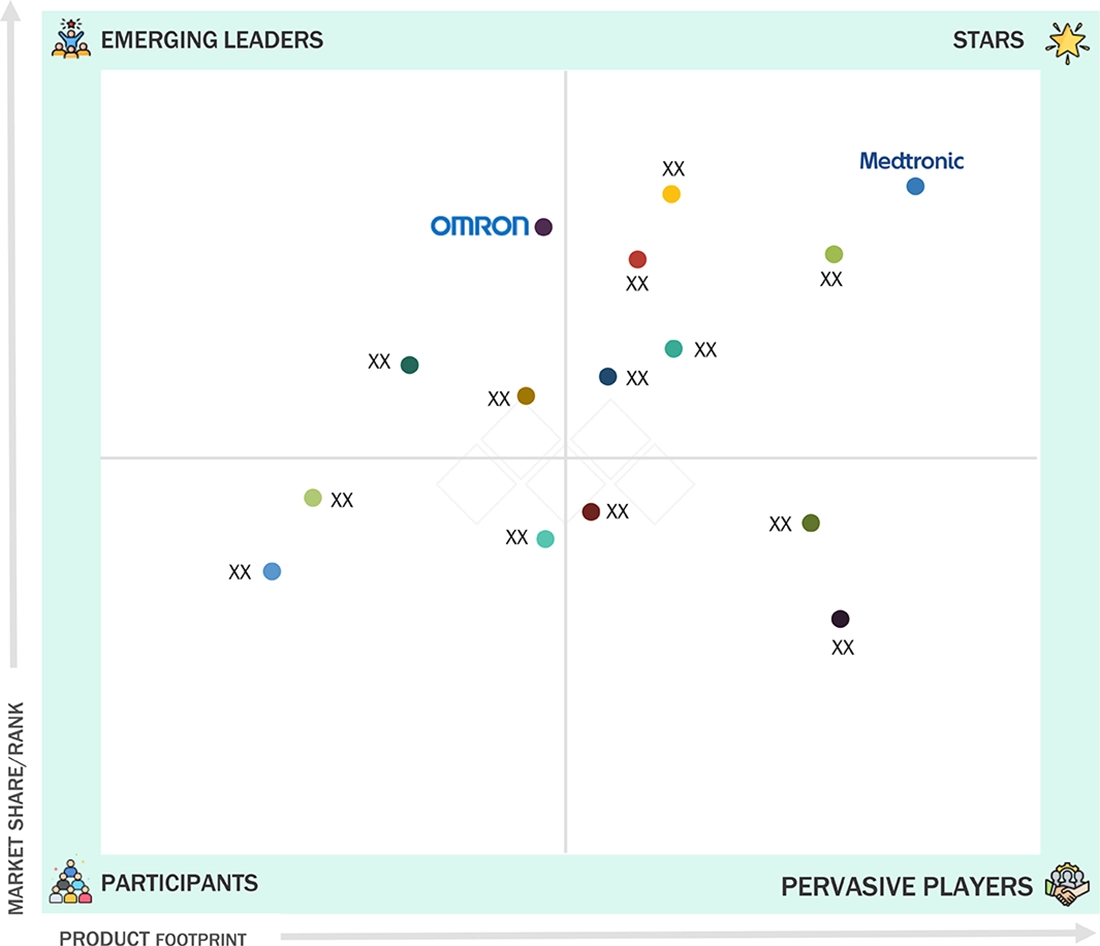
IoT Medical Devices Market: COMPANY EVALUATION MATRIX
In the IoT medical devices market matrix, Medtronic (Star) leads with a strong market presence and a comprehensive portfolio of connected medical devices, driven by its advanced remote monitoring solutions, wearable sensors, and hospital-grade patient monitoring systems widely adopted across healthcare settings. OMRON Corporation (Emerging Leader) is gaining traction with its innovative home-use and wearable monitoring devices, cloud-connected platforms, and patient engagement solutions, strengthening its position through technology-driven offerings for both clinical and consumer segments. While Medtronic dominates through scale, reliability, and diversified product offerings, OMRON Corporation shows significant potential to move toward the leaders’ quadrant as demand for smart, connected, and patient-centric medical devices continues to grow.
Source: Secondary Research, Interviews with Experts, MarketsandMarkets Analysis
KEY MARKET PLAYERS
MARKET SCOPE
| REPORT METRIC | DETAILS |
|---|---|
| Market Size in 2024 (Value) | USD 53.78 Billion |
| Market Forecast in 2030 (Value) | USD 154.74 Billion |
| Growth Rate | CAGR of 18.9% from 2025-2030 |
| Years Considered | 2023-2030 |
| Base Year | 2024 |
| Forecast Period | 2025-2030 |
| Units Considered | Value (USD Billion) |
| Report Coverage | Revenue forecast, company ranking, competitive landscape, growth factors, and trends |
| Segments Covered |
|
| Region Covered | North America, Europe, Aisa Pacific, Latin America and Middle East & Africa |
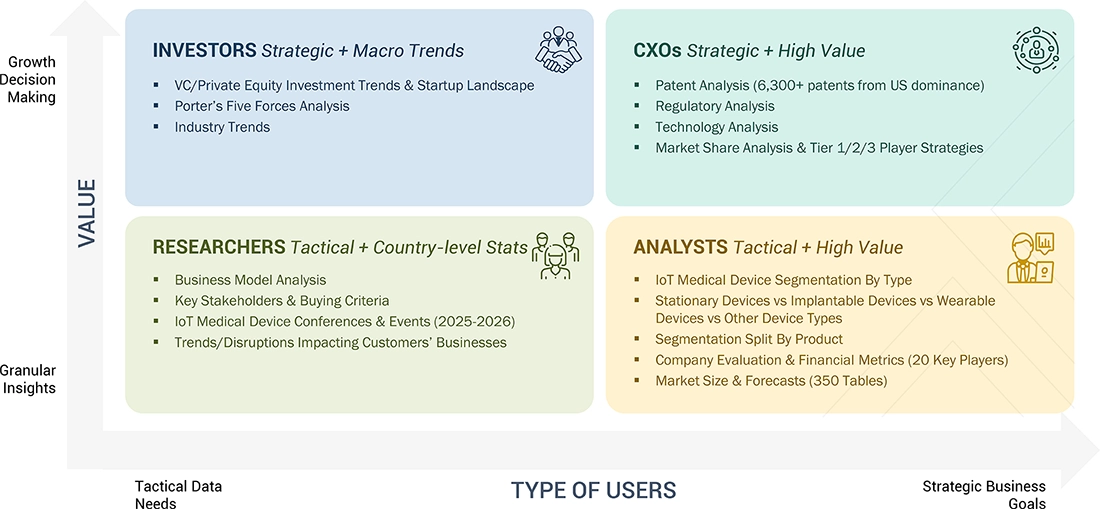
WHAT IS IN IT FOR YOU: IoT Medical Devices Market REPORT CONTENT GUIDE
DELIVERED CUSTOMIZATIONS
We have successfully delivered the following deep-dive customizations:
| CLIENT REQUEST | CUSTOMIZATION DELIVERED | VALUE ADDS |
|---|---|---|
| Leading IoT Medical Devices Players | Competitive profiling of major IoT medical devices vendors, product range segmentation (wearables, in-hospital IoT devices, remote monitoring, connected implants), share and growth trajectory | Benchmarking interoperability, device security, data management across healthcare systems, multi-vendor integration |
| Digital Health/IoT Startups | Top startups in North America, Europe, and Asia; innovations in miniaturized sensors, remote monitoring, AI-assisted diagnostics, chronic disease management | Evaluation of technology adaptability, integration with telehealth/EHRs, scalability of IoT solutions |
| Payers & Insurance Providers | Economic assessment of IoT-enabled care models, cost savings from remote monitoring, reimbursement for continuous monitoring, outcome-based agreements | Forecast adoption of AI-driven data analytics in claims, predictive health risk management using IoT data |
| Hospital Networks & Providers | Analysis of IoT adoption for operational efficiency, real-time asset tracking, patient throughput, reduction in hospital-acquired conditions, smart hospital evolution | Benchmarking deployment success, ROI, integration with legacy IT/biomedical systems, training requirements |
| Medical Device Manufacturers | Benchmarking FDA/CE approval status, R&D investment in IoT features, lifecycle management for devices, evolution to connected platforms | Mapping of IoT-enabled device adoption trends, post-market surveillance, cybersecurity protocols |
RECENT DEVELOPMENTS
- April 2025 : Medtronic and Abbott collaborated to develop an insulin pump compatible with Abbott’s glucose sensors. The integrated system was intended to enhance diabetes management, and FDA approval for the combined solution was formally requested.
- May 2025 : Medtronic has announced its intention to separate its Diabetes business into an independent, publicly traded company. The new entity will be headquartered in California and employ ~8,000 individuals. This strategic decision allows Medtronic to focus more closely on its core businesses in cardiovascular, neuroscience, and surgical technologies.
- February 2025 : Philips and Medtronic signed a Memorandum of Understanding (MoU) to train over 300 clinicians in India on advanced imaging techniques for structural heart diseases, focusing on patients with end-stage renal disease (ESRD). The program combines theoretical sessions with hands-on experience using Philips' ultrasound and MRI systems. The collaboration aimed to enhance the precision of TAVI procedures and improve patient care outcomes.
- January 2025 : GE HealthCare and Sutter Health entered a seven year strategic partnership to enhance access to advanced, AI powered imaging services across California. The collaboration aims to increase diagnostic capacity, improve patient experience, and integrate innovative imaging technologies into Sutter Health's facilities.
- October 2024 : Abbott collaborated with the Association of Physicians of India (API) during Abbott’s Care Congress to enhance medication adherence in the management of non-communicable diseases (NCDs). The partnership focused on uniting healthcare experts to develop initiatives and tools that support patients in maintaining their treatment regimens effectively.
Table of Contents
 Exclusive indicates content/data unique to MarketsandMarkets and not available with any competitors.
Methodology
The study included several key activities aimed at estimating the current size of the IoT medical devices market. Extensive secondary research was conducted to collect information about this market. The next step involved validating the findings, assumptions, and size estimates by consulting industry experts from across the value chain through primary research. A combination of top-down and bottom-up approaches was used to estimate the overall market size. Subsequently, market segmentation and data triangulation techniques were applied to determine the sizes of specific segments and subsegments within the IoT medical devices market.
Secondary Research
This research study extensively utilized secondary sources, including directories and databases such as Dun & Bradstreet, Bloomberg Business, and Factiva. It also incorporated white papers, annual reports, companies' house documents, investor presentations, and SEC filings of various companies. The market for companies offering IoT medical device solutions was assessed using data from both, paid and free sources. This involved analyzing the product portfolios of major industry players and evaluating these companies based on their performance and quality. Various resources were employed during the secondary research process to gather relevant information for this study. These sources included annual reports, press releases, investor presentations, white papers, academic journals, certified publications, articles by recognized authors, as well as directories and databases.
The secondary research process involved consulting a variety of sources to gather information relevant to the study. These sources included annual reports, press releases, investor presentations from IoT medical device vendors, forums, certified publications, and white papers. This research was essential for obtaining critical insights into the industry's value chain, identifying key players in the market, and understanding market classification and segmentation from both, market and technology-oriented perspectives.
Primary Research
In the primary research process, various sources from both, the supply and demand sides were interviewed to gather qualitative and quantitative information for this report. Primary sources mainly include industry experts from core and related industries, as well as preferred suppliers, manufacturers, distributors, technology developers, researchers, and organizations linked to all segments of the industry's value chain.
In-depth interviews were conducted with key industry participants, subject-matter experts (SMEs), C-level executives from leading market players, and industry consultants. This approach helped in gathering and verifying critical qualitative and quantitative information while also assessing future prospects.
The primary research aimed to identify different segmentation types, industry trends, key players, and important market dynamics, such as drivers, restraints, opportunities, challenges, and strategies adopted by major players in the industry.
After completing the market engineering process, which includes calculations for market statistics, market breakdown, size estimations, forecasting, and data triangulation, extensive primary research was conducted. This research aimed to gather information and verify the critical numbers obtained during the market analysis.
In the complete market engineering process, the top-down and bottom-up approaches and several data triangulation methods were extensively used to perform the market estimation and market forecasting for the overall market segments and subsegments listed in this report. Extensive qualitative and quantitative analysis was performed on the complete market engineering process to list the key information/insights throughout the report.
Breakdown of Primary Respondents

Note 1: Others include sales, marketing, and product managers.
Note 2: Tiers are defined based on a company's total revenue. As of 2023: Tier 1 = >USD 1 billion, Tier 2 = USD 500 million to USD 1 billion, and Tier 3 = < USD 500 million.
To know about the assumptions considered for the study, download the pdf brochure
Market Size Estimation
The market size estimates and forecasts provided in this study are derived through a mix of the bottom-up approach (revenue share analysis of leading players) and the top-down approach (assessment of utilization/adoption/penetration trends by product, type, connectivity technology, end user, and region).

Data Triangulation
After arriving at the overall market size, using the market size estimation processes, the market was split into several segments and subsegments. To complete the overall market engineering process and arrive at the exact statistics of each market segment and subsegment, the data triangulation and market breakdown procedures were employed, wherever applicable. The data was triangulated by studying various factors and trends from both, the demand and supply sides in the IoT medical devices market.
Market Definition
The IoT medical devices market refers to connected healthcare devices that use sensors and internet technology to gather and share patient data in real time. These tools support remote monitoring, individualized treatment, and better health outcomes across hospitals, clinics, and home care settings. Growth is fueled by the rise in chronic conditions, increased use of telemedicine, and innovations in wireless communication, though concerns around data privacy and regulatory standards remain key challenges.
Stakeholders
- Telecom service providers
- Wireless device manufacturers
- Healthcare technology suppliers
- Application developers and app stores
- IoT infrastructure and service providers
- M2M, IoT, and general telecommunications companies
- Internet identity management, privacy, and security companies
- Sensor, presence, location, and detection solution providers
- Data management and predictive analysis companies
- Semiconductor companies
- Embedded systems companies
- Regulators and governmental agencies
- Hospitals and clinics
- Nursing homes and assisted living facilities
- Research institutions
Report Objectives
- To define, describe, and forecast the global IoT medical devices market based on product, type, connectivity technology, end user, and region
- To provide detailed information regarding the factors influencing the growth of the market (drivers, restraints, opportunities, and challenges)
- To strategically analyze micromarkets with respect to individual growth trends, prospects, and contributions to the overall IoT medical devices market
- To analyze market opportunities for stakeholders and provide details of the competitive landscape for market leaders
- To forecast the size of the IoT medical devices market in five main regions (along with their respective key countries): North America, Europe, Asia Pacific, Latin America, and Middle East & Africa
- To profile key players and comprehensively analyze their product portfolios, market positions, and core competencies in the market
- To track and analyze competitive developments such as product & service launches; expansions; partnerships, agreements, and collaborations; and acquisitions in the IoT medical devices market
- To benchmark players within the IoT medical devices market using the Company Evaluation Matrix framework, which analyzes market players on various parameters within the broad categories of business strategy, market share, and product offering
Frequently Asked Questions (FAQ)
Which are the top industry players in the Global IoT Medical Devices market?
Leading players include Medtronic (Ireland), GE Healthcare (US), Koninklijke Philips N.V. (Netherlands), Abbott (US), Boston Scientific Corporation (US), OMRON Corporation (Japan), Baxter International Inc. (US), BIOTRONIK (Germany), Johnson & Johnson (US), Siemens Healthineers AG (Germany), Honeywell (US), AliveCor (US), Drägerwerk (Germany), Nonin (US), AMD Global Telemedicine (US), iHealth Labs (US), Aerotel Medical Systems (Israel), i-SENS (Korea), Huntleigh Healthcare (UK), ResMed (US), Masimo (US), Infinium Medical (US), ICU Medical (US), and Hamilton Medical (Switzerland).
Which components have been included in the IoT medical devices market report?
The report includes Devices, Imaging Systems, and Patient Monitors.
Which geographical region dominates the global IoT medical devices market?
North America holds a substantial share, while Asia shows significant growth during the forecast period.
Which end users have been included in the IoT medical devices market report?
End users include Hospitals & Clinics; Nursing homes, Assisted Living Facilities, Long-term Care Centers, and Home Care Settings; and Other End Users.
What is the expected total CAGR for the IoT medical devices market from 2025 to 2030?
The market is expected to grow at a CAGR of 18.9% from 2025 to 2030.
Need a Tailored Report?
Customize this report to your needs
Get 10% FREE Customization
Customize This ReportPersonalize This Research
- Triangulate with your Own Data
- Get Data as per your Format and Definition
- Gain a Deeper Dive on a Specific Application, Geography, Customer or Competitor
- Any level of Personalization
Let Us Help You
- What are the Known and Unknown Adjacencies Impacting the IoT Medical Devices Market
- What will your New Revenue Sources be?
- Who will be your Top Customer; what will make them switch?
- Defend your Market Share or Win Competitors
- Get a Scorecard for Target Partners

Custom Market Research Services
We Will Customise The Research For You, In Case The Report Listed Above Does Not Meet With Your Requirements
Get 10% Free CustomisationTESTIMONIALS

JAYANT RAJPUROHIT
Director of Market Insights, Data and Analytics
SFI Health,
Leading Pharmaceutical Companywww.sfihealth.com/

We at SFI Health approached MarketsandMarkets for an Opportunity Assessment on "Incidence and Prevalence of Focus Indications" as we wanted to know the most attractive HCPs like Physician, Functional MD, Naturopath and Pharmacist. The project was critical for us to ensure our focus on the right target which would enable sustainable growth and profitability for SFI Health. The business insights provided exceeded our expectations and we were extremely impressed. The team at MarketsandMarkets is highly professional and detail oriented and very well understood our business needs. MarketsandMarkets offers a unique combination of expertise and dedicated engagement model. We identified 2 new products to be launched in coming months, based on the research findings provided by MarketsandMarkets. We are happy with the services and would strongly recommend MarketsandMarkets to my peers in the industry.

BEATRIZ DE LA CALLE
Head of Commercial Analytics
Qualicaps,
Leading Pharmaceutical Companywww.qualicaps.com/

We partnered with MarketsandMarkets for an assessment study on hard empty capsules. The team was extremely professional in understanding our business requirements and we received timely responses to all our queries. The market intelligence and the recommendations has met our business requirements. We were extremely impressed to see the final study results; it really exceeded our expectations. The market intelligence offered by MarketsandMarkets, and clarity on next steps will help us achieve our business objective for the Year 2021. We are happy with the services and would strongly recommend MarketsandMarkets to my peers in the industry.

Bob Williams,
Senior Director Business Development & Innovation
Bracco Diagnostics Inc.,
Italian Multinational in life sciences sector and a World Leader in imaging diagnosticsimaging.bracco.com/us-en
We were pleased with targeted insights that MarketsandMarkets identified from a custom study on the 'Radiation Dose Management Solutions Market'. Your team identified and characterized the market participants as well as underlying trends accurately. This study was useful to Bracco in formulating business strategies for our dose monitoring product lines and we thank MarketsandMarkets for the job well done.
Cody Coonradt,
Market Development and Strategy Manager
3M Health Information Systems,
Leader in Health care Coding, Payment & Analytics Solutions.www.3m.com/3M/en_US/health-information-systems-us
The value for our organization comes from three things: depth of research, specificity of segments and being easy to work with. As important as the first two are, the third can't be underestimated. MarketsandMarkets, maybe more than any other research vendor, wants to know what is top of mind for our team and what big questions we are grappling to answer.
Their customer first approach and high value engagement model, have given us great analysis and excellent value for money


Growth opportunities and latent adjacency in IoT Medical Devices Market