
Large scale Natural Refrigerant Heat Pump Market

Large scale Natural Refrigerant Heat Pump Market by Refrigerant (Ammonia (R717), Carbon Dioxide (R744), Hydrocarbons), by Capacity (20�200 kW, 201�500 kW, 501�1,000 kW, Above 1,000 kW), by End Use (Commercial and Industrial), and by Region - Global Forecast to 2030


OVERVIEW
Source: Secondary Research, Interviews with Experts, MarketsandMarkets Analysis
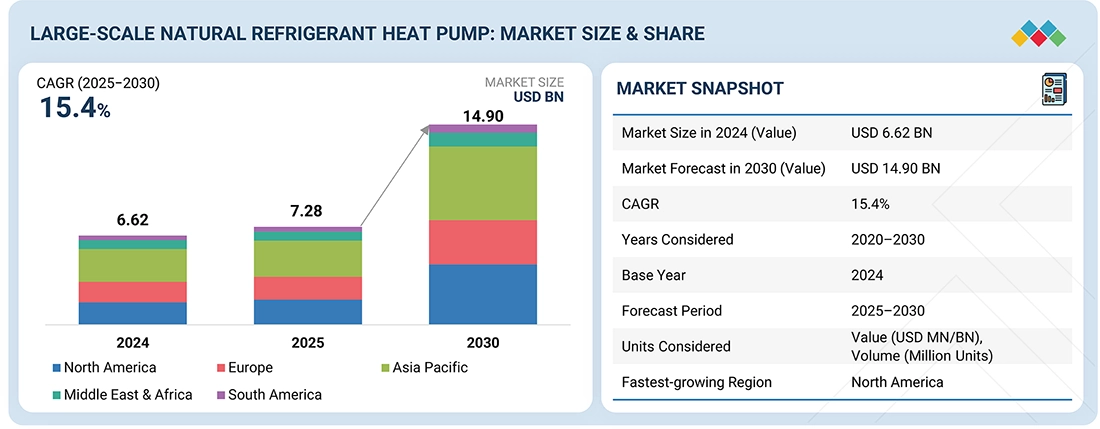
The large-scale natural refrigerant heat pump market is projected to reach USD 14.90 billion by 2030, from USD 7.28 billion in 2025, with a CAGR of 15.4%. These pumps are increasingly adopted as an energy-efficient alternative to traditional electric or gas water heaters for heating and cooling applications.
Large-scale Natural Refrigerant Heat Pump Market Size and Forecast:
- Market Size Value in 2024: USD 6.62 Billion
- Market Size Value in 2025: USD 7.28 Billion
- Revenue Forecast in 2030: USD 14.90 Billion
- Growth Rate: CAGR of 15.4% from 2025 to 2030
- Data available from 2020 to 2030
- The 20–200 kW capacity segment holds the largest market share due to its extensive adoption across commercial buildings and decentralized heating applications.
Key Market Trends and Insights
- Market Growth: Driven by increasing decarbonization initiatives, stringent regulations phasing down high-GWP refrigerants, and rising demand for energy-efficient heating solutions.
- Growing Trends: Adoption of natural refrigerants such as ammonia (R717), carbon dioxide (R744), and hydrocarbons is accelerating as organizations seek sustainable alternatives to conventional heating systems.
- Growth Opportunities: Expansion of district heating networks, industrial process electrification, retrofitting of aging boiler systems, and integration with smart energy management systems are creating significant market opportunities.
- Market Share Analysis: The 20–200 kW capacity segment accounts for the largest market share in 2025 owing to its suitability for commercial and institutional applications, while the commercial end-use segment remains a major revenue contributor due to growing investments in sustainable building infrastructure.
KEY TAKEAWAYS
-
BY TECHNOLOGYExisting commercial and industrial facilities often rely on aging boilers or chillers. Retrofitting to air-to-water or water-to-water large-scale natural refrigerant heat pumps is becoming increasingly popular, especially in district heating and industrial process applications. Ground-source and seawater-source systems are also gaining traction where infrastructure and space allow, as they provide high efficiency and stable operation.
-
BY REFRIGERANTNatural refrigerants like ammonia (R717), carbon dioxide (R744), and hydrocarbons (R290, R600a) are boosting adoption because of regulatory pressure to phase out HFCs and their better thermodynamic properties.
-
BY CAPACITYCapacity requirements differ based on application size. In commercial buildings, such as hospitals, universities, and data centers, units ranging from 50 to 500 kW are commonly used to meet steady heating and cooling demands. Medium-capacity systems, ranging from 500 kW to 2 MW, are increasingly utilized in decentralized district heating projects and industrial facilities, where reliability and efficiency are paramount. For large urban heating networks and heavy industrial clusters, demand exceeds 2 MW, with centralized systems capable of providing multi-megawatt outputs now being installed as essential components of city-wide decarbonization efforts.
-
BY END USELarge-scale natural refrigerant heat pumps are increasingly adopted across various industries as they pursue energy efficiency and decarbonization. Deploying these systems in district heating and cooling networks aims to decrease dependence on fossil fuels. The pulp & paper and chemical industries are key users, utilizing these heat pumps for industrial process heating and sustainable operations.
-
BY APPLICATIONLarge-scale natural refrigerant heat pumps are increasingly used in several non-residential sectors. District heating and cooling networks are the primary area of growth as cities strive to decarbonize their urban heating systems. Industrial process heating is also a key driver, with industries such as food and beverage, pulp and paper, and chemicals adopting these systems to replace fossil-fuel boilers.
-
BY REGIONIn North America, efforts are underway to strengthen domestic supply chains for large-scale natural refrigerant heat pumps, including the manufacture of compressors, heat exchangers, and other key components. These initiatives are driven by trade concerns and the desire for supply chain resilience, with investments focused on scaling production and establishing advanced manufacturing facilities in the US and Canada to support widespread adoption of sustainable heating and cooling solutions.
-
COMPETITIVE LANDSCAPEMajor market players have adopted both organic and inorganic strategies, including partnerships and agreements. For instance, Copeland LP (US), Everllence (Formerly MAN Energy Solutions SE) (Germany, and Mitsubishi Electric Corporation (Japan) have entered into several agreements and partnerships to cater to the growing demand for large-scale natural refrigerant heat pumps.
As utilities and industrial facilities modernize, the potential for integrating large-scale natural refrigerant heat pumps into demand response programs, smart building controls, and time-of-use energy management strategies is increasing. Heat pumps capable of load shifting or modulation provide added value by optimizing energy consumption, reducing peak demand, and enhancing overall operational efficiency while supporting decarbonization goals.
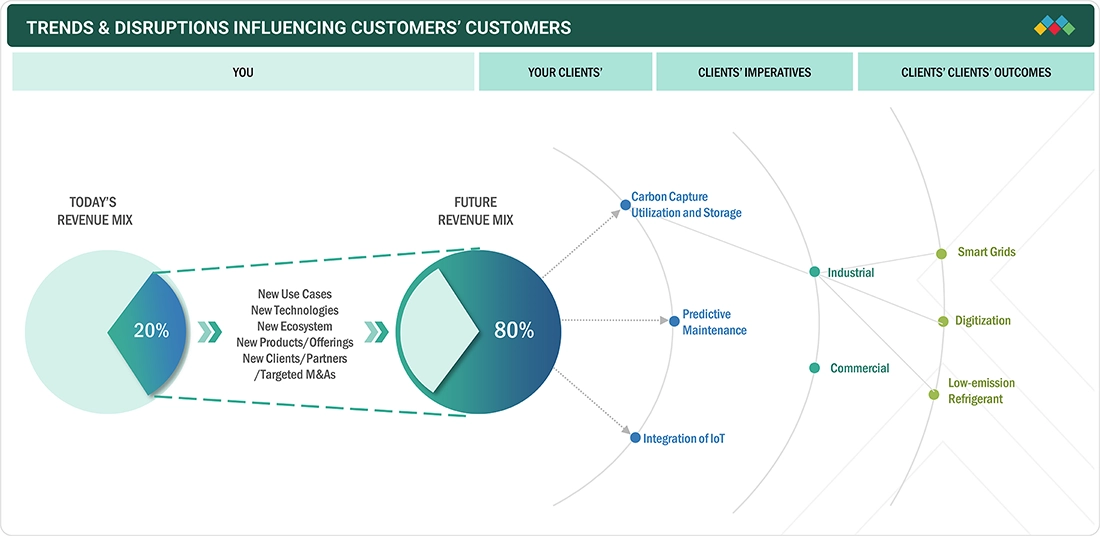
TRENDS & DISRUPTIONS IMPACTING CUSTOMERS' CUSTOMERS
The large-scale natural refrigerant heat pump market is expected to grow at a CAGR of 15.4% during the forecast period. Leading manufacturers, including Panasonic Holdings Corporation, Johnson Controls, Thermax Limited, GEA Group Aktiengesellschaft, and Mitsubishi Electric Corporation, are expanding their product and service offerings across the value chain to boost revenue opportunities. These companies are moving from traditional to digital operations and are increasingly adopting low-emission refrigerants. They are also investing in integrating IoT technologies to make their large-scale natural refrigerant heat pumps smarter and more efficient.
Source: Secondary Research, Interviews with Experts, MarketsandMarkets Analysis
MARKET DYNAMICS
Level
-
Government incentives promoting sustainable transitions

-
Favorable policies and initiatives for energy-efficient heating and cooling systems

Level
-
High upfront cost

-
Space constraints for ground-source systems

Level
-
Industrial decarbonization initiatives

-
Cold climate optimization

Level
-
Availability of low-cost fossil energy-based alternative technologies

-
Energy source dependency

Source: Secondary Research, Interviews with Experts, MarketsandMarkets Analysis
Driver: Government incentives promoting sustainable transitions
Many governments worldwide are implementing policies to accelerate the transition to sustainable heating technologies. These initiatives include funding grants, tax credits, and low-interest loans that lower the upfront costs for clean heating solutions, making them more accessible. Major programs, such as the EU Green Deal, REPowerEU, and the US Inflation Reduction Act, are significantly investing in energy efficiency and natural refrigerant heat pumps. This support is driving the adoption of heat pumps in industrial, commercial, and district heating applications as part of the broader shift toward electrification and low-emission heating systems, contributing to climate resilience and energy efficiency goals.
Restraint: High upfront cost
The high capital investment required for large-scale natural refrigerant heat pump systems presents challenges to their adoption, especially in budget-constrained industries. While traditional fossil-fuel boilers cost between USD 50 and USD 100 per kW, natural refrigerant systems range from USD 200 to over USD 500 per kW. Factors such as system complexity and the need for specialized components increase these costs. Although ammonia-based systems can be economically constrained, they offer better thermodynamic efficiency compared to CO2 technology on a large scale.
Opportunity: Industrial decarbonization initiatives
The push to decarbonize energy-intensive industries presents significant opportunities for large-scale natural refrigerant heat pumps. Sectors such as chemicals, pharmaceuticals, and food processing must reduce their carbon footprint by transitioning to non-fossil-fuel-based systems. These industries often generate low-grade waste heat that can be recovered using high-capacity heat pump technologies, thereby enhancing efficiency and reducing emissions. As governments and companies enforce stricter carbon reduction mandates, the demand for clean, scalable heating solutions in industrial settings will likely increase.
Challenge: Availability of low-cost fossil energy-based alternative technologies
Fossil fuels are expected to continue dominating heat demand in the buildings sector for years, accounting for over 60%, despite a global shift to cleaner energy. The recent rise in oil and natural gas prices has renewed interest in cost-competitive renewable heating technologies, particularly heat pumps. However, conventional systems, such as fossil-fuel boilers, remain appealing due to their lower installation costs and fuel price stability. This creates a barrier to the adoption of renewable technologies, as high upfront costs deter investment. To encourage the transition, policy measures such as investment grants, tax rebates, low-interest loans, and fiscal incentives are needed.
Large scale Natural Refrigerant Heat Pump Market: COMMERCIAL USE CASES ACROSS INDUSTRIES
| COMPANY | USE CASE DESCRIPTION | BENEFITS |
|---|---|---|
 |
The world's largest high-temperature ammonia heat pump system was installed in Drammen, Norway, to supply district heating to the city. | This system extracts heat from near-freezing fjord water and uses ammonia as a refrigerant with zero global warming potential. It provides 85% of the city's hot water needs, significantly reducing carbon emissions and fossil fuel dependence. |
 |
A 200 kW thermal CO2 heat pump was installed at the Leisure Centre 'Oak' in the northwest of England to replace gas-fired boilers and provide heating and hot water. | The system reduces carbon emissions by replacing fossil fuel heating with a low-GWP refrigerant. It enhances energy efficiency and supports the centre's sustainability goals. Additionally, it provides reliable and consistent heating and hot water for building occupants throughout the year, lowers operational energy costs, and demonstrates a scalable model for natural refrigerant adoption in other commercial facilities. |
Logos and trademarks shown above are the property of their respective owners. Their use here is for informational and illustrative purposes only.
MARKET ECOSYSTEM
The large-scale natural refrigerant heat pump market ecosystem analysis reveals the interconnections/adjacencies that impact the market, providing MnM coverage of the market under study. The ecosystem involves key players operating across different levels. Major Large-scale natural refrigerant heat pump manufacturers are Panasonic Holdings Corporation (US), Johnson Controls (US), Thermax Limited (India), GEA Group Aktiengesellschaft (Germany), and Mitsubishi Electric Corporation (Japan).

Logos and trademarks shown above are the property of their respective owners. Their use here is for informational and illustrative purposes only.
MARKET SEGMENTS
Source: Secondary Research, Interviews with Experts, MarketsandMarkets Analysis
Large-scale Natural Refrigerant Heat Pump Market, By Technology
The adoption of water-source natural refrigerant heat pumps in large-scale applications is driven by increasing demand for higher energy efficiency, as well as the growing utilization of waste heat. Water-source heat pumps enhance thermal performance and energy efficiency by utilizing stable source water temperatures from sources such as solid waste water, rivers, lakes, and industrial effluent. Water-source heat pumps utilizing carbon dioxide, ammonia, or hydrocarbons help reuse energy in district heating, industrial processes, or renewable thermal networks, resulting in lower GHG emissions and operational costs. As cities and industries with traditionally high carbon footprints transition to smaller carbon options, they enable future combined aquathermal energy, as well as waste heat recovery.
Large-scale Natural Refrigerant Heat Pump Market, By Application
Growing awareness of sustainable operating methods and energy efficiency is prompting increased consideration of natural refrigerant heat pumps in whole-tear-out applications in the commercial segment. The hospitality, healthcare, education, and office building industries are transitioning toward CO2 and hydrocarbon-based systems to comply with increasingly stringent emissions laws and decarbonization targets. These heat pumps offer integrated heating and cooling, eliminating the use of high global warming potential (GWP) refrigerants in both direct and indirect heat pump systems. With high energy costs and a demand to improve indoor environmental quality, commercial facilities are further implementing natural refrigerant heat pumps to lower operational costs, enhance occupant comfort, and meet their economic ESG targets.
Large-scale Natural Refrigerant Heat Pump Market, By Refrigerant
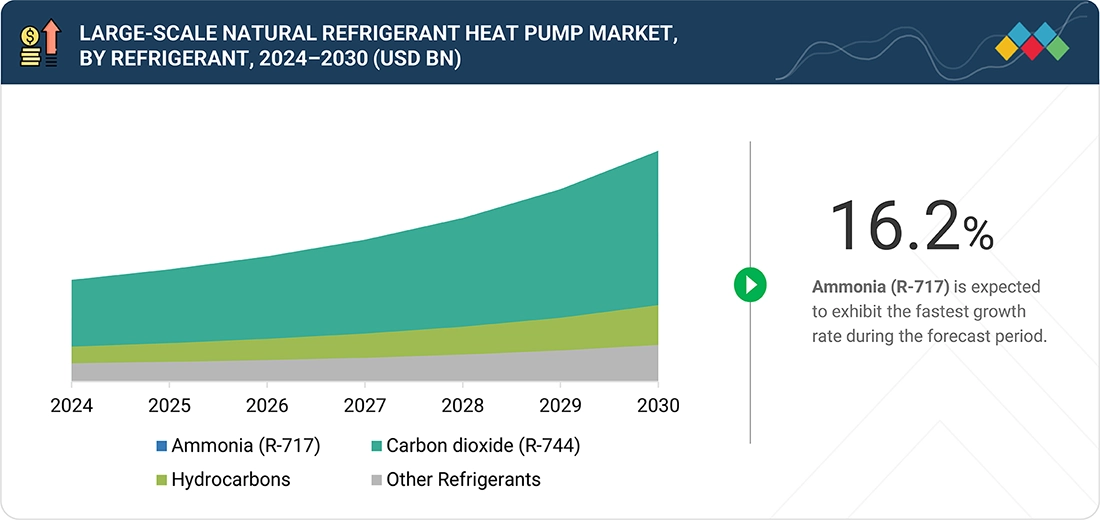
Ammonia in natural refrigerant heat pumps is the fastest-growing segment, particularly in industrial applications requiring high-temperature heating and robust performance. Ammonia systems offer superior energy efficiency, reliability, and low environmental impact, and their adoption is supported by climate policies and regulatory incentives in regions such as Europe, Canada, and East Asia, facilitating large-scale deployment across industrial facilities.
Large-scale Natural Refrigerant Heat Pump Market, By capacity
Large-scale natural refrigerant heat pumps with capacities ranging from 20 to 200 kW are increasingly being adopted in commercial buildings, decentralized energy systems, and industrial applications. These compact systems offer high energy efficiency, flexible installation, and precise temperature control while supporting low-carbon operations. Their comparatively smaller capacity makes them ideal for manufacturing units where space constraints and modular deployment are crucial, and they benefit from regulatory incentives that promote energy-efficient and low-GWP heating and cooling solutions.
REGION
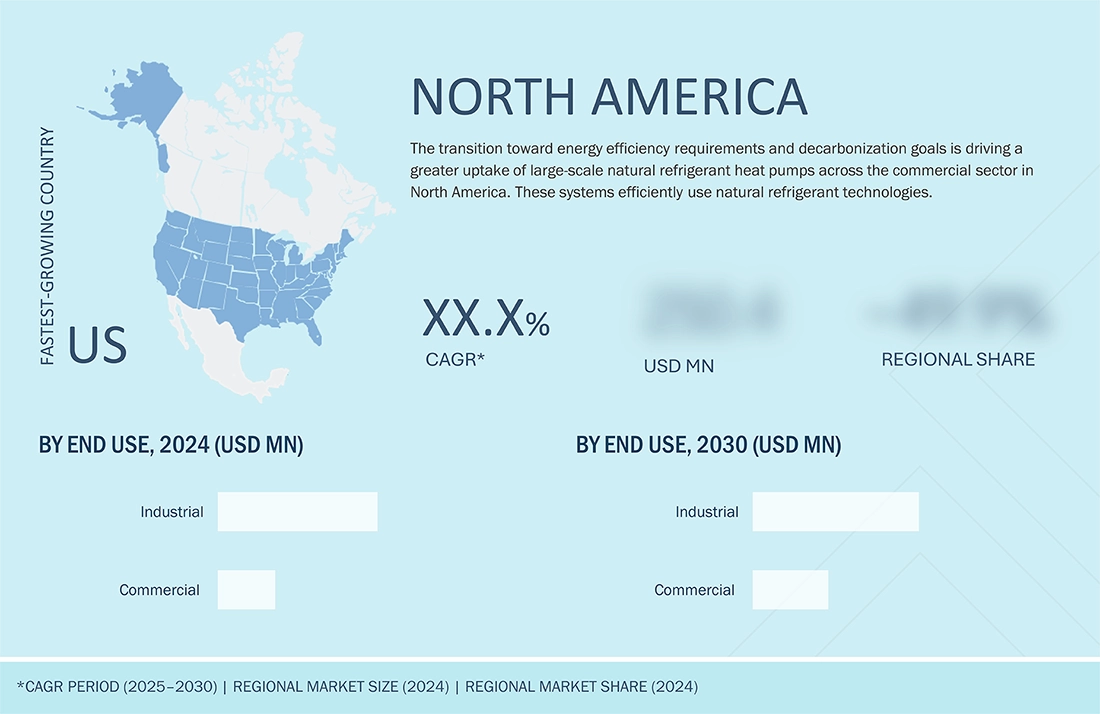
North America to be the largest market of Large-scale natural refrigerant heat pump market
Rising energy efficiency requirements and decarbonization goals are driving a greater uptake of large-scale natural refrigerant heat pumps across the commercial sector in North America. For instance, an increasing number of facilities, particularly hospitals, university campuses, and large office buildings, are implementing carbon dioxide and hydrocarbon-based systems due to regional F-gas phase-down mandates or to meet LEED certification equivalencies. These systems integrate both heating and cooling, eliminating the use of high-GWP refrigerants and thereby contributing to federal and state climate goals. The supply side is gaining momentum via utility recovery, and the demand side is being stimulated by new building performance standards at the municipal level. The commercial sector's investment in natural refrigerant technologies will help reduce emissions, lower operating costs, improve building performance, and enhance sustainability in both the US and Canada.
Large scale Natural Refrigerant Heat Pump Market: COMPANY EVALUATION MATRIX
In the company evaluation matrix for the large-scale natural refrigerant heat pump market, Panasonic Holdings Corporation leads with a strong market presence and a comprehensive product portfolio, driving adoption across various industries, including grid management and renewable energy.

Source: Secondary Research, Interviews with Experts, MarketsandMarkets Analysis
KEY MARKET PLAYERS
MARKET SCOPE
| REPORT METRIC | DETAILS |
|---|---|
| Market Size in 2024 (Value) | USD 6.62 BN |
| Market Forecast in 2030 (Value) | USD 14.90 BN |
| Growth Rate | CAGR of 15.4% (2025–2030) |
| Years Considered | 2020–2030 |
| Base Year | 2024 |
| Forecast Period | 2025–2030 |
| Units Considered | Value (USD MN/BN), Volume (Million Units) |
| Report Coverage | Revenue Forecast, Company Ranking, Competitive Landscape, Growth Factors, and Trends |
| Segments Covered | By Technology, By Refrigerant, By Capacity, By End Use, and By Application |
| Regions Covered | Europe, Asia Pacific, North America, Middle East & Africa, South America |
WHAT IS IN IT FOR YOU: Large scale Natural Refrigerant Heat Pump Market REPORT CONTENT GUIDE
DELIVERED CUSTOMIZATIONS
We have successfully delivered the following deep-dive customizations:
| CLIENT REQUEST | CUSTOMIZATION DELIVERED | VALUE ADDS |
|---|---|---|
| Large-scale Natural Refrigerant Heat Pump Market by Technology Customization | Market estimation for technology segment for large-scale natural refrigerant heat pump market | Volume data based on technology type |
RECENT DEVELOPMENTS
- June 2025 : GEA Group Aktiengesellschaft entered a partnership with Energy Group Utilitas and installed four ammonia heat pumps at the Väg energy complex in Tallinn, Estonia. The ammonia heat pump systems recover lower-temperature waste heat from a biomass CHP plant and raise it to 95°C for district heating, providing energy for approximately 8,000 homes and businesses. This project will support the city's carbon neutrality goals while improving energy efficiency by reducing fossil fuel consumption and its related emissions.
- December 2024 : Mitsubishi Electric Corporation announced a USD 143.5 million investment to upgrade its Maysville, Kentucky, facility for manufacturing variable-speed compressors for high-efficiency heat pumps. This project is supported by a USD 50 million US DOE grant. Production of one million units annually is scheduled to begin in October 2027 for use in high-efficiency HVAC systems across the US, aiming to meet the increasing domestic demand for energy-efficient buildings.
- March 2024 : Johnson Controls has completed the expansion of its heat pump and chiller facility in Nantes, France, effectively doubling the available production space. The new facility is capable of hosting the company's current work, and the expansion has created two new buildings, as well as preparation tools for assembly, making it the company's full production operation in Europe for York-branded "extra-large" heat pumps and chillers. The facility has been fully operational since the completion of the expansion and renovation, and has received a comprehensive outfitting of site logistics, as well as enhanced production efficiency, with potential for future expansion.
- March 2024 : Panasonic Holdings Corporation has announced the introduction of three commercial air-to-water (A2W) heat pumps for sale in Europe, designed for use in multi-dwelling units and light commercial properties. These models offer heating capacities of 20, 25, and 30 kW and utilize natural refrigerants with ultra-low GWP, marking a departure from the solely residential heating market that Panasonic has previously dominated. The heat pumps will be manufactured in the Czech Republic and France, and these units represent Panasonic's pursuit of decarbonized HVAC market solutions.
- October 2023 : Siemens Energy got a contract from MVV GmbH to provide and integrate a 20 MWth river-source heat pump to its district heating system in Mannheim. This system utilizes water from the Rhine River and renewable electricity to generate heat, which can be supplied at temperatures of up to 99°C, serving approximately 3,500 households annually. This project is expected to deliver ~10,000 tons of carbon dioxide reduction annually.
Table of Contents
 Exclusive indicates content/data unique to MarketsandMarkets and not available with any competitors.
Methodology
The study involved major activities in estimating the current size of the large scale natural refrigerant heat pump market. Exhaustive secondary research was done to collect information on the peer and parent markets. The next step was to validate these findings, assumptions, and sizing with industry experts across the value chain through primary research. Both top-down and bottom-up approaches were employed to estimate the complete market size. Thereafter, market breakdown and data triangulation were used to estimate the market size of the segments and subsegments.
Secondary Research
This research study on the large scale natural refrigerant heat pumps market involved the use of extensive secondary sources, directories, and databases, such as Hoovers, Bloomberg, Businessweek, Factiva, International Energy Agency, and BP Statistical Review of World Energy, to identify and collect information useful for a technical, market-oriented, and commercial study of the global large scale natural refrigerant heat pumps market. The other secondary sources included annual reports, press releases, and investor presentations of companies, white papers, certified publications, articles by recognized authors, manufacturer associations, trade directories, and databases.
Primary Research
The large scale natural refrigerant heat pumps market comprises stakeholders such as heat pump manufacturers, technology providers, and support providers in the supply chain. The demand side of this market is characterized by the rising demand for enhanced automation, real-time monitoring, and improved operational efficiency across process industries including power, chemicals, and oil & gas. The supply side is characterized by rising demand for integrated systems supporting sustainability goals, energy efficiency, advanced control infrastructure, and mergers and acquisitions among big players. Various primary sources from both the supply and demand sides of the market were interviewed to obtain qualitative and quantitative information. The following is the breakdown of primary respondents:

The tiers of the companies are defined based on their total revenue as of 2024: Tier 1: >USD 1 billion, Tier 2: USD 500 million–1 billion, and Tier 3: < USD 500 million.
To know about the assumptions considered for the study, download the pdf brochure
Market Size Estimation
Both the top-down and bottom-up approaches were used to estimate and validate the size large scale natural refrigerant heat pumps market. These methods were also used extensively to estimate size of various subsegments in the market. The research methodology used to estimate the market size includes the following.
Large scale Natural Refrigerant Heat Pump Market : Top-Down and Bottom-Up Approach

Data Triangulation
The total market was split into several segments and subsegments after arriving at the overall market size from the above estimation process. Data triangulation and market breakdown processes were employed to complete the overall market engineering process and arrive at the exact statistics for all the segments and subsegments, wherever applicable. The data was triangulated by studying various factors and trends from the demand and supply sides. In addition, the market size was validated using both the top-down and bottom-up approaches.
Market Definition
A large scale natural refrigerant heat pumps is a high-capacity thermal energy system that uses natural substances (such as ammonia, CO2, hydrocarbons, or water) as the working refrigerant to transfer and upgrade heat for industrial, commercial, or district-level applications. Known for their energy efficiency, large scale natural refrigerant heat pumps offer a sustainable alternative to conventional heating and cooling methods like furnaces, boilers, and air conditioners in all climate conditions. In large-scale settings, they can recover and upgrade industrial waste heat using renewable energy, making them a key solution for decarbonizing thermal operations.
Stakeholders
- Maintenance and service providers
- Large scale natural refrigerant heat pump component manufacturers
- Government and research organizations
- Institutional investors
- National and local government organizations
- Large scale natural refrigerant heat pump manufacturing companies
- Technology standard organizations, forums, alliances, and associations
Report Objectives
- To define, describe, segment, and forecast the large scale natural refrigerant heat pumps market, by refrigerant, capacity, technology and end use in terms of valuess
- To forecast the market sizes for five major regions, namely North America, Europe, Asia Pacific, South America, and the Middle East & Africa, along with their key countries, in terms of value
- To provide detailed information regarding key drivers, restraints, opportunities, and challenges influencing the growth of the large scale natural refrigerant heat pump market
- To give the supply chain analysis, trends/disruptions impacting customer business, ecosystem analysis, regulatory landscape, patent analysis, case study analysis, technology analysis, key conferences & events, the impact of AI/Gen AI, macroeconomic outlook, pricing analysis, porter’s five forces analysis, and regulatory analysis, the impact of 2025 US tariff on the market
- To analyze opportunities for stakeholders in the large scale natural refrigerant heat pumps market and draw a competitive landscape of the market
- To benchmark market players using the company evaluation matrix, which analyzes market players on broad categories of business and product strategies adopted by them
- To compare key market players for the market share, product specifications, and applications
- To strategically profile key players and comprehensively analyze their market ranking and core competencies.
- To analyze competitive developments, such as contracts, agreements, partnerships, and expansions in the large scale natural refrigerant heat pump market.
Available Customizations
MarketsandMarkets offers customizations according to the specific needs of the companies with the given market data.
The following customization options are available for the report:
Product Analysis
- Product matrix, which gives a detailed comparison of the product portfolio of each company
Geographic Analysis as per Feasibility
- Further breakdown of the large scale natural refrigerant heat pump, by country
Company Information
- Detailed analysis and profiling of additional market players (up to five)
Key Questions Addressed by the Report
What was the size of the large scale natural refrigerant heat pump market in 2024?
The large-scale natural refrigerant heat pump market was worth USD 6.62 billion in 2024.
What are the major drivers for the large scale natural refrigerant heat pump market?
Major policy initiatives like the EU Green Deal, the REPowerEU, and the US Inflation Reduction Act are likely to drive market growth significantly.
Which region is projected to be the largest market for large scale natural refrigerant heat pumps during the forecast period?
North America is estimated to dominate the large-scale natural refrigerant heat pump market during the forecast period.
By capacity, which segment in the large scale natural refrigerant heat pump market is likely to dominate?
The 200–500 kW segment is likely to account for the largest market share during the forecast period.
By refrigerant, which segment is expected to register the highest CAGR during the forecast period?
The Ammonia (R-717) segment is projected to register the highest CAGR of 16.2% during the forecast period.
Need a Tailored Report?
Customize this report to your needs
Get 10% FREE Customization
Customize This ReportPersonalize This Research
- Triangulate with your Own Data
- Get Data as per your Format and Definition
- Gain a Deeper Dive on a Specific Application, Geography, Customer or Competitor
- Any level of Personalization
Let Us Help You
- What are the Known and Unknown Adjacencies Impacting the Large scale Natural Refrigerant Heat Pump Market
- What will your New Revenue Sources be?
- Who will be your Top Customer; what will make them switch?
- Defend your Market Share or Win Competitors
- Get a Scorecard for Target Partners

Custom Market Research Services
We Will Customise The Research For You, In Case The Report Listed Above Does Not Meet With Your Requirements
Get 10% Free CustomisationTESTIMONIALS

Kimberly Murphy
GLOBAL MARKETING DIRECTOR
Bently Nevada,
Leading Condition Monitoring & Asset Protectionwww.bakerhughesds.com/bently-nevada

MarketsandMarkets™ showed consistent rigor for success and relentlessly worked with Bently Nevada stakeholders to positively impact go-to-market strategy. Their proactiveness and flexibility has been instrumental in achieving the objectives to grow our sales pipeline in key industrial markets.

DARRICK HUEBER
Business Development Leader
Nexus Controls LLC,
Leading Manufacturer of Automation System & Electrical Panelswww.bakerhughesds.com/nexus-controls

We partnered with MarketsandMarkets to expand our business further by tapping into new industrial segments. It was critical for us to gather crucial business insights about specific markets to achieve this goal. MarketsandMarkets engagement model and client services helped us provide those insights, it was really impressive and valuable for my business. The team was extremely flexible and helpful.

Mike Schoff
Global Industrial Commercial Strategy Leader
Nexus Controls LLC
Leading Manufacturer of Automation System & Electrical Panelswww.bakerhughesds.com/nexus-controls
We consulted MarketsandMarkets for potential Partner Identification. Overall, it was a good experience. The insights provided through interviews conducted by the team helped us put together the questionnaire required for discussion with the selected partners. Their ability to provide insights through interviews with customers in a timely manner was quite impressive.


Growth opportunities and latent adjacency in Large scale Natural Refrigerant Heat Pump Market