
Military Drone (UAV) Market Size, Share & Trends, 2025 To 2030

Military Drone (UAV) Market by Platform (Small, Tactical, Strategic), Type (Fixed Wing, Rotary Wing, Hybrid), Application (UCAVs, ISR, Delivery), Propulsion (Fuel Powered & Battery Powered), MTOW, Operation Mode, Launching Mode & Region Global Forecast to 2030


OVERVIEW
Source: Secondary Research, Interviews with Experts, MarketsandMarkets Analysis
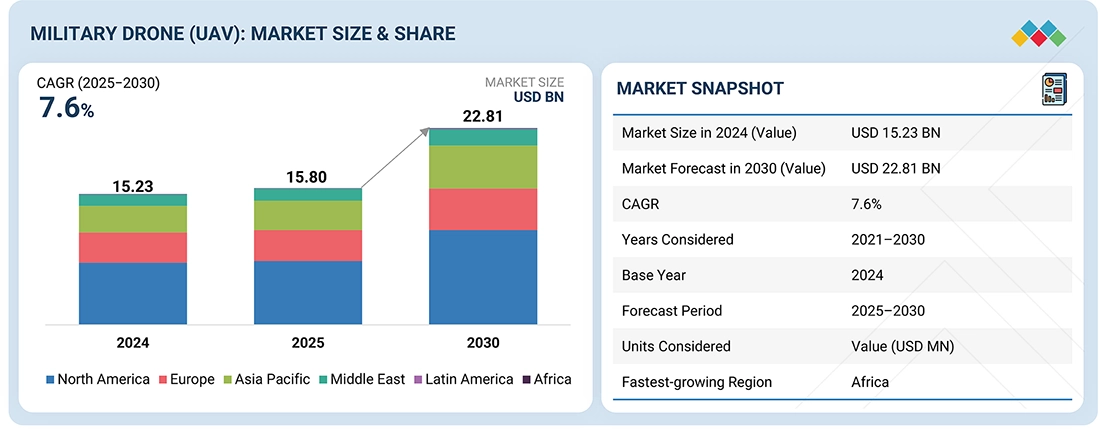
The global military drone (UAV) market is estimated to be USD 15.80 billion in 2025 and is projected to reach USD 22.81 billion by 2030, at a CAGR of 7.6%. The global military drone (UAV) industry is driven by the factors such as rising defense budgets, demand for ISR, precision strike, and electronic warfare capabilities; increasing geopolitical tensions, advancements in AI, autonomy, and swarm technologies, along with procurement of cost-effective tactical UAVs, are accelerating adoption across major defense powers and emerging economies.
KEY TAKEAWAYS
-
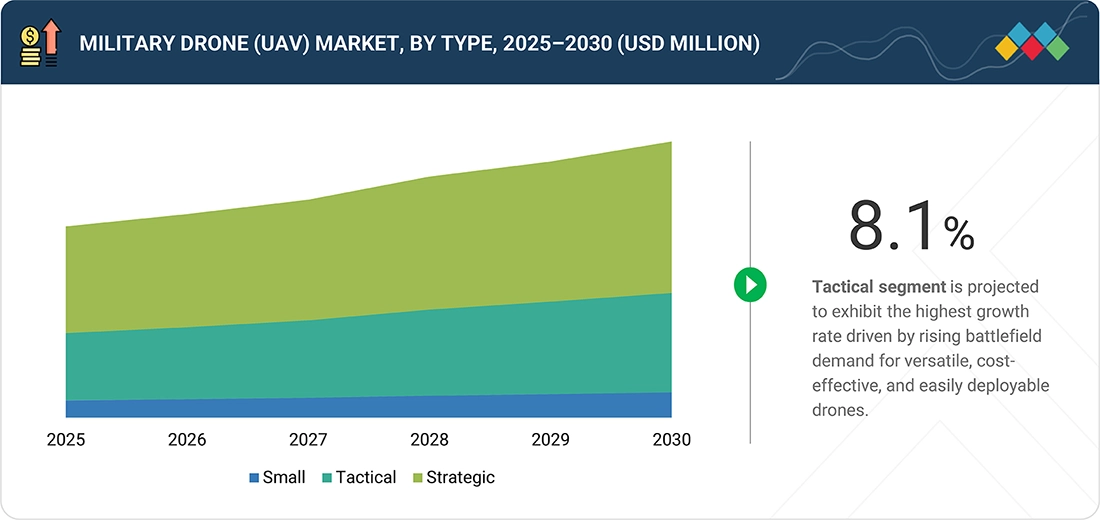
BY TYPEThe global military drone (UAV) market by platform comprises small, tactical, and strategic. Strategic drone dominated the market in 2025, mainly driven by their unmatched endurance, high-altitude surveillance, and global strike capabilities, making them indispensable for intelligence-driven missions and large-scale defense operations worldwide.
-
BY AIRCRAFT TYPEThe global military drone (UAV) market by application comprises UCAVs, ISR, and delivery. The ISR segment dominated the market in 2025, mainly driven by the demand for watching, tracking, and gathering intelligence. They face fewer political limits than combat drones and are more practical than delivery drones.
-
BY APPLICATIONThe global military drone (UAV) market by type comprises fixed, rotary, and hybrid, with fixed having the dominant share, mainly driven by demand for longer endurance, higher altitude, and greater payload capacity. They excel in ISR and strike missions, offering cost efficiency, wide coverage, and proven reliability in military operations.
-
BY SPEEDThe global military drone (UAV) market by speed comprises subsonic and supersonic, with subsonic to dominate the market due to their cost-effective, fuel-efficient, and provide longer endurance for ISR and strike missions, while supersonic drones remain expensive, complex, and limited to niche high-speed applications.
-
BY OPERATION MODEThe global military drone (UAV) market by operation mode comprises remotely piloted, optionally piloted, and fully autonomous, with optionally piloted to dominate the market due to dual flexibility—operated with or without a pilot—enhancing mission adaptability, reducing risk, and enabling seamless transition between manned and unmanned operations in varied combat scenarios.
-
BY REGIONBased on region, the market is divided into North America, Europe, Asia Pacific, the Middle East, Latin America, and Africa. North America accounts for the largest share of the market, driven by significant defense expenditure and the strong presence of key manufacturers in the region.
-
COMPETITIVE LANDSCAPEMajor players in the global military drone (UAV) market have adopted both organic and inorganic strategies, including partnerships and acquisitions. For example, Northrop Grumman and Raytheon collaborated to enhance advanced ISR and strike-capable UAV systems.
The global military drone (UAV) market was valued at USD 15.23 billion in 2024 and is projected to grow from USD 15.80 billion in 2025 to USD 21.81 billion by 2030, at a CAGR of 7.6% during the forecast period.
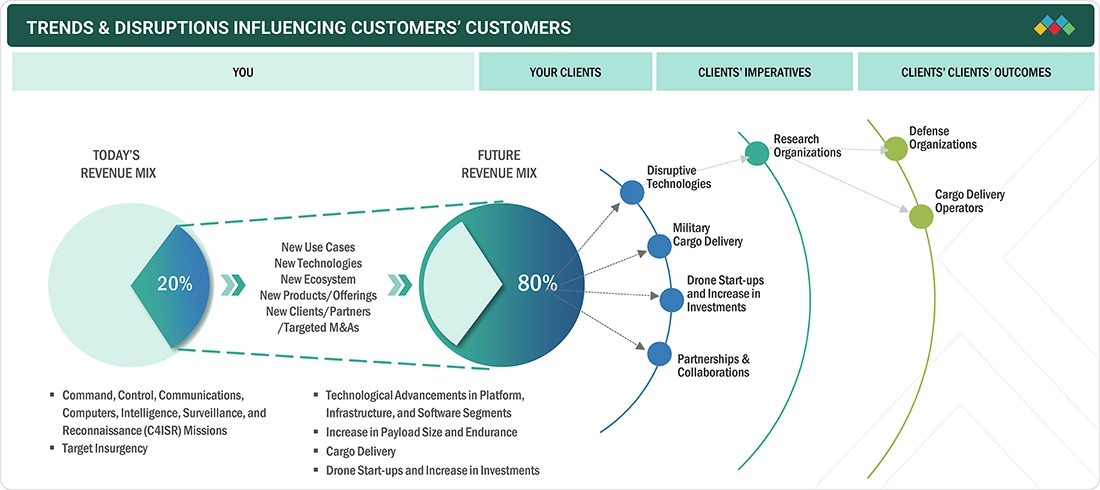
TRENDS & DISRUPTIONS IMPACTING CUSTOMERS' CUSTOMERS
The military drone market is projected to register a CAGR of 7.6% by value during the forecast period. Several military drone providers are looking for venture capital investments, partnerships, collaborations, and joint ventures to carry out drone technology advancements. This, in turn, is expected to aid in vital improvements in drone platforms, infrastructures, software, and services with an increased customer base for drones. In addition, the growing military expenditure of various countries is leading to opportunities for drone startups to collaborate with government bodies and large-scale companies to establish a strong foothold in the market.
Source: Secondary Research, Interviews with Experts, MarketsandMarkets Analysis
MARKET DYNAMICS
Level
-
Emergence of non-traditional adversaries and asymmetric warfare

-
Rise of advanced avionics technologies

Level
-
Lack of skilled and trained operators

-
Concern and call to ban fully autonomous drones

Level
-
Use of UAVs for cargo delivery in military operations

-
Technological advancements in drone payloads

Level
-
Defining secure identification for safety

-
Issues with hijacking and security of UAVs

Source: Secondary Research, Interviews with Experts, MarketsandMarkets Analysis
Emergence of non-traditional adversaries and asymmetric warfare
The rise of unconventional threats, terrorism, and asymmetric warfare has increased demand for drones. UAVs provide militaries with cost-effective surveillance, reconnaissance, and strike capabilities to counter irregular adversaries where traditional assets may be less effective.
Lack of skilled and trained operators
Despite rapid adoption, effective drone deployment requires skilled operators and analysts. Shortages in training programs and expertise in handling advanced UAVs limit operational efficiency, slow adoption rates, and hinder full exploitation of UAV capabilities across defense forces.
Use of UAVs for cargo delivery in military operations
Expanding UAV use in logistics and resupply offers significant potential. Drones can transport ammunition, food, and medical supplies in hostile or remote areas, reducing risks to personnel while enhancing mission sustainability and battlefield efficiency.
Defining secure identification for safety
As drone usage grows, ensuring secure identification becomes vital to prevent misuse, fratricide, or accidental engagements. Establishing standardized, tamper-proof identification systems is crucial for safety, interoperability, and compliance with international defense and airspace regulations.
Military Drone (UAV) Market: COMMERCIAL USE CASES ACROSS INDUSTRIES
| COMPANY | USE CASE DESCRIPTION | BENEFITS |
|---|---|---|
 |
Provides advanced UAV systems and sensor payloads for intelligence, surveillance, target acquisition, and reconnaissance (ISTAR), as well as air defense counter-UAV solutions | Enhances situational awareness, improves threat detection, and enables precision engagement in contested environments |
 |
Develops large HALE (High-Altitude Long Endurance) UAVs such as Global Hawk for persistent ISR missions, battlefield communications relay, and maritime domain awareness | Provides unmatched endurance, global coverage, and strategic intelligence capabilities, reducing risks to manned aircraft |
 |
Supplies a wide portfolio of tactical and MALE UAVs (e.g., Heron family) for surveillance, border security, and strike missions across multiple regions | Offers operational flexibility, lower cost of deployment, and combat-proven performance under diverse battlefield conditions |
 |
Manufactures MQ-9 Reaper and Gray Eagle UAVs for multi-role missions including precision strike, ISR, and electronic warfare support | Delivers high mission versatility, proven strike effectiveness, and integration with NATO and allied forces’ command systems |
 |
Provides small tactical UAVs and advanced electro-optical/infrared (EO/IR) payloads for reconnaissance, target tracking, and counter-insurgency missions | Enhances tactical edge with lightweight, rapid-deployment drones and superior sensor imaging, improving mission success in complex terrains |
Logos and trademarks shown above are the property of their respective owners. Their use here is for informational and illustrative purposes only.
MARKET ECOSYSTEM
Prominent companies and startups that provide military drones and their services, distributors/suppliers/retailers, industrial sectors, and end customers are the key stakeholders in the military drone market ecosystem. Investors, funders, academic researchers, distributors, service providers, and industries using military drones serve as the major influencers in the market.
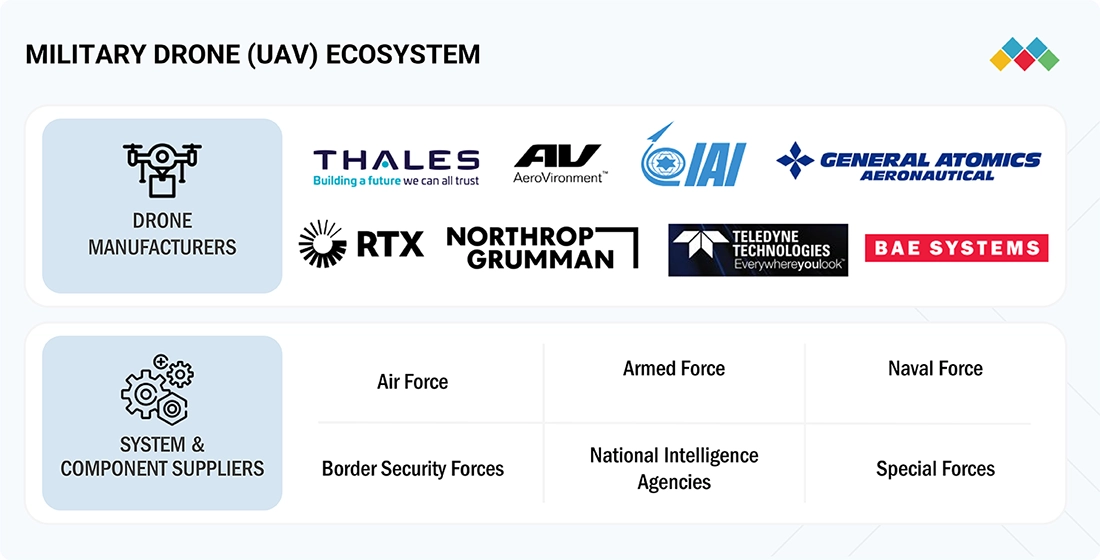
Logos and trademarks shown above are the property of their respective owners. Their use here is for informational and illustrative purposes only.
MARKET SEGMENTS
Source: Secondary Research, Interviews with Experts, MarketsandMarkets Analysis
Military Drone (UAV) Market, By Platform
The global military drone (UAV) market is segmented by platform into small, tactical, and strategic. Strategic drones dominated the market in 2025, driven by their unmatched endurance, high-altitude surveillance, and global strike capabilities, making them indispensable for intelligence-driven missions and large-scale defense operations worldwide.
Military Drone (UAV) Market, By Application
The global military drone (UAV) market by application comprises UCAVs, ISR, and delivery. The ISR segment dominated the market in 2025, driven by the demand for watching, tracking, and gathering intelligence. They face fewer political limits than combat drones and are more practical than delivery drones.
Military Drone (UAV) Market, By Type
The global military drone (UAV) market by type comprises fixed, rotary, and hybrid, with fixed having the dominant share, mainly driven by demand for longer endurance, higher altitude, and greater payload capacity. They excel in ISR and strike missions, offering cost efficiency, wide coverage, and proven reliability in military operations.
Military Drone (UAV) Market, By Speed
The global military drone (UAV) market by speed comprises subsonic and supersonic, with subsonic drones dominating the market due to their cost-effectiveness, fuel efficiency, and longer endurance for ISR and strike missions. Supersonic drones, on the other hand, remain expensive, complex, and limited to niche high-speed applications.
Military Drone (UAV) Market, By Operation Mode
The global military drone (UAV) market by operation mode comprises remotely piloted, optionally piloted, and fully autonomous, with optionally piloted to dominate the market due to dual flexibility—operated with or without a pilot—enhancing mission adaptability, reducing risk, and enabling seamless transition between manned and unmanned operations in varied combat scenarios.
Military Drone (UAV) Market, By Launch Mode
The global military drone (UAV) market, by launch mode, comprises automatic take-off & landing, vertical takeoff, catapult launcher, and hand launched, with automatic take-off & landing expected to dominate the market due to the demand for reducing human error, improving mission safety, enabling deployment in harsh environments, and ensuring consistent UAV operations, making it vital for modern military drone missions.
Military Drone (UAV) Market, By Propulsion
The global military drone (UAV) market, by propulsion, comprises fuel-powered and battery-powered drones, with fuel-powered drones dominating the market as they provide longer endurance, higher payload capacity, and extended range, making them better suited for ISR and combat missions than battery-powered drones with limited flight times.
Military Drone (UAV) Market, By MTOW
The global military drone (UAV) market is segmented into < 150 Kg, 151 - 1200 Kg, and > 1200 Kg, with >1200 Kg continuing to drive the market due to its ability to carry heavier payloads, advanced sensors, and weapons, offering extended endurance, higher altitude operations, and multi-role capabilities essential for strategic military missions.
REGION
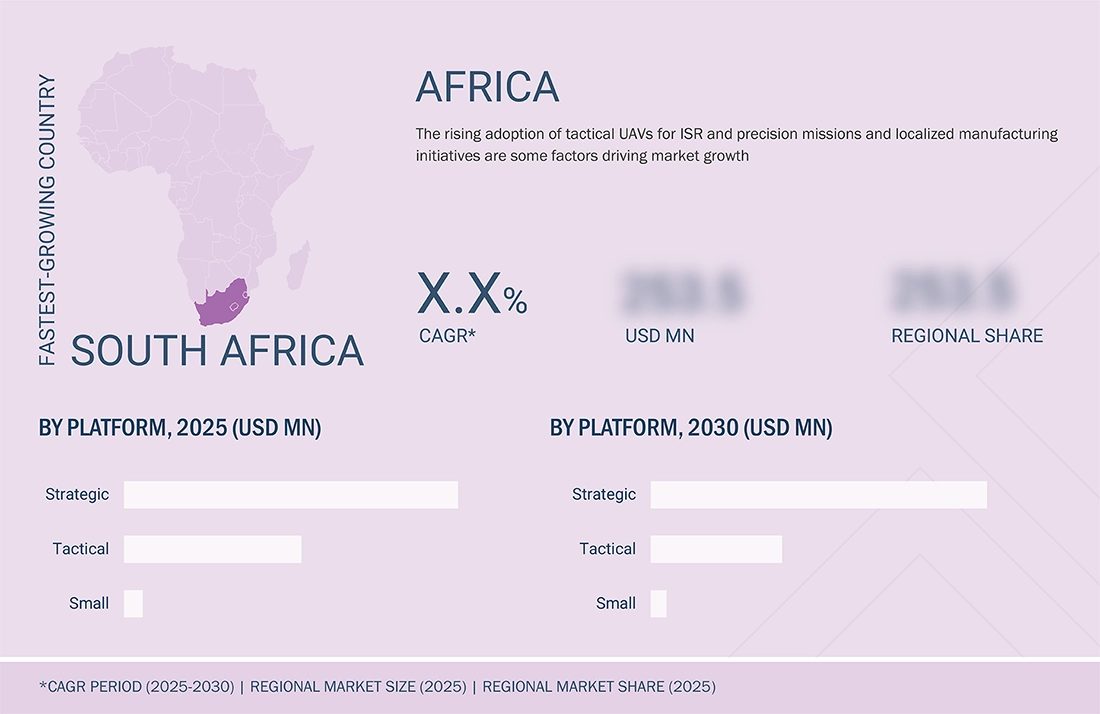
Middile East & Africa to be the fastest-growing region in global military drone (uav) market during forecast period
The region has registered an increasing adoption of cost-effective tactical UAVs for ISR and precision missions, supported by foreign apartnerships, and growing defense modernization programs across Nigeria, South Africa, and North African nations.
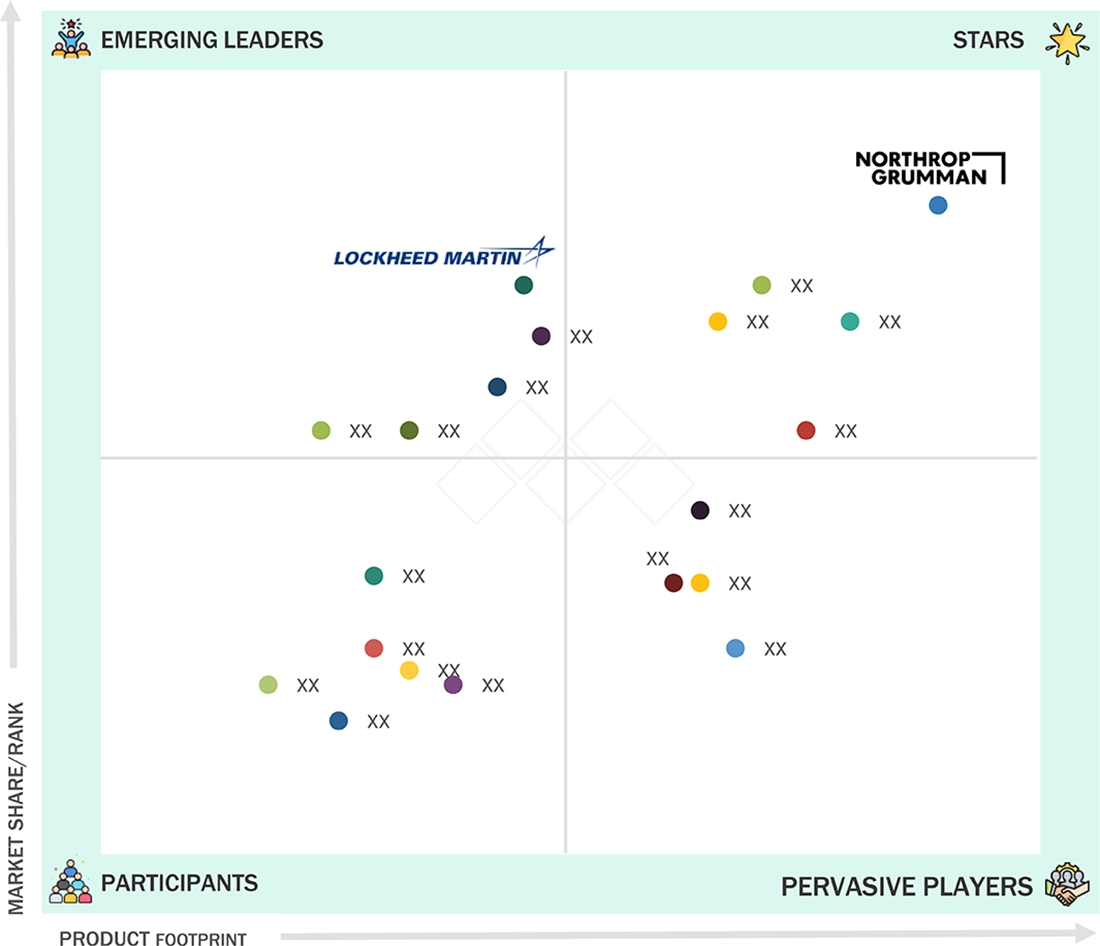
Military Drone (UAV) Market: COMPANY EVALUATION MATRIX
Northrop Grumman Corporation (US), Raytheon Technologies Corporation (US), and Teledyne FLIR LLC (US) (Stars) are some prominent companies in this market. They have an established portfolio of reputable products and services, a robust market presence, strong business strategies, a significant market share, products with wider applications, broader geographical use cases, and a larger product footprint. Lockheed Martin (Emerging Leader) is a high-potential company identified in this market that could become a significant player in the military drone sector.
Source: Secondary Research, Interviews with Experts, MarketsandMarkets Analysis
KEY MARKET PLAYERS
MARKET SCOPE
| REPORT METRIC | DETAILS |
|---|---|
| Market Size in 2025 (Value) | USD 15.23 Billion |
| Market Forecast in 2030 (Value) | USD 22.81 Billion |
| Growth Rate | CAGR of 7.6% from 2025–2030 |
| Years Considered | 2021–2030 |
| Base Year | 2024 |
| Forecast Period | 2025–2030 |
| Units Considered | Value (USD Million) |
| Report Coverage | Revenue forecast, company ranking, competitive landscape, growth factors, and trends |
| Segments Covered |
|
| Regions Covered | North America, Europe, Asia Pacific, Middle East, Latin America, and Africa |
WHAT IS IN IT FOR YOU: Military Drone (UAV) Market REPORT CONTENT GUIDE
DELIVERED CUSTOMIZATIONS
We have successfully delivered the following deep-dive customizations:
| CLIENT REQUEST | CUSTOMIZATION DELIVERED | VALUE ADDS |
|---|---|---|
| Leading Manufacturer | Additional segment breakdown for countries | Additional country-level market sizing tables for segments/sub-segments covered at the regional/global level to gain an understanding of country-wise markets |
| Emerging Leader | Additional Company Profiles | Competitive information on targeted players to gain granular insights on direct competition |
| Regional Market Leader | Additional country market estimates | Additional country-level deep dive for a more targeted undertanding on the TAM |
RECENT DEVELOPMENTS
- May 2025 : Northrop Grumman launched its newly developed Lumberjack, a versatile multi-target uncrewed aircraft system (UAS).
- May 2025 : Teledyne FLIR Defense unveiled multiple upgrades to the Black Hornet 4 Nano-Drone at SOF Week 2025, enhancing its performance and capabilities for covert operations and intelligence gathering.
- May 2025 : AeroVironment launched Red Dragon (One-Way Attack UAS). It is a fully autonomous, software-defined drone designed for one-way attack missions in GPS-denied and communications-degraded environments. It features AVACORE software architecture and SPOTR-Edge perception system for target detection and classification.
- May 2025 : Titan 4 is a new addition to AeroVironment’s Titan family of RF-based counter-UAS solutions. It is designed to detect, track, and disrupt hostile UAVs using advanced RF threat identification capabilities.
- March 2025 : RTX Corporation launched a new version of the combat-proven Coyote family of products, Coyote LE SR. It is a part of a line of UAS called launched effects, which can be fired from the air, ground, or sea to perform a variety of missions.
Table of Contents
 Exclusive indicates content/data unique to MarketsandMarkets and not available with any competitors.
Methodology
This research study on the military drone market involved the extensive use of secondary sources, directories, and databases such as Hoovers, Bloomberg BusinessWeek, and Factiva to identify and collect information relevant to the market. Primary sources included industry experts, service providers, manufacturers, solution providers, technology developers, alliances, and organizations related to all segments of this industry's value chain. In-depth interviews with primary respondents, including key industry participants, subject matter experts, industry consultants, and C-level executives, were conducted to obtain and verify critical qualitative and quantitative information about the military drone market and assess the market's growth prospects.
Secondary Research
The market share of companies in the military drone market was determined using the secondary data acquired through paid and unpaid sources, and by analyzing the product portfolios of major companies operating in the market. These companies were rated based on the performance and quality of their products. Primary sources further validated these data points.
Secondary sources referred to for this research study on the military drone market included government sources, such as Association for Unmanned Vehicle Systems International (AUVSI), Jane's Information Group, Aerospace Industries Association (AIA), Unmanned Aviation and Advanced Air Mobility, Defense News, US Department of Defense Reports and federal and state governments of various countries; corporate filings, such as annual reports, investor presentations, and financial statements; and trade, business, and professional associations; among others. Secondary data was collected and analyzed to determine the overall size of the military drone market, which was further validated by primary respondents.
Primary Research
After acquiring information regarding the military drone market scenario through secondary research, extensive primary research was conducted. Several primary interviews were conducted with market experts from both the demand and supply sides across major countries of North America, Europe, Asia Pacific, the Middle East, Africa, and Latin America. Primary data was collected through questionnaires, emails, and telephone interviews.

Note: C-level executives include the CEO, COO, and CTO, among others.
Others include sales managers, marketing managers, and product managers.
Tiers of companies have been defined based on their total revenue as of 2024: Tier 1 = > USD 1 billion, Tier 2 = USD 100 million to USD 1 billion, and Tier 3 = < USD 100 million.
To know about the assumptions considered for the study, download the pdf brochure
Market Size Estimation
All percentage shares, splits, and breakdowns were determined using secondary sources and verified through primary sources. All possible parameters that affect the markets covered in this research study were accounted for, viewed in extensive detail, verified through primary research, and analyzed to obtain the final quantitative and qualitative data. This data was consolidated, enhanced with detailed inputs, analyzed by MarketsandMarkets, and presented in this report.
- Both top-down and bottom-up approaches were used to estimate and validate the size of the military drone market.
- Key players were identified through secondary research, and their market ranking was determined through primary and secondary research. This included a study of annual and financial reports of the top market players and extensive interviews with leaders, including CEOs, directors, and marketing executives.
Military Drone Market : Top-Down and Bottom-Up Approach

Data Triangulation
After arriving at the overall size of the military drone market from the market size estimation process explained above, the total market was split into several segments and subsegments. Wherever applicable, data triangulation and market breakdown procedures described below were implemented to complete the overall market engineering process and arrive at the exact statistics for various market segments and subsegments. The data was triangulated by studying different factors and trends from both the demand and supply sides. Additionally, the market size was validated using both top-down and bottom-up approaches.
Market Definition
Military drones, also known as unmanned aerial vehicles, find application in diverse military roles like combat, intelligence, surveillance, reconnaissance (ISR), and delivery. The global armed forces increasingly embrace unmanned combat aerial vehicles (UCAVs), including lethal drones, combat drones, and target drones. These drones can be remotely piloted, optionally piloted, or fully autonomous, and they are categorized based on platforms such as small, strategic, and tactical. High Altitude Long Endurance (HALE) and Medium Altitude Long Endurance (MALE) drones, characterized by extended endurance, serve as fixed platforms capable of carrying substantial ISR payloads and precision munitions for combat.
Key Stakeholders
- Military Drone Manufacturers
- Defense contractors
- Original Equipment Manufacturers
- Military Service Providers
- Payload & Warhead Suppliers
- Research Organizations
- Investors and Venture Capitalists
- Ministries of Defense
- R&D Companies
Report Objectives
- To define, describe, and forecast the size of the military drone market based on platform, application, MTOW, speed, type, operation mode, launching mode, propulsion, and region from 2023 to 2028
- To forecast the size of market segments with respect to five major regions: North America, Europe, the Asia Pacific, the Middle East, Latin America, and Africa.
- To identify and analyze key drivers, restraints, opportunities, and challenges influencing the growth of the market
- To strategically analyze micromarkets with respect to individual growth trends, prospects, and their contribution to the market
- To analyze opportunities for stakeholders in the market by identifying key market trends
- To analyze competitive developments such as contracts, acquisitions, expansions, agreements, joint ventures, partnerships, product developments, and research and development (R&D) activities in the market
- To provide a detailed competitive landscape of the market, in addition to an analysis of business and corporate strategies adopted by leading market players
- To strategically profile key market players and comprehensively analyze their core competencies
Available Customizations
Along with the market data, MarketsandMarkets offers customizations to meet the specific needs of companies. The following customization options are available for the report:
Product Analysis
- Product matrix, which gives a detailed comparison of the product portfolio of each company
Regional Analysis
- Further breakdown of the market segments at the country level
Company Information
- Detailed analysis and profiling of additional market players (up to 5)
Need a Tailored Report?
Customize this report to your needs
Get 10% FREE Customization
Customize This ReportPersonalize This Research
- Triangulate with your Own Data
- Get Data as per your Format and Definition
- Gain a Deeper Dive on a Specific Application, Geography, Customer or Competitor
- Any level of Personalization
Let Us Help You
- What are the Known and Unknown Adjacencies Impacting the Military Drone (UAV) Market
- What will your New Revenue Sources be?
- Who will be your Top Customer; what will make them switch?
- Defend your Market Share or Win Competitors
- Get a Scorecard for Target Partners

Custom Market Research Services
We Will Customise The Research For You, In Case The Report Listed Above Does Not Meet With Your Requirements
Get 10% Free CustomisationGrowth opportunities and latent adjacency in Military Drone (UAV) Market


Kutay
Aug, 2019
Dear Madam/Sir, I have been assigned a project as an outsourced contractor to understand global military UAVs and analyze deeper details of the addressable markets for each UAV types. If you bless me with a sample report, I will convince my contractor to purchase the full report in order to conduct my analysis. Thank you in advance. Best regards, Kutay PINARCI.
Ronald
Feb, 2019
I would like to get some statistical data on the use of drones, their market share, distribution, and economic outlook in Africa, with a strong concentration on the Nigerian market..
Dunja
Jan, 2019
I am looking for insights into the drone industry, specifically information about the use of drones in the military and counterdrone markets for a presentation about these subejcts. .
Claire
Jul, 2019
To understand the key drivers of the military drone market, particularly in relation to the US defence sector..
John
Apr, 2019
I am conducting an analysis for a customer interested in the growth/development of the military UAS technology over the next 10+ years..