
Radiation Hardened Electronics Market Size, Share & Trends

Radiation Hardened Electronics Market Size, Share & Trends by Component (Mixed Signal ICs, Processors & Controllers, Memory, Power Management), Manufacturing Technique (RHBD, RHBP), Product Type (COTS, Custom), Application and Region - Global Forecast to 2030


RADIATION HARDENED ELECTRONICS MARKET SIZE, SHARE & TRENDS
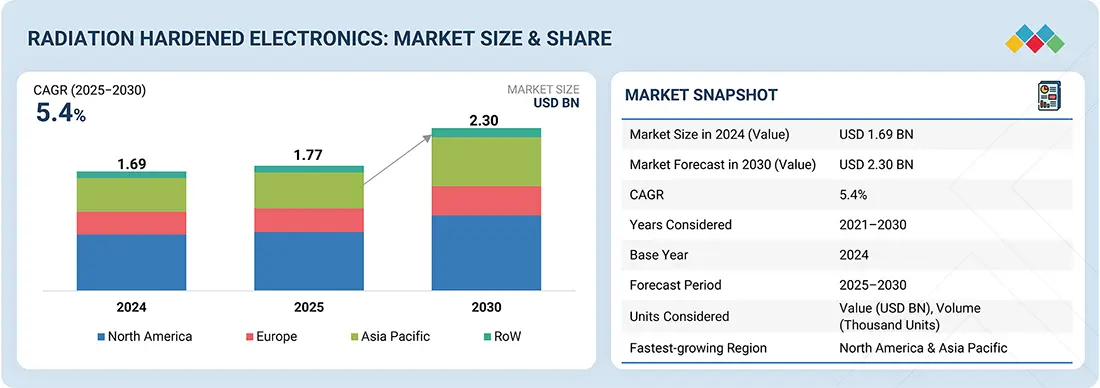
According to Marketsandmarkets, the Radiation Hardened Electronics Market Size was valued at USD 1.77 billion in 2025 and is projected to reach USD 2.30 billion in 2030, growing at a CAGR of 5.4% from 2025 to 2030. The market is growing steadily due to the rising intelligence, surveillance, and reconnaissance (ISR) activities, advancements in multicore processors for military and space applications, and the increasing demand from commercial satellites and nuclear-hardened systems. Governments and defense agencies invest heavily to ensure mission success in harsh environments, while global space missions fuel opportunities for reconfigurable rad-hard electronics and the adoption of commercial-off-the-shelf (COTS) components.
MARKET SNAPSHOT TABLE
| REPORT METRIC | DETAILS |
|---|---|
| Market Size in 2025 (Value) | USD 1.77 billion |
| Market Forecast in 2030 (Value) | USD 2.30 billion |
| Growth Rate | CAGR of 5.4% from 2025-2030 |
| Years Considered | 2021-2030 |
| Base Year | 2024 |
| Forecast Period | 2025-2030 |
| Units Considered | Value (USD Billion), Volume (Thousand Units) |
| Report Coverage | Revenue forecast, company ranking, competitive landscape, growth factors, and trends |
| Top Companies |
|
| Growth Driver |
|
| Segments Covered |
|
| Regions Covered | North America, Asia Pacific, Europe, RoW |
RADIATION HARDENED ELECTRONICS MARKET SIZE & FORECAST
The Radiation Hardened Electronics Market Size is expanding steadily as demand grows for highly reliable electronic components capable of operating in extreme radiation environments such as space missions, nuclear facilities, and defense systems. This expansion is driven by the increasing number of satellite launches, growing intelligence, surveillance, and reconnaissance (ISR) activities, and rising investments in aerospace and defense technologies. As governments and private space companies continue to develop advanced spacecraft and communication satellites, the Radiation Hardened Electronics Industry is witnessing significant demand for processors, memory devices, and power management components that can withstand harsh radiation conditions.
The Radiation Hardened Electronics Market Share is largely dominated by North America due to strong investments from space agencies, defense organizations, and commercial space enterprises, while Asia Pacific is emerging as a rapidly growing region because of expanding space programs and semiconductor capabilities. Key Radiation Hardened Electronics Market Trends include the increasing adoption of radiation-hard-by-design (RHBD) manufacturing techniques, growing use of commercial-off-the-shelf (COTS) components in satellite systems, and the development of advanced multicore processors for mission-critical applications. These innovations are reshaping the Radiation Hardened Electronics Industry by improving system reliability and reducing development costs for space and defense platforms. With continued technological innovation and rising global investments in space exploration and defense infrastructure, the Radiation Hardened Electronics Market Growth is expected to strengthen further, enhancing the overall Radiation Hardened Electronics Market Share across aerospace, nuclear, and high-reliability electronics sectors worldwide.
RADIATION HARDENED ELECTRONICS MARKET KEY TAKEAWAYS
-
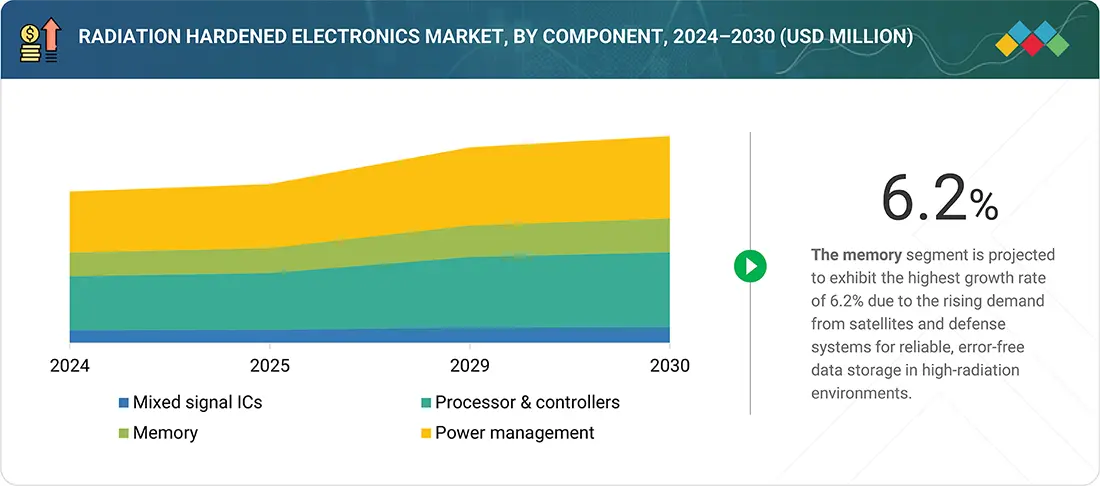
BY COMPONENTThe radiation hardened electronics market comprises of mixed signal ICs, processors & controllers, memory, and power management. The power management segment is estimated to account for the largest market share in 2030. The necessity of power management systems is a prominent driver of market growth, as well as their versatility and the need to ensure continued, efficient system performance.
-
BY MANUFACTURING TECHNIQUEThe market comprises radiation hardened by design and radiation hardened by process. The radiation-hardened-by-design segment is expected to dominate the overall market throughout the forecast period. These techniques involve different design strategies to offer superior resistance to radiation effects; as such, they may witness wide usage in satellites and defense.
-
BY PRODUCT TYPEThe market is segmented based on product type into commercial off-the-shelf products and custom-made products. The commercial off-the-shelf products segment is projected to lead the market throughout the forecast period. Their cost-effectiveness, versatility, and adaptability have made them highly sought after in the application areas for radiation-hardened electronics.
-
BY APPLICATIONBy application, the space (satellites) segment is projected to grow at the fastest rate during the forecast period, followed by the aerospace & defense segment. Space applications offer a sustained, growing demand for radiation-hardened electronics; satellites, probes, and other equipment must be able to withstand harsh conditions to ensure their feasibility and utility.
-
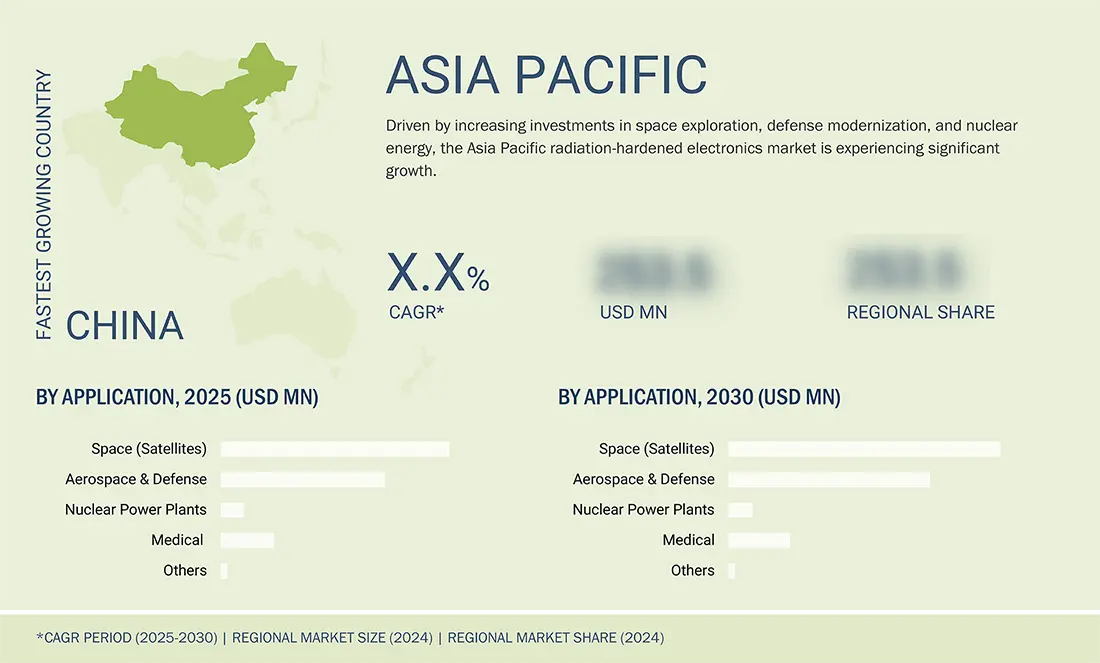
BY REGIONAsia Pacific is expected to be the fastest-growing market due to the increasing investments in space exploration, defense modernization, and nuclear energy.
-
COMPETITIVE LANDSCAPEThe major market players have adopted both organic and inorganic growth strategies, including partnerships and investments. The leading market players are Microchip, BAE Systems, and STMicroelectronics, leading with broad product portfolios. Niche companies such as Vorago Technologies and 3D Plus bring innovation in high-reliability designs.
The radiation-hardened electronics industry is expected to expand steadily over the coming decade, driven by rising investments in space exploration, defense modernization, and nuclear energy programs. These components are designed to withstand extreme radiation environments, ensuring reliable performance in satellites, military systems, and critical infrastructure. Growing satellite deployments for communication and earth observation, along with increasing demand for secure defense electronics, are fueling adoption. With technological advancements in design and manufacturing, Rad-Hard electronics are becoming more efficient and versatile, setting the stage for sustained global market growth.
Source: Secondary Research, Interviews with Experts, MarketsandMarkets Analysis
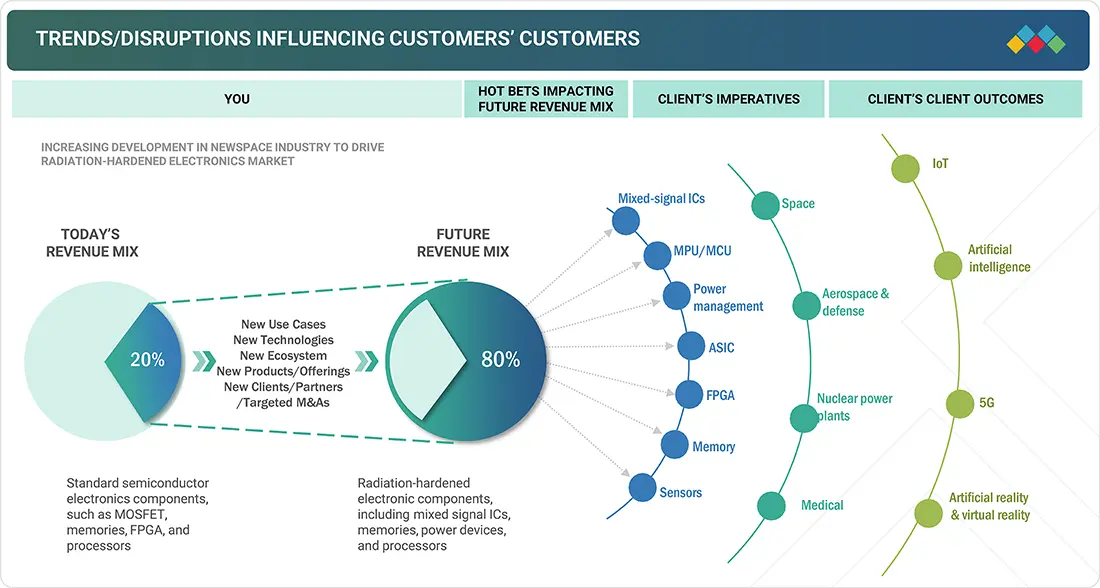
TRENDS & DISRUPTIONS IMPACTING CUSTOMERS' CUSTOMERS
Increasing development in government and commercial satellites and the proliferation of several space missions, which include long-term satellites in high Earth orbit, are creating growth opportunities in the radiation-hardened electronics market. However, the major market driver for radiation-hardened electronics is low Earth orbit applications, such as reconnaissance orbiting and communication satellites, which use advanced radiation-hardened ICs for mission reliability.
Source: Secondary Research, Interviews with Experts, MarketsandMarkets Analysis
RADIATION HARDENED ELECTRONICS MARKET DYNAMICS
Level
-
Rising intelligence, surveillance, and reconnaissance (ISR) activities

-
Technology advancements in multicore processors used for military and space applications

Level
-
Difficulties in creating real testing environments

-
High costs associated with development of radiation-hardened products

Level
-
Increasing space missions globally

-
Demand for reconfigurable radiation-hardened electronics

Level
-
Customized requirements from high-end consumers

Source: Secondary Research, Interviews with Experts, MarketsandMarkets Analysis
Driver: Rising intelligence, surveillance, and reconnaissance (ISR) activities
The growing need for intelligence, surveillance, and reconnaissance systems in defense is fueling demand for radiation-hardened electronics, as these systems must operate reliably in space and high-radiation environments. This is pushing defense agencies to procure more Rad-Hard processors, sensors, and communication devices.
Restraint: High costs associated with development of radiation-hardened products
Developing Rad-Hard products requires specialized materials, testing facilities, and design techniques, which significantly raise costs. These high expenses limit adoption by smaller players and increase dependency on government funding and large-scale defense contracts.
Opportunity: Increasing space missions globally
With more countries and private firms launching satellites, lunar missions, and deep-space exploration projects, the need for robust Rad-Hard electronics is rising. This creates strong growth opportunities for suppliers to expand their portfolios and secure contracts with space agencies.
Challenge: Customized requirements from high-end consumers
Defense and space customers often demand highly tailored Rad-Hard solutions, such as unique processors or mission-specific FPGAs. Meeting these custom requirements increases design complexity, extends development timelines, and puts pressure on suppliers’ scalability.
RADIATION HARDENED ELECTRONICS MARKET SIZE, SHARE & GROWTH, 2030: COMMERCIAL USE CASES ACROSS INDUSTRIES
| COMPANY | USE CASE DESCRIPTION | BENEFITS |
|---|---|---|
 |
The company is developing a 90 nm process hardening technique to create radiation-hardened ICs capable of withstanding extreme space radiation environments. This initiative is supported by the US Department of Defense through a USD 170 million investment. | The advancement enables higher circuit density, improved speed, and stronger performance in digital applications. It also positions SkyWater to deliver some of the most advanced radiation-hardened ICs for strategic space and defense missions. |
 |
Everspin’s 4Mbit MRAM device was integrated into the SpriteSat (Rising) satellite’s magnetometer system to provide a compact, reliable memory solution capable of withstanding high temperatures and radiation conditions in space. | The MRAM replaces battery-backed SRAM and Flash, delivering non-volatile memory with long-term retention, unlimited endurance, and high reliability, ensuring consistent performance for rugged satellite operations. |
 |
BAE Systems, through its FAST Labs R&D unit, is developing radiation-hardened by design (RHBD) microelectronics under a USD 60 million U.S. Army contract. The project leverages Intel’s commercial foundry process to create advanced design libraries for space and defense applications. | The initiative enables the use of advanced process nodes for RHBD ASICs, offering faster processing, low-power operation, and compact designs. It also strengthens the domestic US supply chain for next-generation aerospace and government missions. |
 |
VORAGO’s Arm Cortex-M0 based microcontroller was selected by NASA and the Air Force Research Laboratory for the Radiation-Hardened Electronic Memory Experiment (RHEME). The MCU is being used to control and monitor tests on how radiation particles affect memory solutions in space. | The project supports the development of radiation-tolerant memory systems capable of detecting and correcting errors in spacecraft electronics. This enhances mission reliability and enables robust performance in extreme radiation and temperature environments. |
Logos and trademarks shown above are the property of their respective owners. Their use here is for informational and illustrative purposes only.
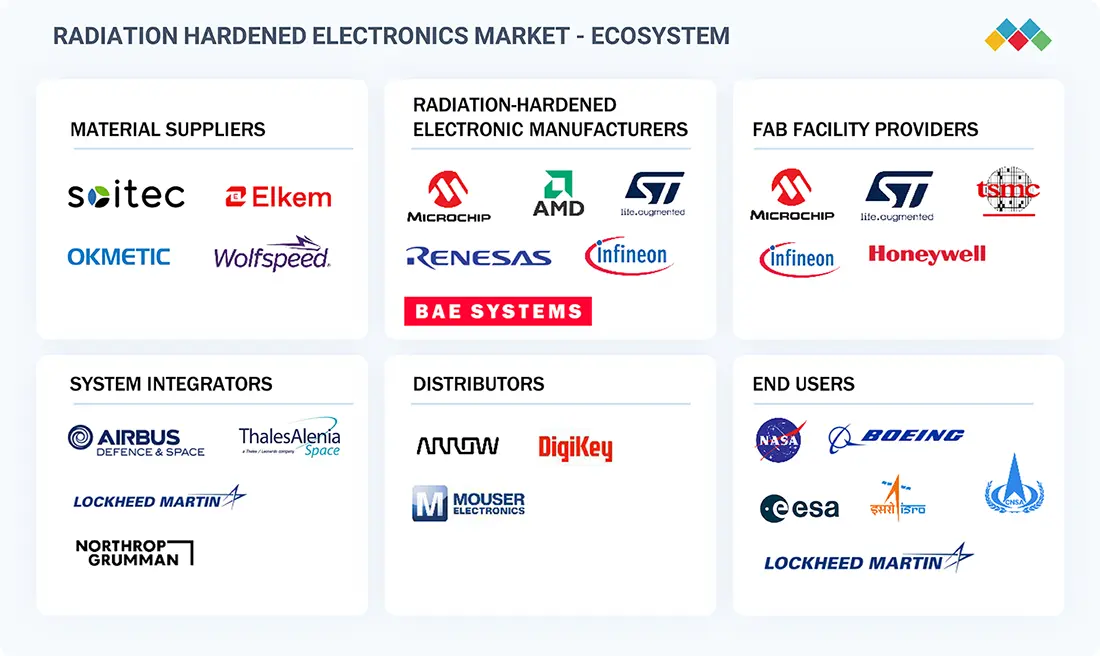
RADIATION HARDENED ELECTRONICS MARKET ECOSYSTEM
The ecosystem of the radiation-hardened electronic market consists of material suppliers, radiation-hardened electronic manufacturers, fab facility providers, system integrators, distributors, and end users. Some of the major manufacturers of radiation-hardened electronics companies are Microchip Technology Inc. (US), Renesas Electronics Corporation (Japan), BAE Systems (UK), Infineon Technologies AG (Germany), STMicroelectronics (Switzerland), and AMD (US).
Logos and trademarks shown above are the property of their respective owners. Their use here is for informational and illustrative purposes only.
RADIATION HARDENED ELECTRONICS MARKET SEGMENTS
Source: Secondary Research, Interviews with Experts, MarketsandMarkets Analysis
Radiation Hardened Electronics Market, By Component
The processors and controllers segment plays a vital role in the radiation-hardened electronics market, as these components are the backbone of mission-critical systems used in satellites, defense platforms, and nuclear facilities. Memory devices are witnessing the fastest growth due to increasing data storage needs in advanced space missions and defense applications. Power management solutions, on the other hand, are expected to command the largest market share by 2030, as they ensure uninterrupted and efficient system performance under extreme radiation conditions. Mixed-signal ICs continue to support communication and signal processing tasks, making the component segmentation essential for building robust, fault-tolerant systems.
Actuators Market, By Manufacturing Technique
Radiation Hardening by Design (RHBD) is expected to hold the largest market share by 2030 and also record the highest CAGR, reflecting its growing importance in building cost-effective and scalable solutions. RHBD techniques rely on circuit- and architecture-level design methods to improve resilience against radiation effects, making them suitable for a wide range of applications, including commercial satellites and defense systems. Radiation Hardening by Process (RHBP) continues to play a vital role in high-reliability missions, where specialized fabrication and materials are required, but RHBD’s balance of performance, flexibility, and cost efficiency is driving its stronger adoption.
Radiation Hardened Electronics Market, By Product Type
Commercial-off-the-Shelf (COTS) products are projected to account for the highest market share by 2030 and also register the highest growth, as they provide a cost-effective solution for commercial satellite programs and short to medium-duration space missions. Their adaptability and affordability make them attractive for new entrants in the space sector as well as for expanding constellations in low-earth orbit. In contrast, custom-made products remain essential for defense, nuclear, and deep-space missions where extreme reliability and long-term radiation resistance are critical. The growing shift toward COTS highlights the market’s preference for scalable and economical solutions without compromising basic performance requirements.
Radiation Hardened Electronics Market, By Application
The space segment is projected to hold the largest market share by 2030 and also record the highest CAGR, driven by the rising number of satellite launches, deep-space exploration programs, and commercial space ventures. Radiation-hardened electronics are indispensable in satellites, launch vehicles, and probes, as they must withstand intense cosmic radiation while ensuring long-term mission reliability. Aerospace and defense remain another key application area, with avionics, electronic warfare, and secure communications depending on fault-tolerant systems. Nuclear power plants and medical equipment, such as imaging devices used in radiation-intensive environments, are also emerging applications, showcasing the broadening utility of Rad-Hard technologies across industries
RADIATION HARDENED ELECTRONICS MARKET REGION
Asia Pacific to be fastest-growing region in global radiation hardened electronics market during forecast period
North America is expected to hold the largest market share by 2030, supported by significant investments from NASA, the US Department of Defense, and private space companies that consistently drive demand for radiation-hardened systems. Europe also maintains a strong position, aided by ESA programs and ongoing defense modernization efforts. Meanwhile, Asia Pacific is projected to register the highest CAGR, fueled by increasing space missions in China, India, and Japan, along with growing regional defense budgets and advancements in semiconductor manufacturing. The rest of the world continues to adopt these technologies in niche defense and energy projects.
RADIATION HARDENED ELECTRONICS MARKET SIZE, SHARE & GROWTH, 2030: COMPANY EVALUATION MATRIX
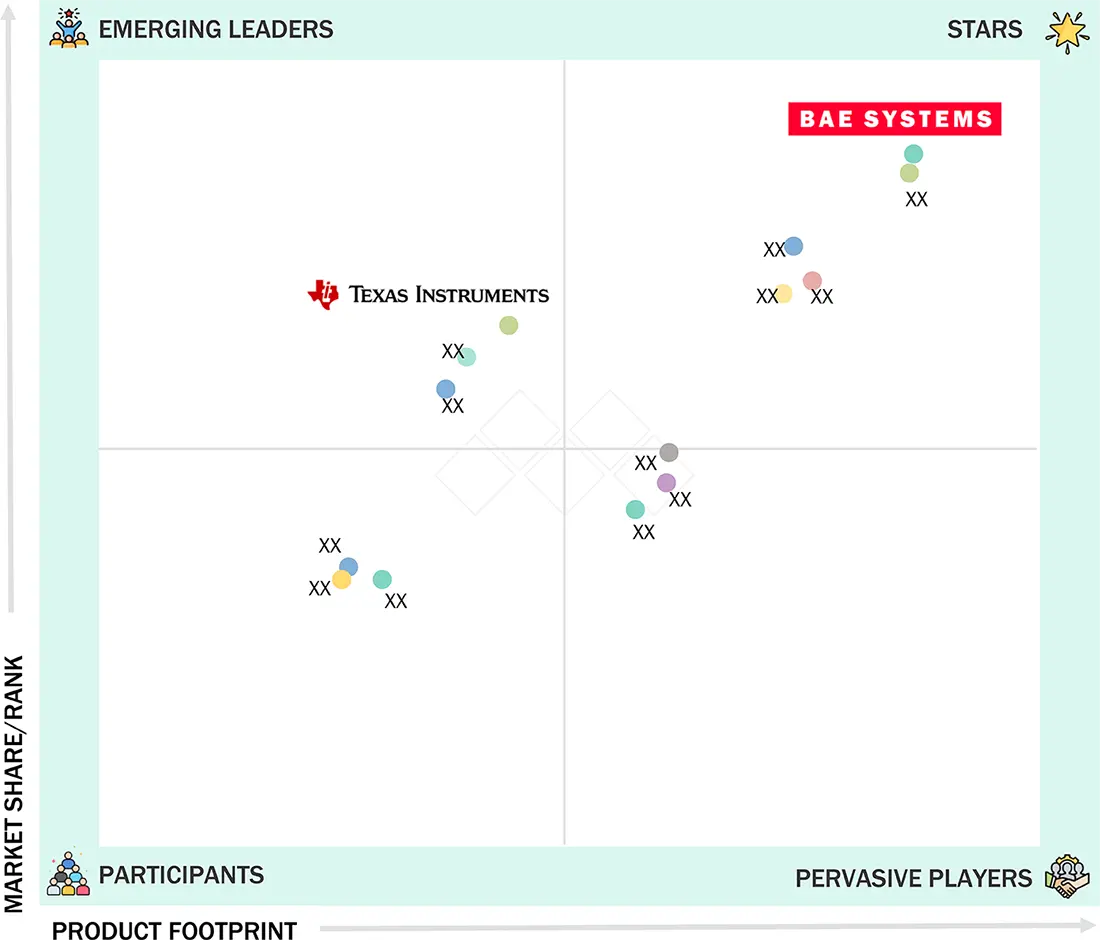
In the radiation-hardened electronics market matrix, BAE Systems (Star) stands out with a strong market presence and an extensive product portfolio, supporting critical defense and space programs worldwide. The company’s long-standing expertise in developing components that can withstand extreme environments positions it as a leader driving adoption across military, aerospace, and satellite applications. Texas Instruments (Emerging Leader), meanwhile, is steadily gaining momentum with its innovative rad-hard semiconductor solutions, catering to both government and commercial space missions. While BAE Systems dominate with scale and legacy programs, Texas Instruments shows strong growth potential to move into the leaders’ quadrant through its focus on advancing rad-hard microelectronics for next-generation platforms.
Source: Secondary Research, Interviews with Experts, MarketsandMarkets Analysis
RADIATION HARDENED ELECTRONICS MARKET KEY PLAYERS
WHAT IS IN IT FOR YOU: RADIATION HARDENED ELECTRONICS MARKET SIZE, SHARE & GROWTH, 2030 REPORT CONTENT GUIDE
DELIVERED CUSTOMIZATIONS
We have successfully delivered the following deep-dive customizations:
| CLIENT REQUEST | CUSTOMIZATION DELIVERED | VALUE ADDS |
|---|---|---|
| US-based Aerospace & Defense Contractor | Detailed profiles of leading rad-hard component suppliers (product lines, technology focus), Benchmarking of suppliers by application fit (missiles, avionics, ISR systems), Ecosystem mapping of OEM–supplier partnerships | Identify reliable suppliers for mission-critical programs; Detect potential risks in supply continuity; Strengthen supplier qualification strategies |
| European Space Agency Supplier | Database of rad-hard IC vendors for satellite programs, Benchmarking of RHBD vs. RHBP adoption, Forecast of component demand for LEO/MEO/GEO missions | Insights into design choices impacting mission lifespan; Support procurement decisions for long-term satellite fleets; Enable selection of cost-effective COTS vs. custom components |
| Nuclear Power Plant Electronics Manufacturer | Assessment of rad-hard electronics adoption in reactor control & monitoring, Testing standards and regulatory compliance benchmarking, Competitive analysis of radiation-tolerant power management ICs | Ensure compliance with stringent safety standards; Minimize downtime with robust electronics integration; Enable positioning in high-barrier nuclear electronics market |
| Asian Semiconductor Company (Entering Rad-Hard Market) | Regional capacity benchmarking (US, EU, Asia), Pipeline analysis of space and defense programs driving demand, Identification of entry opportunities in COTS rad-hard ICs | Strengthen market entry roadmap; Spot high-growth demand clusters in space and defense; Assess competitive gaps for differentiation strategy |
RECENT DEVELOPMENTS
- April 2025 : BAE Systems collaborated with NEXT Semiconductor to develop space-qualified chips by integrating the NX450 ultra-wideband antenna processor unit (APU) into radiation-hardened subsystems. This integration, leveraging GlobalFoundries’ 12nm FinFET process, enhances digitization near sensors to improve performance, reduce SWaP, and strengthen satellite RF and electronic warfare systems.
- January 2024 : Infineon Technologies AG unveiled radiation-hardened asynchronous static random-access memory (SRAM) chips for space applications. Using RADSTOP technology, these chips are designed with proprietary methods for enhanced radiation hardness, ensuring high reliability and performance in harsh environments.
- October 2023 : Teledyne e2v collaborated with Microchip Technology to develop a pioneering space computing reference design, featuring Microchip’s Radiation-Tolerant Gigabit Ethernet PHYs. The innovative design focuses on high-speed data routing in space applications, presented at the EDHPC 2023.
- September 2023 : Microchip Technology Inc. launched the MPLAB Machine Learning Development Suite, a comprehensive solution supporting 8-bit, 16-bit, 32-bit MCUs and 32-MPUs for efficient ML at the edge. The integrated workflow streamlines ML model development across Microchip’s product portfolio.
- September 2023 : Infineon Technologies collaborated with Chinese firm Infypower in the new energy vehicle charger market, providing industry-leading 1200 V CoolSiC MOSFET power semiconductors. This partnership aimed to enhance efficiency in electric vehicle charging stations, offering a wide, constant power range, high density, minimal interference, and high reliability for Infypower’s 30 kW DC charging module.
Table of Contents
 Exclusive indicates content/data unique to MarketsandMarkets and not available with any competitors.
Methodology
The study involved four major activities in estimating the size of the radiation hardened electronics market. Exhaustive secondary research has been done to collect information on the market, peer market, and parent market. Validation of these findings, assumptions, and sizing with industry experts across the value chain through primary research has been the next step. Both top-down and bottom-up approaches have been employed to estimate the global market size. After that, market breakdown and data triangulation have been used to estimate the market sizes of segments and subsegments.
Secondary Research
The secondary research process has referred to various secondary sources to identify and collect necessary information for this study. The secondary sources include annual reports, press releases, and investor presentations of companies; white papers; journals and certified publications; and articles from recognized authors, websites, directories, and databases. Secondary research was conducted to obtain critical information about the industry’s supply chain, the market’s value chain, the total pool of key players, market segmentation according to the industry trends (to the bottom-most level), regional markets, and key developments from market- and technology-oriented perspectives. The secondary data was collected and analyzed to determine the overall market size, further validated by primary research.
Primary Research
Extensive primary research was conducted after gaining knowledge about the current scenario of the radiation hardened electronics market through secondary research. Several primary interviews were conducted with experts from the demand and supply sides across four major regions—North America, Europe, Asia Pacific, and RoW. This primary data was collected through questionnaires, emails, and telephonic interviews.

Note: Other designations include technology heads, media analysts, sales managers, marketing managers, and product managers.
The three tiers of the companies are based on their total revenues as of 2024 ? Tier 1: >USD 1 billion, Tier 2: USD 500 million–1 billion, and Tier 3: USD 500 million.
To know about the assumptions considered for the study, download the pdf brochure
Market Size Estimation
In the complete market engineering process, top-down and bottom-up approaches and several data triangulation methods were used to estimate and forecast the overall market segments and subsegments listed in this report. Key players in the market were identified through secondary research, and their market shares in the respective regions were determined through primary and secondary research. This entire procedure includes the study of annual and financial reports of the top market players and extensive interviews for key insights (quantitative and qualitative) with industry experts (CEOs, VPs, directors, and marketing executives).
All percentage shares, splits, and breakdowns were determined using secondary sources and verified through primary sources. All the parameters affecting the markets covered in this research study were accounted for, viewed in detail, verified through primary research, and analyzed to obtain the final quantitative and qualitative data. This data was consolidated and supplemented with detailed inputs and analysis from MarketsandMarkets and presented in this report. The following figure represents this study’s overall market size estimation process.
Bottom-Up Approach
- Identifying the players in the radiation hardened electronics market that influence the global market, along with their offerings
- Analyzing major manufacturers of radiation-hardened electronics, studying their portfolios, and understanding several types of products based on their features and functions
- Analyzing trends pertaining to the usage of radiation-hardened electronics in end-use industries, such as space, aerospace & defense, nuclear power plants, medical, and others (scientific research and education)
- Tracking ongoing and upcoming developments in the market, such as investments made, R&D activities, product launches, acquisitions, partnerships, agreements, contracts, and expansions, and forecasting the market based on these developments and other critical parameters
- Conducting multiple discussions with key opinion leaders to understand different types of radiation-hardened electronic components, manufacturing techniques, product types, applications, and current trends in the market, and analyzing the breakup of the scope of work carried out by major manufacturing companies
- Arriving at market estimates by analyzing the revenue of these companies generated from different types of components and then combining the same to arrive at the market estimate by region
- Verifying and cross-checking the estimates at every level through discussions with key opinion leaders, such as CXOs, directors, and operations managers, and finally with the domain experts at MarketsandMarkets
- Studying various paid and unpaid sources of information, such as annual reports, press releases, white papers, and databases.
Top-Down Approach
- In the top-down approach, the overall market size was used to estimate the size of individual markets (mentioned in the market segmentation) through percentage splits obtained from secondary and primary research.
- For calculating the size of specific market segments, the parent market size was considered when implementing the top-down approach. The bottom-up approach was also implemented for data extracted from secondary research to validate the market size of different segments.
- The market share of each company was estimated to verify the revenue share used in the bottom-up approach earlier. With data triangulation and data validation through primaries, this study determined and confirmed the size of the parent market and each segment.
Radiation Hardened Electronics Market : Top-Down and Bottom-Up Approach

Data Triangulation
After arriving at the overall market size, the market was split into several segments and subsegments using the market size estimation processes explained above. Data triangulation and market breakdown procedures were employed to complete the entire market engineering process and determine each market segment’s and subsegment’s exact statistics. The data was triangulated by studying various factors and trends from the demand and supply sides in the radiation hardened electronics market.
Market Definition
Radiation hardening is the development of electronic components and systems resistant to destruction caused by ionizing radiation (particle radiation and high-energy electromagnetic radiation) occurring in outer space, high-altitude flights, around nuclear reactors, particle accelerators, during nuclear accidents, or nuclear warfare. Most semiconductor electronic components are susceptible to damage by radiation. Radiation-hardened components are based on hardened equivalents, with some design and manufacturing variations that reduce their susceptibility to damage by radiation. The ecosystem of the radiation hardened electronics market comprises manufacturers and distributors of radiation-hardened components. This market is competitive and diversified, with over 25 companies competing across its value chain to sustain their positions and increase their share. The market is expected to grow significantly in the coming years, owing to the increasing deployment of communication and military satellites in space.
Key Stakeholders
- Associations and Regulatory Authorities
- Government Bodies, Venture Capitalists, and Private Equity Firms
- Original Equipment Manufacturers (OEMs)
- Semiconductor Component Suppliers
- Radiation-hardened Equipment Distributors and Sales Firms
- Software Solution Providers
- Radiation-hardened Electronic Component and System Integrators
- Research Institutes and Organizations
Report Objectives
- To describe and forecast the size of the radiation hardened electronics market, by component, manufacturing technique, product type, and application, in terms of value
- To analyze the material selection and packaging types utilized in the market
- To describe and forecast the market size for various segments in four key regions, namely, North America, Europe, Asia Pacific, and RoW, in terms of value
- To provide detailed information regarding the key drivers, restraints, opportunities, and challenges influencing the growth of the radiation hardened electronics market
- To analyze micromarkets with respect to individual growth trends, prospects, and contribution to the total market
- To analyze the opportunities in the market for various stakeholders by identifying its high-growth segments
- To profile the key players and comprehensively analyze their ranking and core competencies, along with a detailed competitive landscape for market leaders
- To map competitive intelligence based on company profiles, key player strategies, and game-changing developments, such as product launches/developments, partnerships, collaborations, and acquisitions, undertaken in the market
- To understand and analyze the impact of the 2025 US tariff on the radiation hardened electronics market
- To understand and analyze the macroeconomic outlook for North America, Europe, Asia Pacific, and RoW regions
- To understand the impact of AI/Gen AI on radiation hardened electronics market
Available Customizations
With the given market data, MarketsandMarkets offers customizations according to the specific requirements of companies. The following customization options are available for the report:
- Detailed analysis and profiling of additional market players based on various blocks of the supply chain
Key Questions Addressed by the Report
What is the current market size of the radiation hardened electronics market?
The market is valued at approximately USD 1.77 billion in 2025 (with ~USD 1.69 billion in 2024).
What is the projected market size by 2030?
The market is expected to reach USD 2.30 billion by 2030.
What is the CAGR of the radiation hardened electronics market?
The market is projected to grow at a CAGR of 5.4% from 2025 to 2030.
What are the key growth drivers of this market?
Growth is driven by increasing satellite launches, ISR (intelligence, surveillance & reconnaissance) activities, and rising investments in defense and space technologies.
Which industries are major users of radiation hardened electronics?
Key industries include space (satellites), aerospace & defense, nuclear power plants, and medical applications.
What are the major market trends?
Trends include adoption of radiation-hardened-by-design (RHBD), increasing use of commercial-off-the-shelf (COTS) components, and development of advanced multicore processors.
Which region dominates the market?
North America holds the largest share, while Asia Pacific is the fastest-growing region due to expanding space programs and defense investments.
Who are the key companies in the market?
Major players include Microchip Technology Inc., BAE Systems, Renesas Electronics Corporation, Infineon Technologies AG, and STMicroelectronics.
What are the key opportunities in the market?
Opportunities include growth in commercial satellite deployment, deep-space exploration, nuclear energy systems, and adoption of cost-effective COTS solutions.
What does the report analysis cover?
The report covers market size, forecasts, segmentation (component, application, product), regional analysis, competitive landscape, and strategic developments across 285 pages and 233 tables.
Need a Tailored Report?
Customize this report to your needs
Get 10% FREE Customization
Customize This ReportPersonalize This Research
- Triangulate with your Own Data
- Get Data as per your Format and Definition
- Gain a Deeper Dive on a Specific Application, Geography, Customer or Competitor
- Any level of Personalization
Let Us Help You
- What are the Known and Unknown Adjacencies Impacting the Radiation Hardened Electronics Market
- What will your New Revenue Sources be?
- Who will be your Top Customer; what will make them switch?
- Defend your Market Share or Win Competitors
- Get a Scorecard for Target Partners

Custom Market Research Services
We Will Customise The Research For You, In Case The Report Listed Above Does Not Meet With Your Requirements
Get 10% Free CustomisationTESTIMONIALS

Tetsuya Ohhira
Business Development Manager-Technology Business
Nikon Corporation,
Leading Japanese MNC specializing in optics and imaging productswww.nikon.com
MarketsandMarkets™ response
is quick. Their attitude is flexible and positive. Analyst Insights are globally considered and
significant. Client Services quickly respond to our inquiry and demand. Their wide range of global
surveys help us make our strategic plan.
We hope Knowledge Store will be easier to search
for a report.
VP - Marketing & Business Development
Leading Provider of Process Control Solutions
We engaged with MarketsandMarkets on a study to perform an analysis and recommend a Go-To-Market strategy for metrology and process control in the semiconductor market. The study was tailored to our targets and needs with well-defined milestones. Our overall experience with the MarketsandMarkets team was very good throughout the project in all aspects including the analysis methodologies used, the quality and depth of primary and secondary data sets, the professionalism and flexibility of the team and the ability to meet the target schedule and milestones. We want to thank MarketsandMarkets team for a job well done.
Growth opportunities and latent adjacency in Radiation Hardened Electronics Market


Eric
Apr, 2026
Are emerging components such as MRAM and new FPGA/ASIC solutions analyzed for future growth potential?.
Zachary
Apr, 2026
What are the key emerging trends driving future growth (e.g., New Space programs, small satellites, nanosats, AI integration)?.
Sophia
Apr, 2026
Does the report provide ASP trends, pricing evolution, and margin impact for growth forecasting?.