
Silent Generator Market Size, Share, Growth, Analysis

Silent Generator Market by Sound Level (Super Silent, Silent), Fuel (Diesel, Natural Gas), Power Rating (Up to 25 kVA, 25�49 kVA, 50�99 kVA, 100�499 kVA, & Above 500 kVA), Phase, Type, Application, End User, and Region - Global Forecast to 2030


OVERVIEW
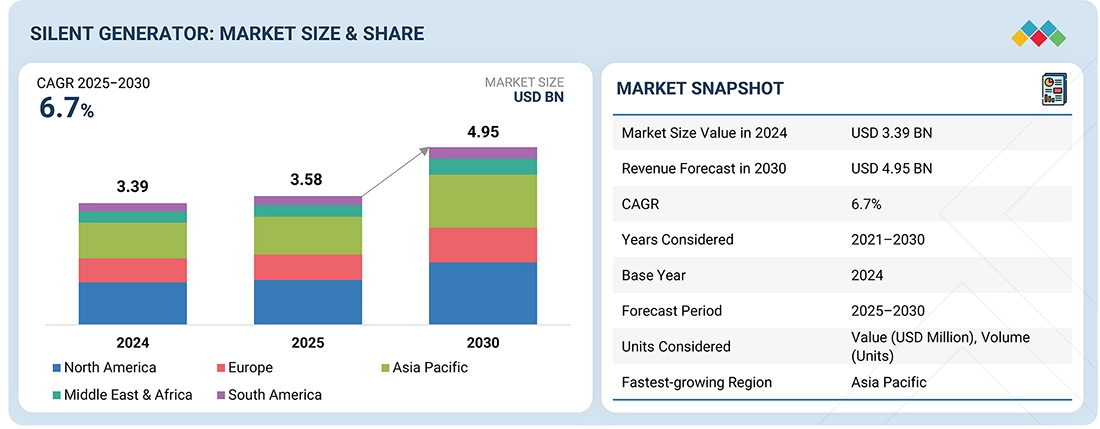
The global silent generator market is projected to reach USD 4.95 billion by 2030 from USD 3.58 billion in 2025, at CAGR of 6.7%, driven by trends in sustainability, digitalization, and urban energy resilience, creating new opportunities for manufacturers and end users. Increasing regulatory pressure to reduce emissions and noise levels is encouraging the adoption of hybrid and natural gas-powered generators, indicating a shift away from traditional diesel models.
MARKET SNAPSHOT TABLE
| REPORT METRIC | DETAILS |
|---|---|
| Market Size in 2024 (Value) | USD 3.39 Billion |
| Market Forecast in 2030 (value) | USD 4.95 Billion |
| Growth Rate | CAGR of 6.7% from 2025–2030 |
| Years Considered | 2021–2030 |
| Base Year | 2024 |
| Forecast Period | 2025–2030 |
| Units Considered | Value (USD Billion/Billion), Volume (Units) |
| Report Coverage | Revenue forecast, company ranking, competitive landscape, growth factors, and trends |
| Segments Covered |
|
| Regions Covered | North America, Europe, Asia-Pacific, Middle East & Africa, and South America |
Silent Generator Market Size and Forecast:
- Market Size Value in 2024: USD 3.39 Billion
- Market Size Value in 2025: USD 3.58 Billion
- Revenue Forecast in 2030: USD 4.95 Billion
- Growth Rate: CAGR of 6.7% from 2025 to 2030
- Data available from 2021 to 2030
Silent Generator Market Trends and Insights
- Market Growth: Silent Generator Market growth is driven by rising demand for reliable backup power, increasing urbanization, and stricter noise-control regulations.
-
Growing Trends: Adoption of fuel-efficient, low-noise generators with IoT-enabled remote monitoring and control is increasing across industries.
- Growth Opportunities: Rising trend of distributed power generation and electrification in developing countries are creating strong Silent Generator market opportunities.
- Market Share Analysis: The diesel generator segment holds the largest Silent Generator market share in 2025 due to its reliability and widespread use in backup power applications.
KEY TAKEAWAYS
-
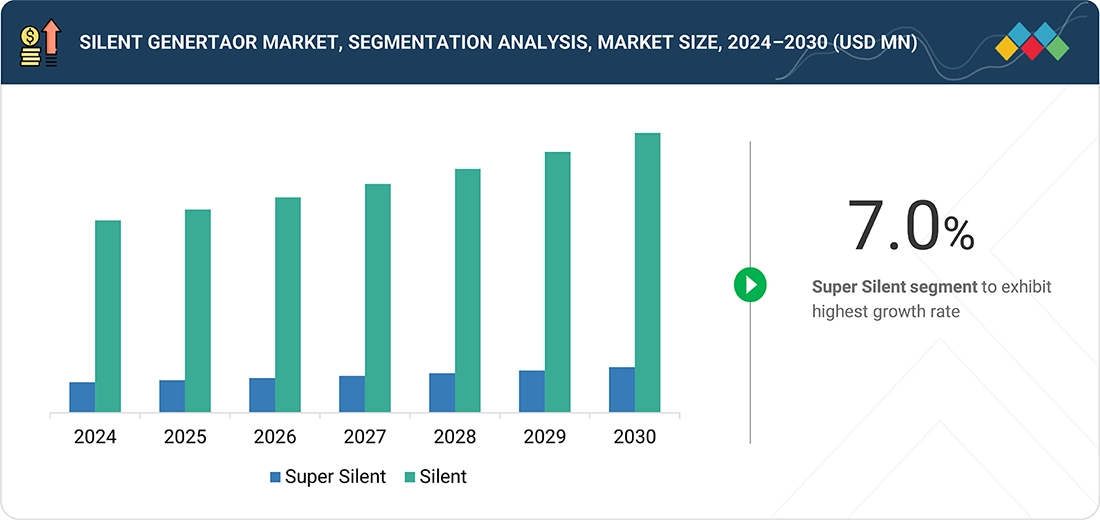
BY SOUND LEVELThe sound level segment includes super silent and silent. Increasing urbanization and stricter noise regulations are pushing demand for super silent generators in residential and healthcare facilities.
-
BY PHASEThe phase segment includes both three-phase and single-phase. Single-phase and three-phase generators share some similarities; both use alternating current (AC) to generate electricity and operate with power cycles. Single-phase generators produce one AC cycle, while three-phase generators produce three cycles simultaneously.
-
BY TYPEThe type category includes stationary and portable options. Portable generators are movable from one location to another; they are compact compared to traditional units and lightweight. These units can be easily stored in the trailer compartment or the back of a tow vehicle. Conversely, stationary generators are built for permanent installation.
-
BY POWER RATINGThe power rating segment includes up to 25 kVA, 25-49 kVA, 50-99 kVA, 100-499 kVA, and 500 kVA or more. Increasing demand for dependable backup power across residential, commercial, and industrial sectors is driving adoption in all power rating categories.
-
BY FUEL TYPEThe fuel type segment includes diesel, natural gas, and others. Diesel generators remain dominant due to their cost-effectiveness and reliability, while adoption of natural gas increases for cleaner emissions and sustainability.
-
BY APPLICATIONIncreasing grid instability and frequent outages drive the demand for standby, peak load, and prime mover generator applications.
-
BY END USERThe end user segment includes residential, commercial, and industrial sectors. The growth of the silent generators market in all these segments is driven by the increasing need for reliable power, expanding infrastructure development, and greater adoption of silent generators in urban and industrial settings.
-
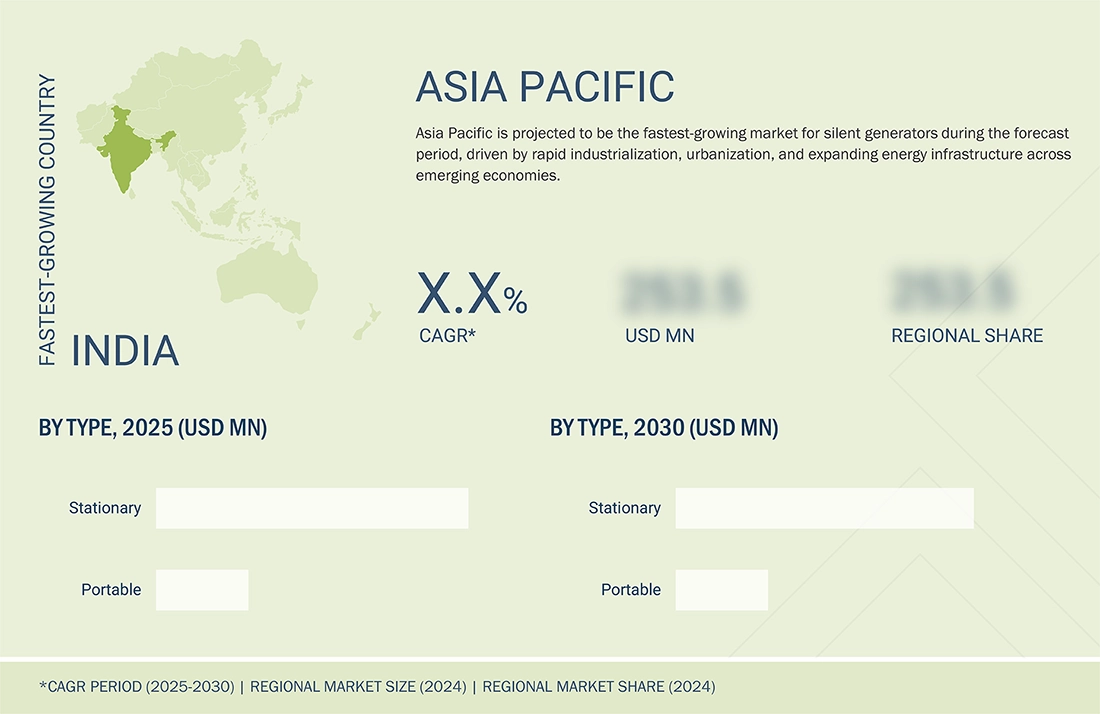
BY REGIONThe silent generator market includes Europe, North America, Asia Pacific, South America, the Middle East, and Africa. Asia Pacific is projected to grow the fastest during the forecast period, driven by rapid industrialization, urbanization, and expanding energy infrastructure across emerging economies.
-
COMPETITIVE LANDSCAPEThe major market players have adopted both organic and inorganic strategies, including partnerships and investments. For instance, Kirloskar, Generac, and Cummins Inc. have entered into a number of agreements, sales contracts, and product launches to cater to the growing demand for silent generators.
Advancements in IoT-enabled monitoring, automation, and remote control are reshaping customer expectations by offering smarter and more efficient power management solutions. Opportunities are particularly strong in residential and commercial sectors, where growing urbanization, the rise of smart homes, and the expansion of data centers and healthcare facilities are increasing demand for silent, reliable backup power. Moreover, the frequency of extreme weather events and aging grid infrastructure are driving new investments in backup power systems, making silent generators an essential component of sustainable and resilient energy strategies worldwide.
Source: Secondary Research, Interviews with Experts, MarketsandMarkets Analysis
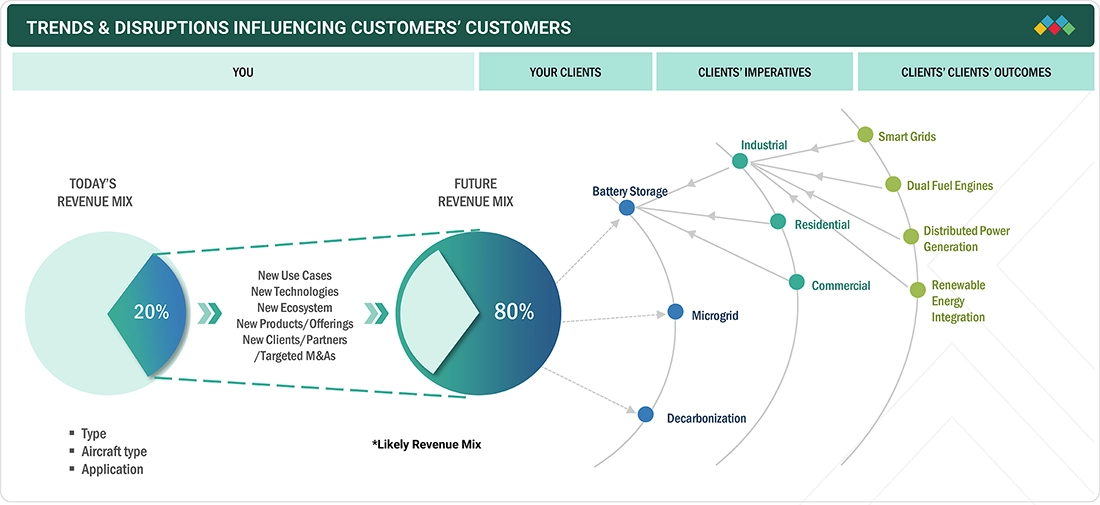
TRENDS & DISRUPTIONS IMPACTING CUSTOMERS' CUSTOMERS
Silent generators serve for standby, prime mover, and peak shaving applications. There are emerging competing technologies for each of these three uses. Industrial, commercial, and residential users of silent generators can now count on commercially viable battery energy storage for emergency backup. For peak shaving, large-scale active load management using smart electronic devices and intelligent energy management techniques is becoming more popular. Many large aggregators now offer demand-side management services on energy markets, especially in the UK. In North America and Europe, several new companies act as aggregators and sell services to utilities for large-scale peak shaving.
Source: Secondary Research, Interviews with Experts, MarketsandMarkets Analysis
MARKET DYNAMICS
Level
-
Increase in electricity demand and expanding manufacturing sector

-
Increasing instances of power outages due to aging grid infrastructure and extreme weather conditions.

Level
-
Rising adoption of energy storage technologies and renewable energy sources

-
Limited power generation capacity

Level
-
Electrification of rural areas in developing countries

-
Growing trend of distributed power generation

Level
-
Stringent government regulations

Source: Secondary Research, Interviews with Experts, MarketsandMarkets Analysis
Driver: Increase in electricity demand and expanding manufacturing sector
The expansion of the global manufacturing sector is emerging as a key driver for the adoption of power generation systems, especially silent generators. According to the International Energy Agency (IEA), global electricity demand increased by 4.3% in 2024, adding up to 1,080 TWh of consumption almost twice the average annual growth rate of the past decade. This significant rise highlights the growing energy needs of industrial clusters, where continuous and noise-compliant power solutions are becoming essential. Silent generators, designed to offer dependable backup while meeting strict noise and emission standards, are gaining popularity as industries expand their operations in both developed and emerging markets.
Restraint: Rising adoption of energy storage technologies and renewable energy sources
The increasing use of energy storage technologies and renewable energy sources is becoming a key factor shaping the silent generator market, as consumers are more frequently seeking integrated and sustainable backup power options. As solar and wind energy become more widespread, silent generators are often combined with battery storage systems to form hybrid setups that provide reliable power while lowering fuel use and emissions. This collaboration not only improves dependability during power outages but also supports global sustainability goals and stricter environmental standards. For residential and commercial customers, combining renewable energy with storage and silent generators offers an affordable and environmentally friendly alternative to traditional diesel backup systems. As the shift to cleaner energy continues, the market is opening up promising opportunities for innovation in hybrid and smart generator technologies, strengthening their role as a complementary part of clean energy adoption.
Opportunity: Electrification of rural areas in developing countries
Rural electrification is essential in developing countries to motivate youth and skilled workers. Many of these individuals reside in remote or rural areas where it is often too difficult or expensive to extend power using the traditional grid. The lack of access to this crucial resource has hindered economic development and is widely seen as a major factor in ongoing poverty in these regions. Therefore, energy generation methods that operate independently of the grid, such as diesel generators, LED lighting, and other microgrid solutions, must be adopted.
Challenge: Stringent government regulations
Diesel generators are used in many residential, commercial, and industrial settings. When diesel is burned, it releases oxides of nitrogen, carbon monoxide, and particulate matter. These pollutants go directly into the atmosphere, harming both the environment and people. Many regulations have been put in place worldwide to lower air and noise pollution from generator sets. As environmental concerns grow, each country has developed its own regulations and policies to cut down on air pollution.
Silent Generator Market: COMMERCIAL USE CASES ACROSS INDUSTRIES
| COMPANY | USE CASE DESCRIPTION | BENEFITS |
|---|---|---|
 |
Provided standby generator systems and integrated support for hyperscale/data-center clients, delivering resilient backup power and service coverage for 24/7 digital operations | Ensured uptime for critical IT loads, simplified maintenance/parts support, and enabled compliance with data-center resilience SLAs |
 |
Partnered with healthcare providers in Nigeria to deploy Kirloskar Green Silent Generators in hospitals and clinics, addressing unreliable and noisy power supply | Consistent, noise-free, and pollution-free power, Improved healthcare delivery and 24/7 service support across Nigeria |
 |
Honda launched the CO-MINDER system, an advanced carbon monoxide detection and auto-shutdown feature integrated into its Super Quiet Series silent generators | Prevents accidental carbon monoxide poisoning, automatic shutdown at 600 ppm or 400 ppm average over 10 minutes and enhanced safety across multiple generator models |
Logos and trademarks shown above are the property of their respective owners. Their use here is for informational and illustrative purposes only.
MARKET ECOSYSTEM
The silent generator market ecosystem is changing rapidly as part of the broader transition to digitalization. Key stakeholders in this ecosystem include raw material suppliers, silent generator manufacturers, component manufacturers, distributors, and end users. Prominent companies in this market include Cummins Inc. (US), Rolls-Royce plc (US), Atlas Colpco (Sweden), Generac Power Systems, Inc. (US), and Honda (Japan).
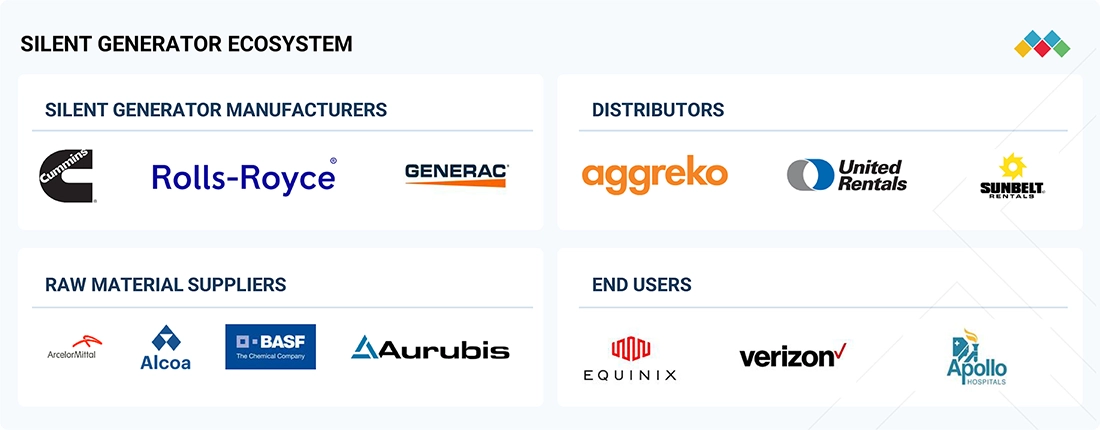
Logos and trademarks shown above are the property of their respective owners. Their use here is for informational and illustrative purposes only.
MARKET SEGMENTS
Source: Secondary Research, Interviews with Experts, MarketsandMarkets Analysis
Silent Generator Market, By Sound Level
In 2024, the super silent segment by sound level holds the largest market share due to increasing demand from noise-sensitive environments like hospitals, hotels, high-end residential complexes, data centers, and urban construction sites. Stricter municipal noise regulations in cities across Europe, North America, and parts of Asia are encouraging end users to adopt advanced acoustic solutions that significantly reduce sound levels compared to standard silent units.
Silent Generator Market, By Phase
In 2024, the three-phase generator segment held the largest market share because it is the preferred choice for industrial, commercial, and large-scale infrastructure applications that need higher power capacity and stable voltage. Unlike single-phase units, three-phase generators provide consistent power over long distances and can efficiently power heavy machinery, HVAC systems, data centers, and critical equipment in manufacturing plants.
Silent Generator Market, By Type
In 2024, the stationary generator segment held the largest market share due to its widespread use in long-duration and high-capacity applications, such as data centers, hospitals, commercial complexes, and industrial facilities. Stationary generators are permanently installed with soundproof enclosures, making them more reliable for continuous or standby power compared to portable units. Their ability to support large-scale, mission-critical operations with stable output makes them the preferred choice for end-users who cannot afford power interruptions.
Silent Generator Market, By Fuel Type
In 2024, the diesel generator segment held the largest market share due to its proven reliability, fuel availability, and cost-effectiveness across various applications. Diesel engines can produce high power output over long periods, making them the preferred choice for industrial facilities, construction projects, and large commercial complexes where continuous or emergency backup power is essential. Their durability, ease of maintenance, and extensive global fuel distribution networks further boost adoption, especially in developing regions where natural gas infrastructure is limited.
Silent Generator Market, By Application
In 2024, the standby and peak application segment held the largest market share as businesses, institutions, and households increasingly depend on backup power to protect against grid instability, blackouts, and peak load demands. The rising frequency of extreme weather events and aging power infrastructure in regions like North America and Europe has increased the need for reliable standby systems. At the same time, data centers, hospitals, airports, and manufacturing facilities prioritize continuous operation, driving demand for silent generators that can activate instantly during outages. For many commercial and residential users, standby generators also provide peace of mind by ensuring uninterrupted power for critical functions. This combination of resilience, regulatory compliance, and operational continuity makes standby and peak use the dominant application segment in 2024.
Silent Generator Market, By End User
In 2024, the residential end-user segment holds the largest market share due to the rising need for uninterrupted and quiet power solutions at homes, especially in urban and suburban areas. Increasing electricity demand, frequent local grid outages, and the adoption of home automation systems have encouraged homeowners to invest in silent generators that provide continuous power without disrupting the household environment.
REGION
Asia Pacific to be fastest-growing region in global silent generator market during forecast period
Asia Pacific is expected to be the fastest-growing market for silent generators during the forecast period, driven by rapid industrialization, urbanization, and expanding energy infrastructure across emerging economies. A key driver of this growth in the region is the surge in data center investments in countries such as India, China, and Japan, where uninterrupted and noise-free backup power is essential for supporting cloud computing and digital transformation. Additionally, the region’s increasing focus on smart cities and green building initiatives is creating strong demand for low-emission and silent power solutions that align with sustainability goals. Frequent natural disasters, such as typhoons, earthquakes, and floods, are also encouraging governments and businesses to bolster emergency backup power capabilities. Furthermore, the growing adoption of natural gas and hybrid generator technologies in densely populated urban centers indicates a shift toward cleaner and quieter alternatives to diesel. Collectively, these factors position Asia Pacific as the most dynamic growth hub for the silent generator market worldwide.
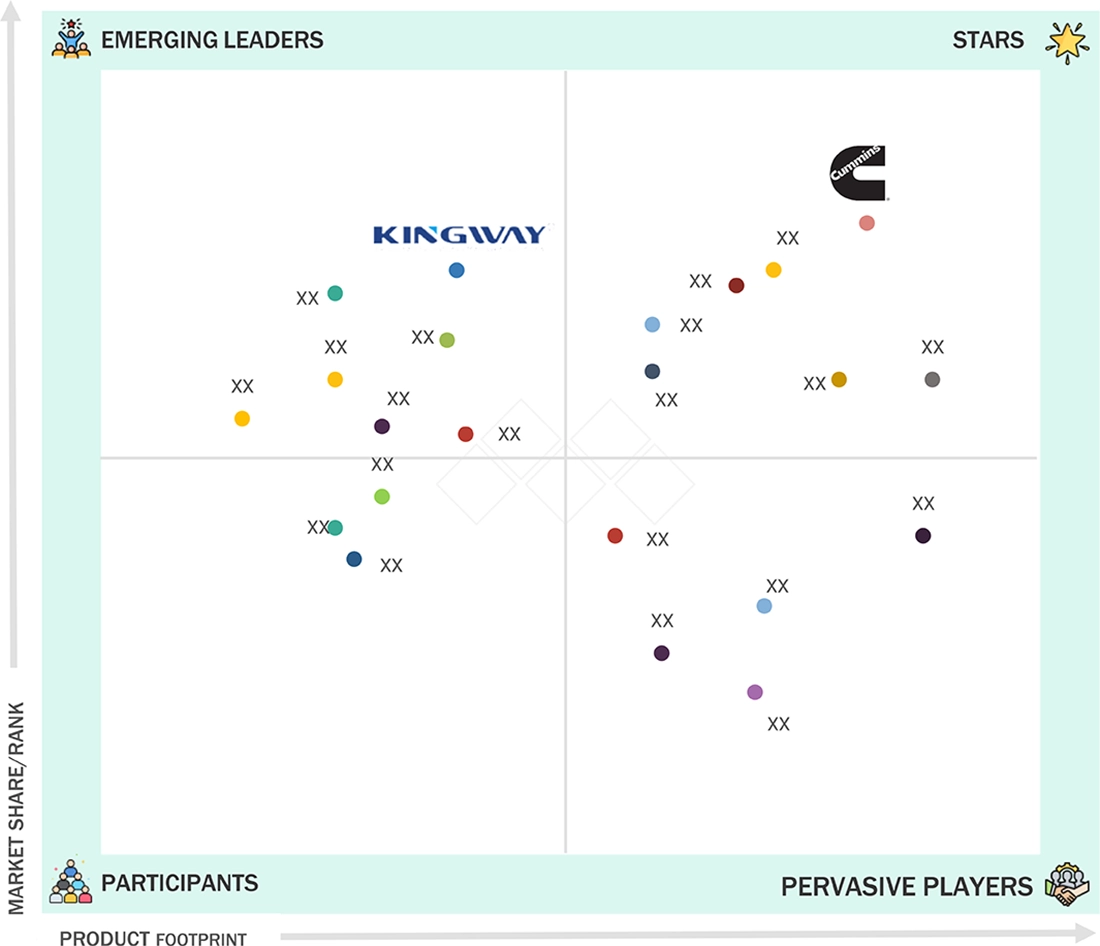
Silent Generator Market: COMPANY EVALUATION MATRIX
In the silent generator market matrix, Cummins Inc. (Star) leads with a strong market presence and a wide product portfolio. QINGDAO KINGWAY INDUSTRY (Emerging Leader) is gaining traction as it is expanding globally.
Source: Secondary Research, Interviews with Experts, MarketsandMarkets Analysis
KEY MARKET PLAYERS
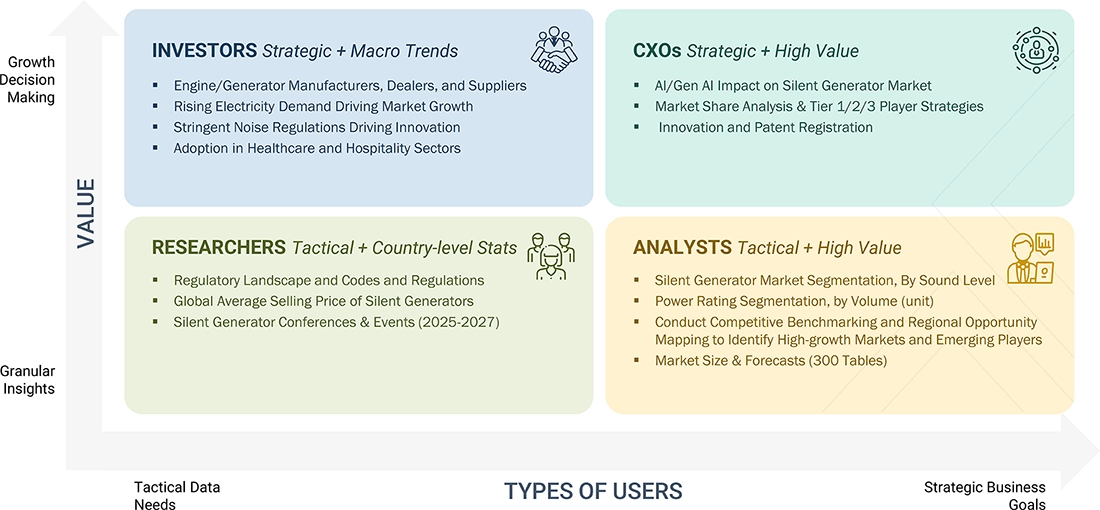
WHAT IS IN IT FOR YOU: Silent Generator Market REPORT CONTENT GUIDE
DELIVERED CUSTOMIZATIONS
We have successfully delivered the following deep-dive customizations:
| CLIENT REQUEST | CUSTOMIZATION DELIVERED | VALUE ADDS |
|---|---|---|
| Power Backup Solutions Provider | Competitive landscape analysis with focus on strategic moves by key players (e.g., Cummins, Generac, Kirloskar) |
|
RECENT DEVELOPMENTS
- April 2025 : Kirloskar Oil Engines Limited has unveiled the Optiprime Dual Core 1000 kVA generator, the world’s smallest in its class, at the Middle East Energy Exhibition, targeting industrial and commercial use with compact, sustainable design. The company also launched the Sentinel Series for homes and small businesses, reinforcing its focus on energy-efficient, eco-friendly power solutions.
- August 2024 : Rolls-Royce plc sold its lower power range engines business, including mtu Classic and series 1000–1500 engines, to Deutz AG for a high double-digit million-euro amount. The move aligns with Rolls-Royce’s strategic shift, while Deutz enhances its position in agriculture and construction engine markets.
- July 2024 : Generac Power Systems received up to USD 200 million from the U.S. Department of Energy through the Puerto Rico Energy Resilience Fund to install residential solar and battery storage systems for disadvantaged households. The program, starting in August 2024, aims to deliver clean, resilient power to low-income areas and homes with energy-dependent residents.
- July 2023 : Kirloskar Oil Engines launched a Retrofit Emission Control Device (RECD) for its diesel generators ranging from 125 kVA to 1000 kVA. The innovation aims to address increasing concerns over air pollution by reducing harmful emissions and their effects on the environment and public health.
- January 2021 : Cummins Inc. (US) introduced the QG 2800i and 2500i, RV inverter-based generators that are 60% quieter. They operate on gasoline and liquid propane (LP). The Onan QG 2800i and 2500i are 2.8kW and 2.5kW inverter generators designed mainly for Class B and truck campers.
Table of Contents
 Exclusive indicates content/data unique to MarketsandMarkets and not available with any competitors.
Methodology
This study involved major activities in estimating the current size of the silent generator market. Comprehensive secondary research was done to collect information on the market, peer, and parent markets. The next step involved validating these findings, assumptions, and market sizing with industry experts across the value chain through primary research. The total market size was estimated through country-wise analysis. Then, the market breakdown and data triangulation were performed to estimate the market size of the segments and subsegments.
Secondary Research
Secondary sources referred to for this research study include annual reports, press releases, investor presentations of companies, white papers, certified publications, articles from recognized authors, and databases of various companies and associations. Secondary research was mainly carried out to obtain key information about the industry's supply chain to identify the key players offering various products and services, market classification and segmentation according to the offerings of major players, industry trends to the bottom-most level, regional markets, and key developments from market- and technology-oriented perspectives.
Primary Research
In the primary research process, various primary sources from the supply and demand sides were interviewed to obtain qualitative and quantitative information for this report. Primary sources from the supply side included industry experts, such as chief executive officers (CEO), vice presidents, marketing directors, technology and innovation directors, and related key executives from various companies and organizations operating in the silent generator market. Various primary sources from both the supply and demand sides of the market were interviewed to obtain qualitative and quantitative information. The breakdown of primary respondents is given below:

Notes: "Others" includes sales managers, engineers, and regional managers.
The tiers of the companies are defined based on their total revenue as of 2024; Tier 1: >USD 1 billion,
Tier 2: USD 500 million–1 billion, and Tier 3:
To know about the assumptions considered for the study, download the pdf brochure
Market Size Estimation
Both top-down and bottom-up approaches were used to estimate and validate the total size of the silent generator market. These methods were also used extensively to estimate the size of various subsegments in the market. The research methodology used to estimate the market size includes the following:
- The key players in the industry and market were identified through extensive secondary research, and their market share was determined through primary and secondary research.
- The industry's value chain and market size, in terms of value, were determined through both primary and secondary research processes.
- All percentage shares, splits, and breakdowns were determined using secondary sources and verified through primary sources.
Silent Generator Market : Top-Down and Bottom-Up Approach

Data Triangulation
After arriving at the overall market size from the estimation process explained above, the total market was split into several segments and subsegments. Data triangulation and market breakdown processes were employed to complete the overall market engineering process and arrive at the exact statistics for all the segments and subsegments, wherever applicable. The data was triangulated by studying various factors and trends from both the demand and supply sides. Along with this, the market was validated using the top-down and bottom-up approaches.
Market Definition
The silent generator refers to the segment of the power generation industry that focuses on designing, manufacturing, and deploying low-noise and super-silent generators for residential, commercial, and industrial applications. Unlike conventional generators, silent generators are engineered with advanced acoustic enclosures, vibration dampers, and noise control technologies to operate within stringent noise regulations, particularly in urban and densely populated environments. They are powered by fuels such as diesel, natural gas, and hybrid energy sources, offering reliable backup power solutions during grid outages, peak load requirements, or in areas with limited access to electricity.
The market encompasses a broad ecosystem that includes component suppliers, generator manufacturers, distributors, and end users across sectors such as healthcare, data centers, hospitality, manufacturing, and residential households. Growth in this market is primarily driven by increasing urbanization, rising demand for uninterrupted power supply, and regulatory mandates for noise and emission control. Furthermore, advancements in hybrid and natural gas-based technologies, integration of digital monitoring systems, and the growing adoption of energy-efficient designs are reshaping the industry. As a result, silent generators are positioned not only as a backup solution but also as a critical enabler of sustainable and resilient energy systems globally.
Stakeholders
- Consulting companies in the energy and power sector
- Engine/generator manufacturers, dealers, and suppliers
- Investment banks
- Petroleum companies (diesel and natural gas suppliers)
- Power grid infrastructure companies
- Power plant project developers
- Power rental companies
- Renewable energy companies
- Government and research organizations
Report Objectives
- To define and describe the global silent generator market based on sound level, phase, type, power rating, fuel, application, end user, and region, in terms of value
- To provide market size by power rating in terms of volume
- To provide detailed information on the major factors influencing the growth of the global silent generators market (drivers, restraints, opportunities, and challenges)
- To strategically analyze the global silent generators market with respect to individual growth trends, prospects, and contributions of each segment to the market
- To analyze market opportunities for stakeholders and provide a detailed competitive landscape for market leaders
- To forecast the revenue of the market segments with respect to five main regions (along with countries)—North America, South America, Europe, Asia Pacific, and the Middle East & Africa
- To strategically profile key players and comprehensively analyze their market rankings and core competencies
- To track and analyze competitive developments in the global silent generators market, such as product launches, contracts and agreements, investments and expansions, and mergers and acquisitions
Available Customizations
With the given market data, MarketsandMarkets offers customizations based on the company's specific needs. The following customization options are available for the report:
Product Analysis
- Product Matrix, which provides a detailed comparison of the product portfolio of each company
Geographic Analysis as per Feasibility
- Further breakdown of the silent generator market by country
Company Information
- Detailed analyses and profiling of additional market players
Key Questions Addressed by the Report
What was the size of the silent generator market in 2025?
The size of the global silent generator market was USD 3.58 billion in 2025.
What are the major drivers for the silent generator market?
The increase in electricity demand and the expanding manufacturing sector are the major drivers of the market.
Which is the largest silent generator market during the forecast period?
The Asia Pacific region is estimated to be the largest market during the forecast period.
By type, which is the fastest-growing segment in the silent generator market during the forecast period?
The portable segment is estimated to be the fastest-growing segment during the forecast period.
What are the restraints for the silent generator market?
Rising adoption of energy storage technologies and renewable energy sources is a major restraint to the growth of the silent generator market.
Need a Tailored Report?
Customize this report to your needs
Get 10% FREE Customization
Customize This ReportPersonalize This Research
- Triangulate with your Own Data
- Get Data as per your Format and Definition
- Gain a Deeper Dive on a Specific Application, Geography, Customer or Competitor
- Any level of Personalization
Let Us Help You
- What are the Known and Unknown Adjacencies Impacting the Silent Generator Market
- What will your New Revenue Sources be?
- Who will be your Top Customer; what will make them switch?
- Defend your Market Share or Win Competitors
- Get a Scorecard for Target Partners

Custom Market Research Services
We Will Customise The Research For You, In Case The Report Listed Above Does Not Meet With Your Requirements
Get 10% Free CustomisationTESTIMONIALS

Kimberly Murphy
GLOBAL MARKETING DIRECTOR
Bently Nevada,
Leading Condition Monitoring & Asset Protectionwww.bakerhughesds.com/bently-nevada

MarketsandMarkets™ showed consistent rigor for success and relentlessly worked with Bently Nevada stakeholders to positively impact go-to-market strategy. Their proactiveness and flexibility has been instrumental in achieving the objectives to grow our sales pipeline in key industrial markets.

DARRICK HUEBER
Business Development Leader
Nexus Controls LLC,
Leading Manufacturer of Automation System & Electrical Panelswww.bakerhughesds.com/nexus-controls

We partnered with MarketsandMarkets to expand our business further by tapping into new industrial segments. It was critical for us to gather crucial business insights about specific markets to achieve this goal. MarketsandMarkets engagement model and client services helped us provide those insights, it was really impressive and valuable for my business. The team was extremely flexible and helpful.

Mike Schoff
Global Industrial Commercial Strategy Leader
Nexus Controls LLC
Leading Manufacturer of Automation System & Electrical Panelswww.bakerhughesds.com/nexus-controls
We consulted MarketsandMarkets for potential Partner Identification. Overall, it was a good experience. The insights provided through interviews conducted by the team helped us put together the questionnaire required for discussion with the selected partners. Their ability to provide insights through interviews with customers in a timely manner was quite impressive.
Growth opportunities and latent adjacency in Silent Generator Market


George
Jun, 2022
I need more details on how global key players are dominating the Silent Generator Market..