
Solid State Relay Market Size, Share & Trends

Solid State Relay Market Size, Share & Trends by Type (Reed Relay, Transformer-coupled, Optocoupled, Magnetic), Current Rating [Low (0-20A), Medium (20A to 50A), High (Above 50A)], Output Voltage (AC, DC, AC/DC), Mounting (Panel, PCB, DIN RAIL) - Global Forecast to 2030


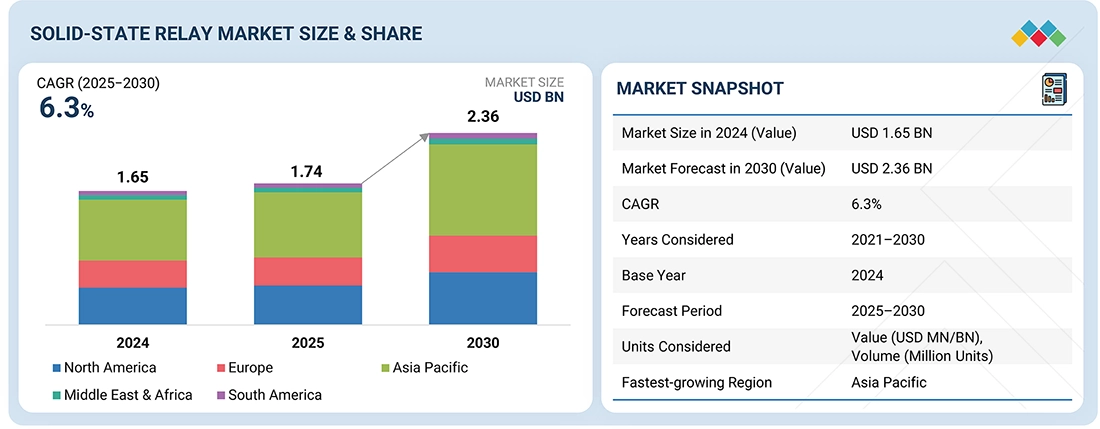
SOLID-STATE RELAY MARKET SIZE, SHARE & TRENDS
According to Marketsandmarkets, The solid-state relay market size was valued at USD 1.74 billion in 2025 and is projected to reach USD 2.36 billion by 2030, growing at a CAGR of 6.3% from 2025 to 2030. The solid state relay (SSR) market is driven by increasing demand for reliable, efficient, and maintenance-free switching solutions across applications such as industrial automation, OEMs, automotive, energy, and so on. SSRs offer longer lifespan, faster switching speeds, and resistance to shock and vibration, making them ideal for automation, industrial machinery, and building equipment. Growth in electric vehicles (EVs), renewable energy integration, and smart grids is fueling the adoption of SSRs for high-current switching, temperature control, and inverter applications.
MARKET SNAPSHOT TABLE
| REPORT METRIC | DETAILS |
|---|---|
| Market Size in 2025 (Value) | USD 1.74 Billion |
| Market Forecast in 2030 (Value) | USD 2.36 Billion |
| Growth Rate | CAGR of 6.3% from 2025 to 2030 |
| Years Considered | 2021–2030 |
| Base Year | 2024 |
| Forecast Period | 2025–2030 |
| Units Considered | Value (USD MN/BN), Volume (Million Units) |
| Report Coverage | Revenue forecast, company ranking, competitive landscape, growth factors, and trends |
| Top Companies |
|
| Growth Driver |
|
| Segments Covered |
|
| Regional Scope | North America, Asia Pacific, Europe, the Middle East, Africa, and South America |
Market Size & Forecast
• 2025 Market Size: USD 1.74 Billion
• 2030 Projected Market Size: USD 2.36 Billion
• CAGR (2025-2030): 6.3%
• Opto-coupled solid-state relays: Fastest CAGR
• Asia Pacific: Growing Market Region
KEY TAKEAWAYS
-
BY TYPEThe solid-state relay market share comprises reed-relay coupled SSR, transformer-coupled SSR, opto-coupled SSR, and other types, wherein opto-coupled are expected to dominate the market due to their higher switching capabilities, fast response time, compact size, and compatibility with low-power control signals, making them ideal for automation and precision applications.
-
BY CURRENT RATINGThe solid-state relay (SSR) market is segmented by current rating into low (0–20A) for light-load applications, medium (20–50A) for moderate industrial and HVAC uses, and high (50A & above) for heavy-duty industrial, power, and renewable energy systems.
-
BY OUTPUT VOLTAGEThe solid-state relay (SSR) market is segmented by output voltage into AC SSR for switching alternating current loads, DC SSR for direct current applications, and AC/DC SSR for versatile systems handling both current types.
-
BY MOUNTING TYPEThe solid-state relay (SSR) market is segmented by mounting type into panel mount for heavy industrial machinery and power control, PCB mount for compact electronic devices and consumer appliances, DIN-rail mount for automation systems and control panels, and others for customized or specialized applications.
-
BY APPLICATIONThe solid-state relay (SSR) market is segmented by application into industrial automation for process control and robotics, building equipment for HVAC and lighting, industrial OEMs for machinery integration, automotive for EVs and electronics, and energy & infrastructure for renewable systems and smart grids.
-
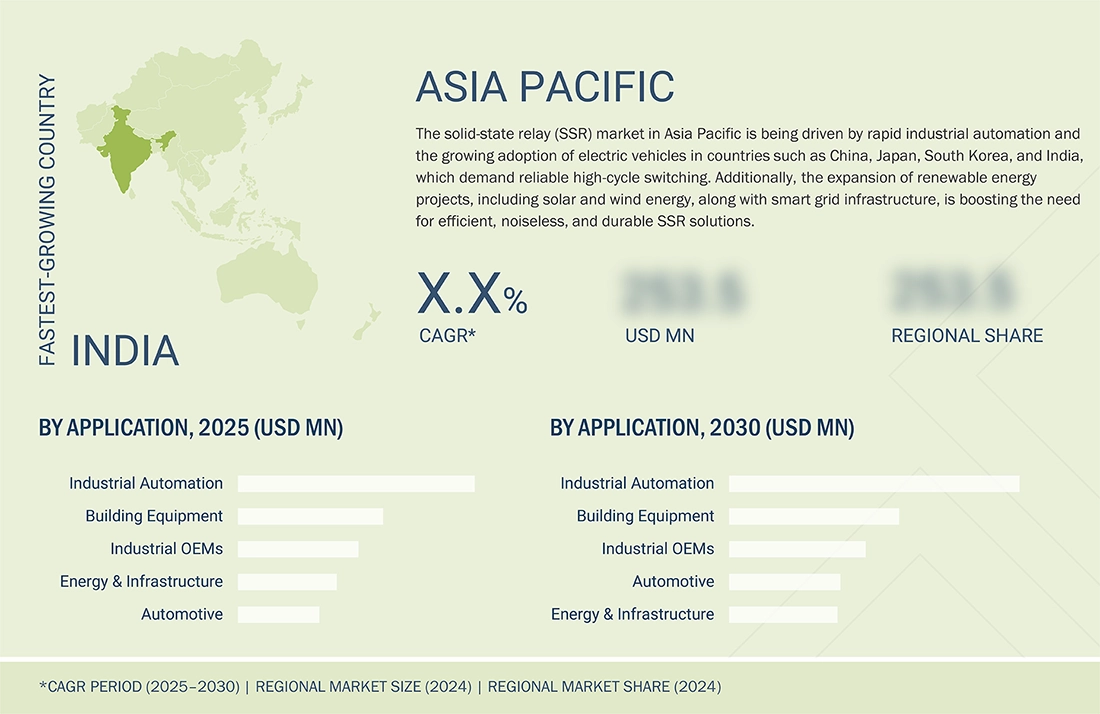
BY REGIONThe solid-state relay (SSR) market in Asia Pacific is being driven by rapid industrial automation and the growing adoption of electric vehicles in countries such as China, Japan, South Korea, and India, which demand reliable high-cycle switching.
-
COMPETITIVE LANDSCAPEThe major market players have adopted organic and inorganic strategies, including product launches, partnerships, and investments.
The solid-state relay industry is projected to be valued at USD 1.74 billion in 2025 and reach USD 2.36 billion by 2030, growing at a CAGR of 6.3% during the same period. Rising focus on energy efficiency and compact electronic designs supports their demand. SSRs play a critical role in medical devices, food & beverage processing, and HVAC systems, where noise-free, precise operation is essential. The expansion of industrial automation, coupled with digitalization and Industry 4.0, accelerates usage in programmable logic controllers (PLCs), robotics, and communication systems.
Source: Secondary Research, Interviews with Experts, MarketsandMarkets Analysis
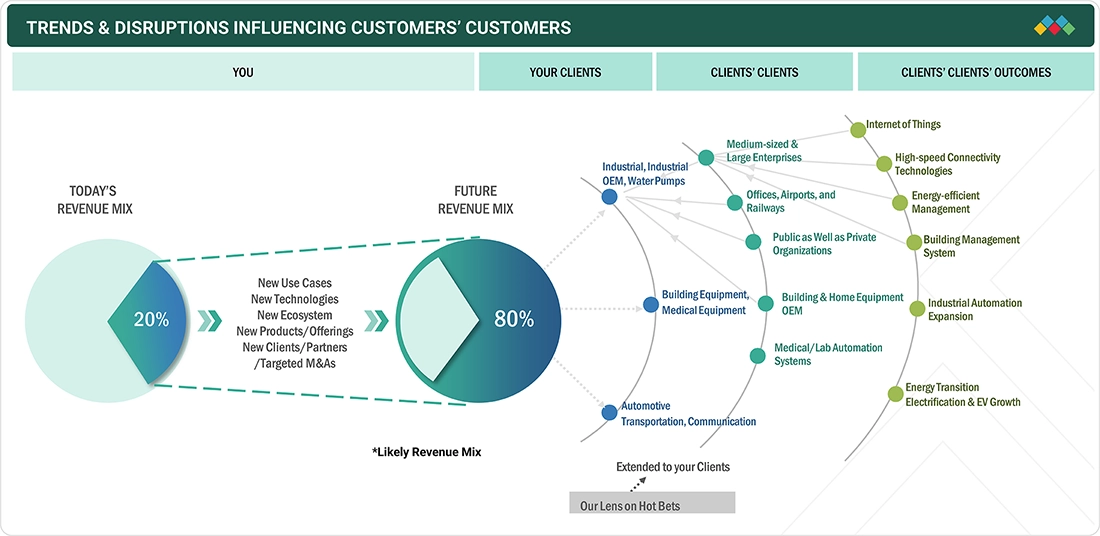
TRENDS & DISRUPTIONS IMPACTING CUSTOMERS' CUSTOMERS
The solid-state relay market trends is undergoing a significant transformation, with trends and disruptions directly impacting client revenue channels across industries. One key trend is the shift toward industrial automation and Industry 4.0, where manufacturers increasingly deploy SSRs for precision, high-speed switching, and maintenance-free operations. This creates new revenue opportunities for SSR suppliers catering to smart factories, robotics, and process automation systems.
Source: Secondary Research, Interviews with Experts, MarketsandMarkets Analysis
MARKET DYNAMICS
Level
-
Longer operational lifespan

-
Rapid switching capabilities

Level
-
High initial cost of SSRs

-
Significant heat generation and additional thermal management

Level
-
Adoption of protected SSRs in automotive sector

-
Increasing adoption of compact high-voltage SSRs in HVAC and industrial markets

Level
-
Leakage current in “off” state

-
Challenges in achieving broad compatibility with diverse load types

Source: Secondary Research, Interviews with Experts, MarketsandMarkets Analysis
Driver: Rapid switching capabilities
Solid-state relays (SSRs) are increasingly used in industrial automation and process control systems due to their rapid switching capabilities. Unlike electromechanical relays, SSRs can switch on and off in milliseconds or microseconds, enabling precise control over fast-changing processes. This responsiveness is critical in applications such as packaging machinery, robotic systems, and high-speed conveyor lines, where timing precision and minimal signal delay directly impact productivity and product quality. For instance, in June 2025, Bore Automation Tech. Co., Ltd. (Finland) launched its latest Solid-State Relay (SSR) Module at Booth J1130, offering stable, efficient, and vibration-resistant switching for industrial automation.
Restraint: High initial cost of SSRs
The high initial cost of solid-state relays (SSRs) remains a significant restraint in markets where affordability outweighs performance benefits. Compared to electromechanical relays, SSRs often require advanced semiconductor components and manufacturing processes, which increase unit prices. In industries where margins are tight or in developing economies with cost-sensitive buyers, this cost difference discourages large-scale adoption. Small and medium-sized enterprises, particularly in sectors such as consumer electronics and low-volume industrial equipment, often prioritize immediate cost savings over long-term reliability.
Opportunity: Adoption of protected SSRs in automotive systems
The increasing adoption of protected solid-state relays (SSRs) presents a significant opportunity in the automotive sector. Protected SSRs, designed with built-in safeguards against overload, overvoltage, and thermal stress, enhance reliability and system safety in modern vehicle architectures.
Challenge: Leakage current in “off” state
Leakage current in the “off” state presents a persistent challenge for SSR adoption, particularly in sensitive or precision-driven applications. Unlike electromechanical relays that provide complete electrical isolation when switched off, SSRs—due to their semiconductor-based design—allow a small but continuous leakage current to pass through even in the off condition.
Solid State Relay Market: COMMERCIAL USE CASES ACROSS INDUSTRIES
| COMPANY | USE CASE DESCRIPTION | BENEFITS |
|---|---|---|
 |
High current SSR for industrial automation, automotive, industrial OEM, etc. | High-reliability components | Wide product portfolio for industrial and transportation | Robust global supply chain |
 |
Reliable SSRs for HVAC, medical devices, and industrial automation where silent, long-life switching is critical | Broad integration of SSRs into power management and automation solutions | Strong presence in industrial OEMs and infrastructure | Global customer base |
 |
PCB-mount SSRs for signal isolation, instrumentation, and low-to-medium power electronic switching | Optocoupler-based SSR technology | Strong R&D in communications and industrial applications | Solid IP portfolio |
 |
Advanced SSRs for industrial automation, high-voltage distribution, and rad-hard space/aerospace systems | Advanced semiconductor expertise driving energy-efficient SSRs | Strong foothold in automotive and power electronics | Wide global presence |
 |
Compact SSRs for home appliances, heating control, and renewable energy systems like solar inverters | Well-established global brand | Diverse SSR offerings for automation, building equipment, and automotive | Strong base in Asia Pacific |
Logos and trademarks shown above are the property of their respective owners. Their use here is for informational and illustrative purposes only.
MARKET ECOSYSTEM
The solid-state relay (SSR) ecosystem comprises a network of component suppliers, manufacturers, integrators, and end users across multiple industries. At its core are semiconductor companies producing key materials like thyristors, triacs, MOSFETs, and IGBTs, which enable switching functionality. Relay manufacturers integrate these components with optocouplers, heat sinks, and protective circuits to deliver tailored solutions across AC, DC, and hybrid categories. Distributors and channel partners play a crucial role in making SSRs accessible to global markets, while system integrators and OEMs embed them into automation equipment, HVAC systems, medical devices, EV powertrains, and renewable energy inverters.
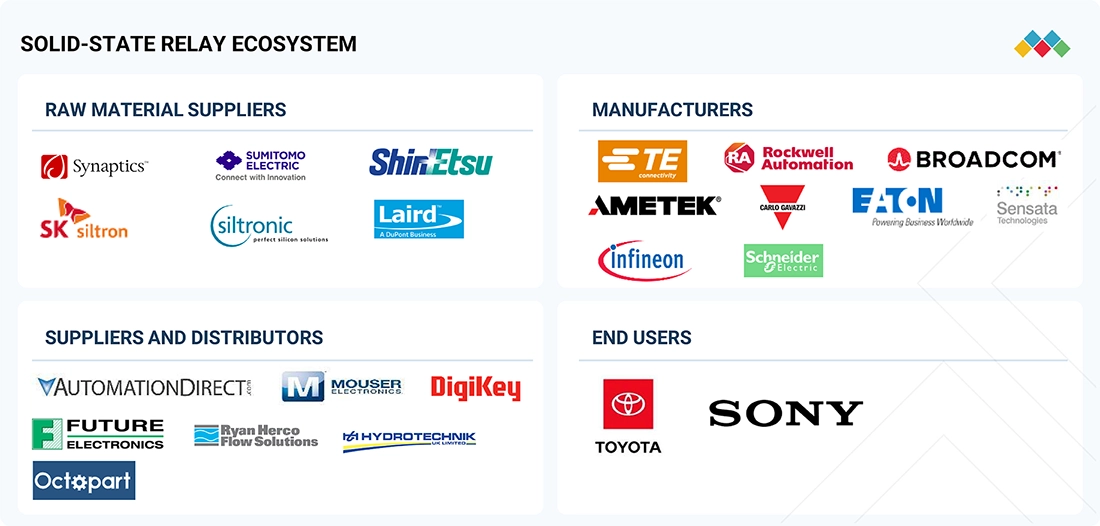
Logos and trademarks shown above are the property of their respective owners. Their use here is for informational and illustrative purposes only.
MARKET SEGMENTS
Source: Secondary Research, Interviews with Experts, MarketsandMarkets Analysis
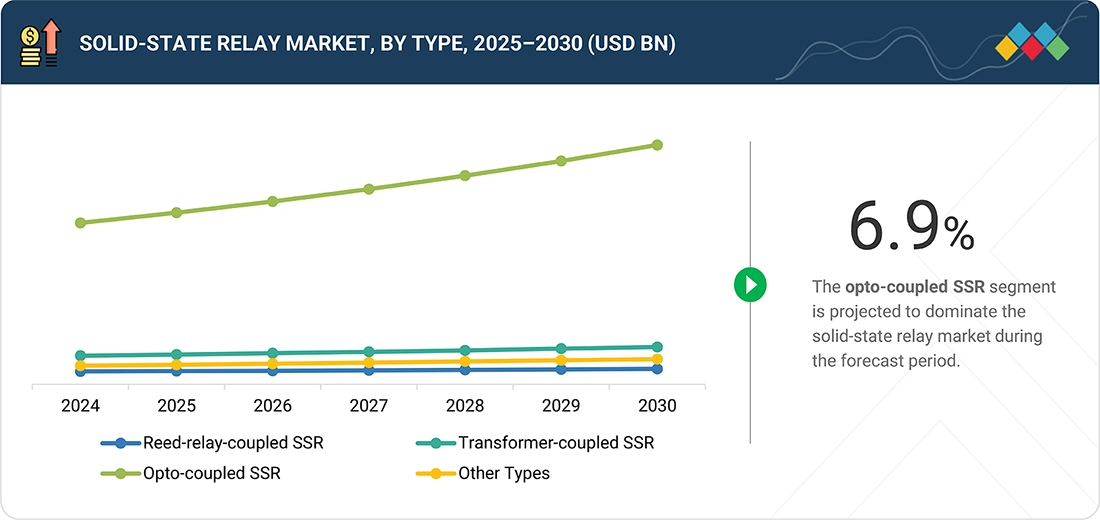
Solid-state Relay Market, By Type
Opto-coupled solid-state relays (SSRs) are projected to grow at the fastest CAGR during the forecast period due to their superior isolation, reliability, and safety features, making them highly suited for next-generation industrial and electronic applications. These relays use optical coupling between input and output stages, ensuring galvanic isolation that protects sensitive control circuits from high voltages, surges, or noise in power circuits. The rising adoption of industrial automation, robotics, and smart manufacturing under Industry 4.0 fuels demand for high-performance relays capable of precise, high-speed switching with minimal interference.
Solid-state Relay Market, By Mounting
Panel-mount solid-state relays (SSRs) are expected to contribute the major share of the market during the forecast period due to their versatility, robust performance, and widespread adoption across industrial and commercial applications. These relays are designed for easy installation directly onto control panels, which makes them highly suitable for large-scale automation systems, HVAC equipment, motor drives, and power distribution setups. Their higher current and voltage handling capacity than PCB-mounted variants enables them to serve demanding operations such as heating control, industrial machinery, and renewable energy inverters.
Solid-state Relay Market, By Current Rating
The medium current rating segment is projected to hold a significant share of the solid-state relay (SSR) market during the forecast period. This segment’s dominance is attributed to its optimal balance between cost and performance, making it ideal for industrial automation, HVAC systems, and commercial appliances where moderate load control is essential. Medium current SSRs are favored for their reliability, compactness, and energy efficiency, supporting the growing demand for automation and smart manufacturing systems worldwide. Their adaptability across varied industrial applications ensures continued market leadership within the overall SSR landscape.
Solid-state Relay Market, By Voltage
The AC output voltage segment is expected to hold a significant share in the global solid-state relay (SSR) market due to its wide applicability across industrial, commercial, and residential sectors. AC output SSRs are extensively used for switching alternating current loads such as motors, compressors, lighting systems, and heating elements in industries like HVAC, manufacturing, and building automation. Their arc-free switching, long service life, and ability to handle high loads efficiently make them highly reliable for continuous operations. Growing automation, smart infrastructure development, and renewable energy integration further strengthen this segment’s market dominance.
Solid-state Relay Market, By Application
The automotive segment is set to hold a significant share in the solid-state relay market, fueled by the global shift towards vehicle electrification, advanced driver-assistance systems, and digitalization. The rising adoption of electric and hybrid vehicles, alongside the demand for reliable and efficient control systems, drives strong growth for SSRs in automotive applications. Solid-state relays are favored for their durability, fast switching, and enhanced safety over traditional relays, making them essential for modern automotive electronics, safety systems, and connected car technologies. The Asia Pacific region will lead, supported by robust automotive industry expansion.
REGION
Asia Pacific to be the fastest-growing region in the global solid-state relay market during the forecast period.
The solid-state relay (SSR) market growth in Asia Pacific is driven by rapid industrial automation and the growing adoption of electric vehicles in countries such as China, Japan, South Korea, and India, which demand reliable high-cycle switching. Additionally, the expansion of renewable energy projects, including solar and wind energy, along with smart grid infrastructure, is boosting the need for efficient, noiseless, and durable SSR solutions.
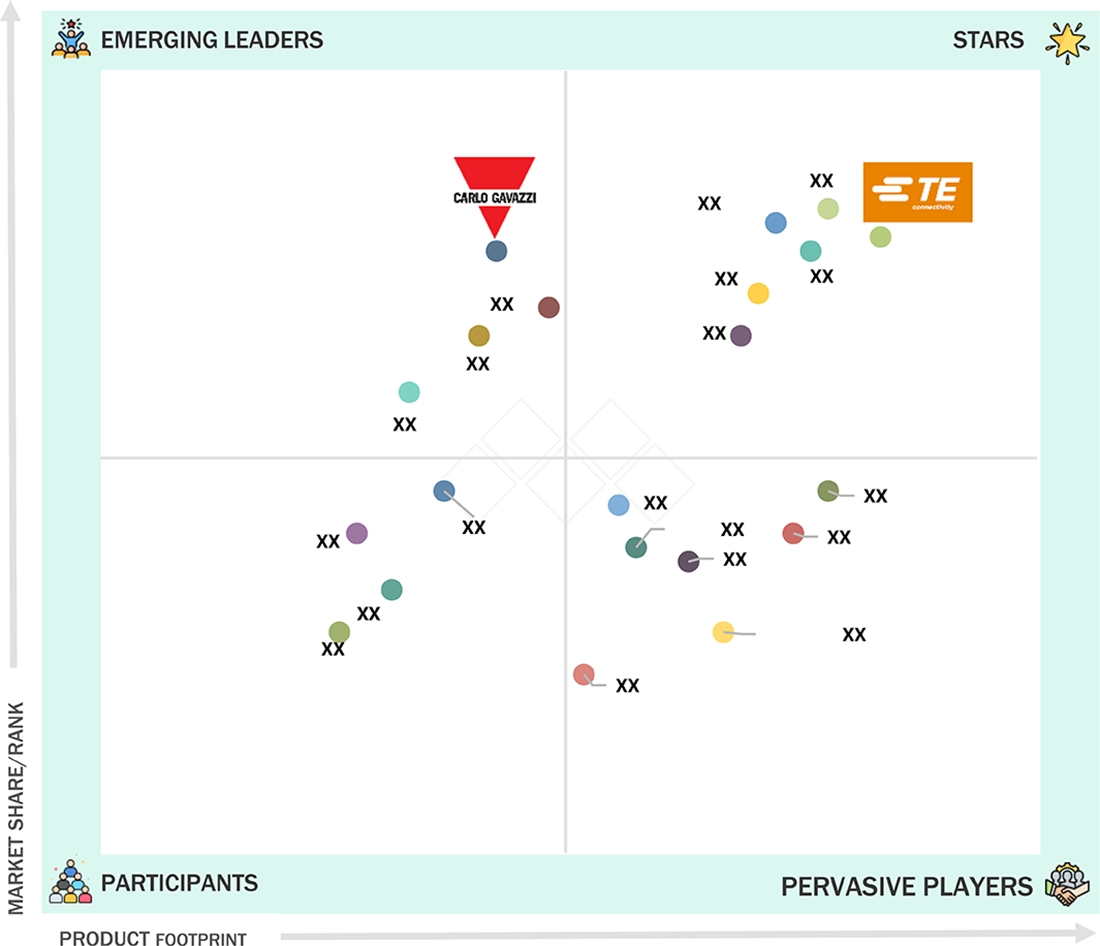
Solid State Relay Market: COMPANY EVALUATION MATRIX
In the solid-state relay market matrix, TE Connectivity (Star) leads with a robust global presence, diversified product portfolio, and strong adoption across industrial automation, energy, and automotive sectors, driving significant market growth. While Carlo Gavazzi (Emerging Leader) is gaining traction through innovative solid-state relay solutions, niche industrial applications, and an expanding regional footprint, contributing increasingly to market demand.
Source: Secondary Research, Interviews with Experts, MarketsandMarkets Analysis
KEY MARKET PLAYERS
WHAT IS IN IT FOR YOU: Solid State Relay Market REPORT CONTENT GUIDE
DELIVERED CUSTOMIZATIONS
We have successfully delivered the following deep-dive customizations:
| CLIENT REQUEST | CUSTOMIZATION DELIVERED | VALUE ADDS |
|---|---|---|
| Asia Pacific-based SSR Adoption |
|
|
| European SSR Manufacturer |
|
|
| North American End -use company |
|
|
| Japan-based Stakeholder for industrial, automotive, transportation, water-pumps, communication and so on. |
|
|
| Material Provider |
|
|
RECENT DEVELOPMENTS
- June 2025 : Sensata Technologies opened its new Northern Ireland Technology Centre (NITC) in Newtownabbey, uniting 360 engineering and support staff in a 67,000 sq. ft, BREEAM-certified facility. Specializing in sensor technology for vehicles, including tire pressure monitoring and EV charging devices, the center strengthens Northern Ireland’s role in advanced manufacturing. The multi-million-pound investment enhances R&D, fosters innovation, and supports global production while creating high-value jobs and driving economic growth in the region.
- November 2024 : Eaton expanded its Puducherry, India, electrical manufacturing facility to 260,000 sq ft, doubling power distribution production capacity. The upgrade, featuring Industry 4.0 processes, a centralized warehouse, and an R&D center, supports "Make in India," boosts localization, and will create 300 jobs, serving sectors like data centers and infrastructure.
- February 2024 : Infineon Technologies launched a new family of solid-state isolators using coreless transformer technology, delivering faster switching, up to 70% lower power dissipation, and enhanced reliability over optical SSRs. Supporting loads beyond 1,000 V and 100 A, they suit applications in battery management, energy storage, renewables, and industrial and building automation.
- January 2024 : Omron Corporation unveiled its new range of IoT-enabled SSRs, designed for predictive maintenance in industrial environments. It introduced a new series of SSRs with IoT capabilities designed for predictive maintenance in industrial settings, enabling smarter, more connected automation.
- May 2022 : Texas Instruments introduced a new portfolio of automotive-qualified solid-state relays, including the TPSI3050-Q1 and TPSI2140-Q1, designed to enhance EV safety, reduce solution size by up to 90%, and cut costs by as much as 50%. These relays integrate power and signal isolation in a single chip, enabling faster switching, higher reliability, and improved performance for high-voltage automotive and industrial applications compared to electromechanical and photorelay solutions.
Table of Contents
 Exclusive indicates content/data unique to MarketsandMarkets and not available with any competitors.
Methodology
The research process for this study included systematic gathering, recording, and analysis of data about customers and companies operating in the solid state relay market. This process involved extensive use of secondary sources, directories, and databases (Factiva and OANDA) to identify and collect valuable information for a comprehensive, technical, market-oriented, and commercial study of the solid state relay market.
In-depth interviews were conducted with primary respondents, including experts from core and related industries and preferred manufacturers, to gather and verify critical qualitative and quantitative information and assess growth prospects. Key players in the solid state relay market were identified through secondary research, and their market standings were determined through both primary and secondary research. This process involved reviewing annual reports of top companies and interviewing key industry experts, such as CEOs, directors, and marketing executives.
Secondary Research
Various sources were utilized in the secondary research process to gather information important for this study. These include company annual reports, press releases, investor presentations, white papers, technology journals, certified publications, articles by recognized authors, directories, and databases.
Secondary research was primarily used to gather essential information about the industry’s value chain, the overall pool of market players, market classification based on industry trends down to the most detailed level, regional markets, and significant developments from both market and technology perspectives.
Primary Research
Primary research was also carried out to identify segmentation types, key players, the competitive landscape, and important market dynamics such as drivers, restraints, opportunities, challenges, and industry trends, along with key strategies adopted by companies in the solid state relay market. Extensive qualitative and quantitative analyses were conducted on the entire market engineering process to gather key information and insights throughout the report.
Extensive primary research was conducted after gathering insights into the solid state relay market scenarios through secondary research. Several primary interviews were carried out with experts from both the demand side (application and region) and the supply side (solution type) across four major geographic regions: North America, Europe, Asia Pacific, and RoW. About 60% of the interviews were from the supply side, and 40% from the demand side. These primary data were collected through questionnaires, emails, and telephonic interviews.

Note: The three tiers of the companies have been defined based on their total/segmental revenue as of 2024: Tier 1 = >USD 1 billion, Tier 2 = USD 1 billion–USD 500 million, and Tier 3 = USD 500 million. ‘Others’ include sales, marketing, and product managers.
To know about the assumptions considered for the study, download the pdf brochure
Market Size Estimation
In the full market engineering process, both top-down and bottom-up approaches, along with several data triangulation methods, were used to estimate and validate the size of the solid state relay market and other related submarkets. Key market players were identified through secondary research, and their market shares in different regions were determined via primary and secondary research. This entire methodology involved analyzing the annual and financial reports of leading companies and conducting interviews with experts such as CEOs, VPs, directors, and marketing executives to gather key insights, both quantitative and qualitative.
All percentage shares, splits, and breakdowns were determined using secondary sources and verified through primary sources. All relevant parameters affecting the markets covered in this research were thoroughly examined, verified through primary research, and analyzed to produce final quantitative and qualitative data. This data was consolidated and enhanced with detailed inputs and analysis from MarketsandMarkets and presented in this report.
Solid State Relay Market : Top-Down and Bottom-Up Approach

Data Triangulation
After determining the overall market size through the estimation process, as explained above, the total market has been divided into several segments and subsegments. To complete the overall market analysis and obtain precise statistics for all segments and subsegments, market breakdown and data triangulation methods have been used where applicable. The data have been triangulated by examining various demand and supply factors and trends. Additionally, the market has been validated using top-down and bottom-up approaches.
Market Definition
A solid state relay (SSR) is an electronic switching device that utilizes semiconductor components—such as thyristors, triacs, MOSFETs, or IGBTs—in place of mechanical contacts to activate or deactivate electrical loads. SSRs are generally controlled by a low-voltage input signal and offer electrical isolation between the control circuit and the load, frequently through optical coupling. In contrast to electromechanical relays, SSRs lack moving parts, which affords them benefits including faster switching speeds, extended operational lifespan, silent operation, and increased resistance to shock, vibration, and mechanical deterioration. They are extensively employed in applications demanding dependable and maintenance-free switching, such as industrial automation, temperature control, motor drives, renewable energy systems, electric vehicles, medical apparatus, and communication equipment.
Key Stakeholders
- Suppliers of raw materials
- Technology investors
- Designers, manufacturers, and suppliers of solid state relays
- Integrators, suppliers, and service providers of solid state relays
- In-house testing laboratories
- System integrators
- Distributors, resellers, and traders
- Research institutions and organizations
- Solid state relay forums, alliances, consortiums, and associations
- Market research and consulting firms
- End users
Report Objectives
- To describe and forecast the solid state relay market, in terms of value, based on type, current rating, output voltage, mounting type, application, and region
- To describe and forecast the solid state relay market, in terms of volume, by current rating
- To forecast the market, in terms of value, for various segments with regard to four main regions: North America, Europe, Asia Pacific, and Rest of the World (RoW)
- To provide detailed information regarding the major factors, such as drivers, restraints, opportunities, and challenges, influencing the growth of the solid state relay market
- To analyze micromarkets with respect to individual growth trends, prospects, and contributions to the total market
- To study the complete supply chain and allied industry segments of the solid state relay landscape
- To strategically analyze the regulatory landscape, tariffs, standards, patents, Porter’s Five Forces, import and export scenarios, trade values, and case studies pertaining to the market under study
- To analyze opportunities in the market for various stakeholders by identifying the high-growth segments
- To profile key players and comprehensively analyze their market position in terms of ranking and core competencies, along with detailing the competitive landscape for market leaders
- To analyze competitive developments, such as product launches, acquisitions, partnerships, and expansions, in the solid state relay market
Customization Options:
With the given market data, MarketsandMarkets offers customizations according to the company’s specific needs. The following customization options are available for the report:
Key Questions Addressed by the Report
What is the current size of the Solid State Relay market?
The global Solid State Relay (SSR) market is valued at USD 1.74 billion in 2025.
What is the projected market size by 2030?
The market is expected to reach USD 2.36 billion by 2030.
What is the expected CAGR of the SSR market?
The market is forecast to grow at a CAGR of 6.3% from 2025 to 2030.
What are the major growth drivers of the SSR market?
Key drivers include increasing industrial automation, rising EV adoption, renewable energy expansion, demand for maintenance-free switching solutions, and Industry 4.0 implementation.
Which application segment holds the largest market share?
Industrial Automation accounts for the largest share due to extensive use of SSRs in robotics, PLCs, conveyors, and process control systems.
Which region is growing the fastest in the SSR market?
Asia Pacific is projected to register the highest growth rate, driven by manufacturing expansion, EV production, and automation investments.
Which SSR type is expected to grow the fastest?
Opto-coupled Solid State Relays are expected to witness the fastest growth due to superior isolation, reliability, and compatibility with automation systems.
Which output voltage segment dominates the market?
AC Output SSRs hold a significant market share because of their widespread use in industrial, commercial, and residential AC load control applications.
Who are the leading companies in the Solid State Relay market?
Major players include ABB, TE Connectivity, Rockwell Automation, Schneider Electric, Siemens, Panasonic Corporation, and Eaton.
What are the key market trends shaping the industry?
Major trends include smart factories, Industry 4.0 adoption, IoT-enabled SSRs, EV charging infrastructure growth, renewable energy integration, and improved thermal management technologies.
Need a Tailored Report?
Customize this report to your needs
Get 10% FREE Customization
Customize This ReportPersonalize This Research
- Triangulate with your Own Data
- Get Data as per your Format and Definition
- Gain a Deeper Dive on a Specific Application, Geography, Customer or Competitor
- Any level of Personalization
Let Us Help You
- What are the Known and Unknown Adjacencies Impacting the Solid State Relay Market
- What will your New Revenue Sources be?
- Who will be your Top Customer; what will make them switch?
- Defend your Market Share or Win Competitors
- Get a Scorecard for Target Partners

Custom Market Research Services
We Will Customise The Research For You, In Case The Report Listed Above Does Not Meet With Your Requirements
Get 10% Free CustomisationTESTIMONIALS

Tetsuya Ohhira
Business Development Manager-Technology Business
Nikon Corporation,
Leading Japanese MNC specializing in optics and imaging productswww.nikon.com
MarketsandMarkets™ response
is quick. Their attitude is flexible and positive. Analyst Insights are globally considered and
significant. Client Services quickly respond to our inquiry and demand. Their wide range of global
surveys help us make our strategic plan.
We hope Knowledge Store will be easier to search
for a report.
VP - Marketing & Business Development
Leading Provider of Process Control Solutions
We engaged with MarketsandMarkets on a study to perform an analysis and recommend a Go-To-Market strategy for metrology and process control in the semiconductor market. The study was tailored to our targets and needs with well-defined milestones. Our overall experience with the MarketsandMarkets team was very good throughout the project in all aspects including the analysis methodologies used, the quality and depth of primary and secondary data sets, the professionalism and flexibility of the team and the ability to meet the target schedule and milestones. We want to thank MarketsandMarkets team for a job well done.


Growth opportunities and latent adjacency in Solid State Relay Market