
Switchgear Monitoring System Market Size, Share, Analysis

Switchgear Monitoring System Market by Switchgear Type (Gas-insulated, Air-insulated), Voltage (Low, Medium, and High and Extra High), End User (Utilities, Industrial, Commercial, Residential), Component, Service, and Region - Global Forecast to 2030


OVERVIEW
Source: Secondary Research, Interviews with Experts, MarketsandMarkets Analysis
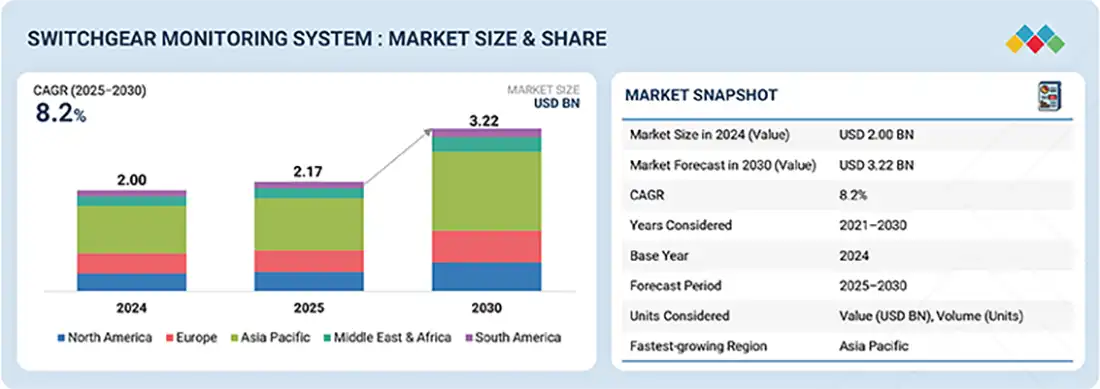
The global switchgear monitoring system market is projected to grow at a CAGR of 8.2% between 2025 and 2030, as the industry is estimated to reach USD 2.17 billion from 2025 to USD 3.22 billion by 2030. The switchgear monitoring system market is experiencing steady expansion, driven by the growing emphasis on power quality and reliability in response to rising demand for continuous and uninterrupted power supply. This growth is further supported by heightened concerns surrounding the safety and efficient operation of electrical equipment. The need for advanced monitoring systems has become critical as global power grids face increasing strain from expanding urban infrastructure, industrial automation, and the integration of renewable energy sources. These systems can detect fault conditions, including overheating, insulation degradation, and partial discharges, thereby preventing unexpected outages, reducing maintenance costs, and extending the lifespan of switchgear assets.
Switchgear Monitoring System Market Size and Forecast:
- Market Size Value in 2024: USD 2.00 Billion
- Market Size Value in 2025: USD 2.17 Billion
- Revenue Forecast in 2030: USD 3.22 Billion
- Growth Rate: CAGR of 8.2% from 2025 to 2030
- Data available from 2021 to 2030
Switchgear Monitoring System Market Trends and Insights
- Market Growth: Switchgear Monitoring System Market growth is driven by increasing smart grid investments, grid modernization initiatives, and rising demand for reliable power infrastructure.
-
Growing Trends: Adoption of IoT-enabled monitoring, predictive maintenance, and real-time asset condition monitoring is increasing across utilities and industrial facilities.
- Growth Opportunities: Expansion of renewable energy infrastructure, growing deployment of smart grids are creating new opportunities.
- Market Share Analysis: The utilities segment is expected to account for the largest Switchgear Monitoring System market share due to the growing focus on grid reliability and asset performance optimization.
KEY TAKEAWAYS
-
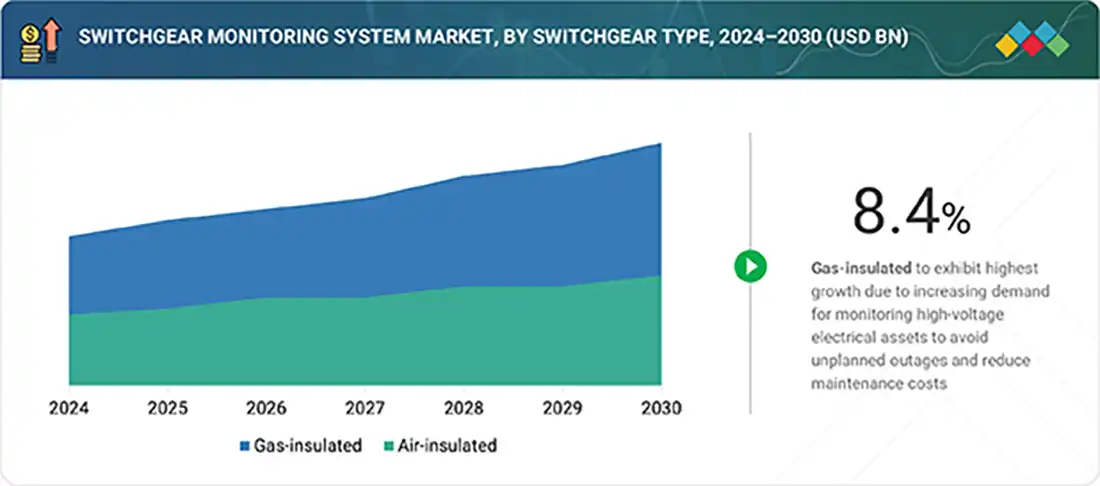
BY SWITCHGEAR TYPEThe switchgear monitoring system market is segmented by type into gas-insulated switchgear and air-insulated switchgear. The gas-insulated switchgear type leads due to its compact design, high reliability, and suitability for high-voltage applications in space-bound areas. It is also safer, requires less maintenance, and is more durable when exposed to extreme environmental conditions compared to air-insulated switchgear.
-
BY END USERThe switchgear monitoring system market is segmented by end user into utilities, industrial, and commercial. Utilities is expected to lead the market due to the increasing demand for reliable power supply, grid modernization, and predictive maintenance. From a stability and efficiency perspective, switchgear monitoring systems are becoming increasingly common in utility infrastructure, such as substations, transmission lines, and distribution networks.
-
BY COMPONENTBased on component, the switchgear monitoring system market is segmented into hardware and software. The hardware segment holds the largest market share because sensors, control units, communication modules, and other physical monitoring devices form the core infrastructure for real-time condition monitoring.
-
BY SERVICEServices in the switchgear monitoring system market include partial discharge monitoring, gas monitoring, temperature monitoring, and other services. Temperature monitoring is expected to be the fastest-growing service segment, as overheating is one of the most common causes of switchgear failures, often leading to insulation breakdown, arcing, or fire hazards. Continuous temperature monitoring enables early detection of hotspots, improving equipment reliability and reducing unplanned outages.
-
BY VOLTAGEThe switchgear monitoring systems market is segmented by voltage into the low, medium, and high & extra-high segments. The high & extra-high segment is expected to be the largest as these systems are mainly used in transmission and large-scale industrial applications, where reliability and safety are critical. High & extra-high voltage switchgear operate under very high loads, and even small failures can cause widespread blackouts, equipment damage, or safety risks. This encourages utilities and industries to adopt advanced monitoring solutions to ensure continuous power flow and reduce downtime.
-
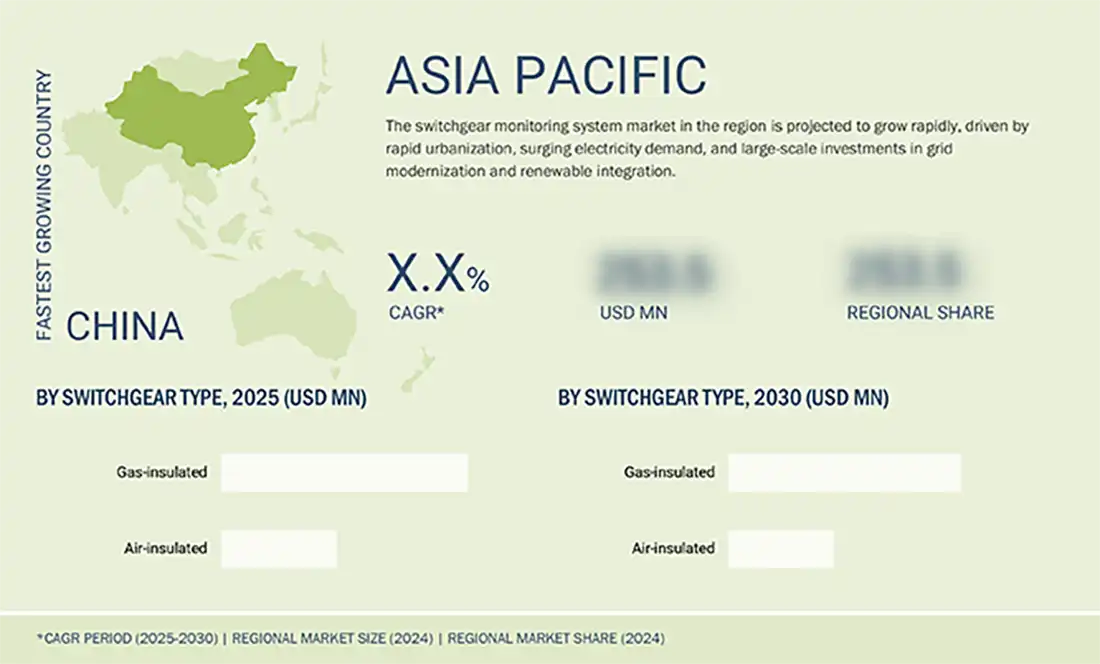
BY REGIONThe switchgear monitoring system market covers North America, Europe, Asia Pacific, Middle East & Africa, and South America. Asia Pacific is expected to be the largest region for the switchgear monitoring system market, driven by rapid industrialization, urbanization, and a significant increase in electricity demand. Massive investments in power infrastructure development, grid modernization, and renewable energy integration are prompting utilities and industries in the region to adopt advanced switchgear monitoring systems for improved reliability and operational efficiency. Additionally, several large-scale manufacturing facilities and expanding metro and rail projects are boosting the need for continuous power monitoring and fault detection solutions.
-
COMPETITIVE LANDSCAPEThe market players are using organic and inorganic strategies such as partnerships, acquisition and investments to strengthen their positions. Companies such as Siemens have formed partnerships to meet the rising demand for switchgear monitoring in innovative applications.
The switchgear monitoring system market is growing at a robust pace owing to the increased need for reliable power distribution and high-performance monitoring systems in the utilities sector. Switchgear monitoring systems offer real-time diagnostics, enhanced safety, and streamlined maintenance capabilities, making them suitable for a wide range of applications, including substations, transmission lines, smart grid infrastructure, and industrial power systems. This versatility underscores their broad utility across various sectors. The global transition toward a more sustainable energy future, coupled with the enforcement of stricter energy regulations, is accelerating the replacement of outdated infrastructure with advanced switchgear surveillance systems. Technological advancements and the declining cost of monitoring equipment are making these systems increasingly affordable and accessible. The growing adoption of smart technologies and automation is expanding their scope of application. The combination of operational efficiency, innovation, and regulatory compliance is fueling steady global market growth.
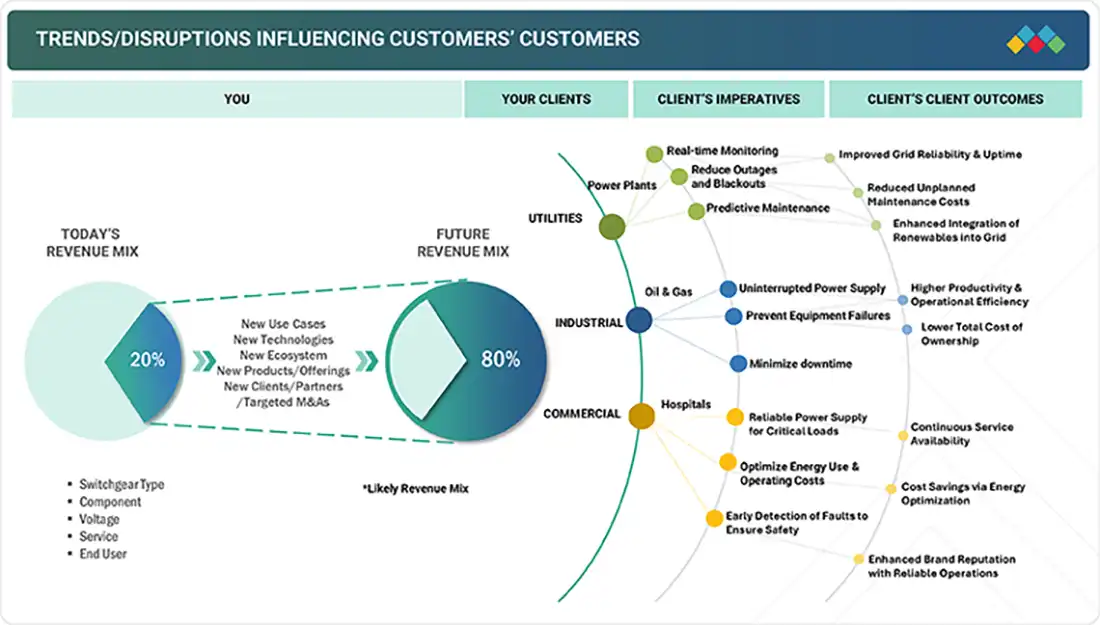
TRENDS & DISRUPTIONS IMPACTING CUSTOMERS' CUSTOMERS
An increase in demand for improved reliability through the early detection of failure and the avoidance of unplanned outages is expected to drive the switchgear monitoring system market. Furthermore, increasing investments in smart grid technologies and replacing aging infrastructure to enhance grid efficiency are likely to create lucrative growth opportunities for the switchgear monitoring system market.
Source: Secondary Research, Interviews with Experts, MarketsandMarkets Analysis
MARKET DYNAMICS
Level
-
Strengthened power distribution infrastructure

-
Rising use of electric distribution and transmission systems powered by renewable energy sources

Level
-
High installation cost

-
Integration and cybersecurity-related challenges

Level
-
Growing deployment of smart grids

-
Expansion of renewable energy infrastructure

Level
-
Inadequate data storage and management concerns

-
Susceptibility of switchgear monitoring systems to cyber threats

Source: Secondary Research, Interviews with Experts, MarketsandMarkets Analysis
Driver: Rising use of electric distribution and transmission systems powered by renewable energy sources
The trend toward renewable energy worldwide is considerably changing the tectonic of power generation and distribution centers. Since solar, wind, and hydroelectric power generation have increased in popularity, a complementary movement exists to develop and upgrade electric transmission and distribution systems to surgically direct the distribution of fluctuating and distributed energy. Renewable sources produce intermittent and variable quantities of electricity that may burden conventional grids and raise the potential for overflows, malfunctions, and inefficiencies. This markets the highly desired intelligent switching gear monitoring systems that could provide real-time data and anomaly detection, and facilitate automated grid protection systems that enhance stable power quality and support a reliable power supply.
Restraint: High installation cost
The high cost of deploying switchgear monitoring systems is a key restraint limiting their adoption, especially in developing regions. These systems require advanced hardware, such as sensors for temperature, SF6 gas levels, and partial discharge detection, along with sophisticated software platforms for real-time analytics and predictive maintenance. Beyond the core equipment, the total cost includes software licensing, IT testing, system integration, project management, and staff training, which collectively drive up initial investment. For many utilities and industrial players, especially those operating on constrained budgets, the return on investment is not immediately evident, making them hesitant to shift from traditional maintenance methods.
Opportunity: Expansion in renewable energy
The global expansion of renewable energy infrastructure, particularly in solar, wind, and hydro power, is creating significant growth opportunities for the switchgear monitoring system market. In renewable energy systems, real-time monitoring solutions must offer high reliability to manage variable power generation, ensure grid stability, and prevent equipment failures. As switchgear plays a critical role in isolating and protecting electrical circuits in these installations, there is a rising demand for intelligent monitoring systems capable of detecting issues such as overheating, partial discharges, and insulation degradation before they lead to costly downtime. The integration of distributed energy resources (DERs), battery storage systems, and microgrids into existing power grids further increases the complexity of power distribution. This added complexity necessitates more advanced switchgear monitoring to enable improved control, predictive maintenance, and optimized system performance. According to the International Renewable Energy Agency (IRENA), renewable energy capacity is expected to grow by over 70% by 2030. This surge will drive strong demand for digital grid infrastructure, including real-time switchgear monitoring solutions.
Challenge: Inadequate data storage and management concerns
Despite their critical role, switchgear monitoring systems often face challenges related to data storage and management. Effective data management is essential to ensuring the reliability and optimal performance of switchgear assets within the power grid. Inadequate or incomplete data can hinder the effectiveness of condition monitoring, health assessments, and preventive maintenance strategies. To address these limitations, it is necessary to implement robust data storage and management systems that enable continuous monitoring and routine evaluation of switchgear performance. One viable solution involves deploying intelligent switchgear equipped with advanced capabilities for data processing, storage, and visualization. These systems can collect and retain sensor-generated data, allowing for comprehensive analysis to identify patterns and trends that may lead to unexpected downtime. Additionally, non-contact temperature sensing technologies, such as infrared (IR) sensors and thermal imaging cameras, can enhance condition assessment efforts. These tools allow for periodic and accurate temperature measurements within switchgear, providing critical insights that support predictive maintenance and system reliability.
Switchgear Monitoring System Market: COMMERCIAL USE CASES ACROSS INDUSTRIES
| COMPANY | USE CASE DESCRIPTION | BENEFITS |
|---|---|---|
 |
Temperature monitoring of Low and Medium Voltage (LV & MV) switchgear using wireless SAW (Surface Acoustic Wave) sensors at a large petrochemical operation | Real-time continuous temperature monitoring, non-intrusive and wireless sensors, high sensor lifespan, reduced risk of arc-flash, improved safety, savings from avoiding failures and downtime |
 |
Modular Switchgear Monitoring (MSM) solution deployed for high-voltage switchgear in new installations and retrofits | Improved reliability and reduction in unplanned downtime, earlier warnings allow maintenance planning, enhanced diagnostic data speeds repairs, better regulatory/environmental compliance by detecting SF6 leaks |
 |
Partial Discharge (PD)/On-line condition monitoring in MV (Medium Voltage) switchgear | Early detection of faults, reduced risk of failure, maintenance schedule, lowers cost of unexpected outages |
Logos and trademarks shown above are the property of their respective owners. Their use here is for informational and illustrative purposes only.
MARKET ECOSYSTEM
The switchgear monitoring system market ecosystem includes various key participants such as raw material suppliers, manufacturers, distributors, end users, and after-sales maintenance service providers. The main end users of the switchgear monitoring system are found in the utilities, industrial, commercial, and residential sectors. This list is not exhaustive but is provided to illustrate the primary players involved in the market.
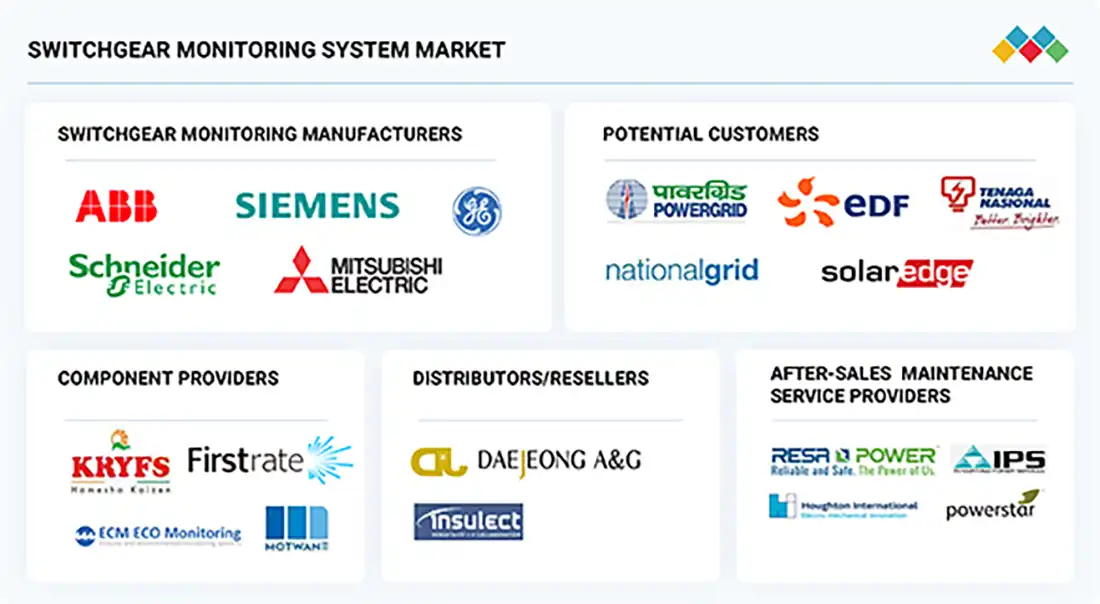
Logos and trademarks shown above are the property of their respective owners. Their use here is for informational and illustrative purposes only.
MARKET SEGMENTS
Source: Secondary Research, Interviews with Experts, MarketsandMarkets Analysis
Switchgear Monitoring System Market, By Switchgear Type
The switchgear type of the switchgear monitoring system is bifurcated into gas-filtration and air-filtration. Air-insulated switchgear utilizes air as the primary insulation medium, making it highly suitable for low- and medium-voltage applications. It is widely adopted due to its cost-effectiveness, environmentally friendly nature, simple design, and ease of maintenance. Gas-insulated switchgear is a more compact and efficient solution, typically encapsulated in metal enclosures filled with insulating gases such as sulfur hexafluoride (SF6) or a mixture of SF6 with other gases. GIS provides superior insulation performance, reliability, and safety, especially for high- and extra-high-voltage applications, making it indispensable for modern transmission and distribution networks.
Switchgear Monitoring System Market, By Component
The switchgear monitoring system market by component includes hardware and software. Hardware forms the backbone of switchgear monitoring systems, comprising sensors, measuring instruments, transmitters, and controllers that enable the collection and transfer of critical operational data. These devices are widely deployed across industries, utilities, and commercial applications to monitor system health and performance in real time. However, as the volume of collected data grows significantly, the role of software becomes increasingly critical. Advanced analytics, AI-driven insights, and real-time dashboards provided by software solutions enable operators to process, manage, and interpret hardware data, facilitating predictive maintenance, faster fault detection, and improved operational efficiency. Consequently, hardware dominates the market in terms of share, while software is the fastest-growing segment due to rising digitalization and the integration of IoT-enabled platforms.
Switchgear Monitoring System Market, By End User
The end user segment of the switchgear monitoring system market is divided into utilities, industrial, commercial, and other end users. Utilities are undergoing substantial transformations as they integrate renewables and distributed energy sources such as wind generating units, battery storage, and combined heat and power. Switchgear monitoring systems ensure an efficient and uninterrupted power supply across various industries, including manufacturing, marine, oil & gas, mining, aviation, cement, aluminum, iron and steel, and automobile and chemicals. Switchgear monitoring systems are integral to diverse commercial settings, including hotels, malls, hospitals, and other expansive structures. Within commercial complexes and large buildings, switchgear is pivotal in supplying, safeguarding, and controlling power for essential functions such as heating, lighting, and air conditioning systems. Other end users, such as railway traction systems, metro rail networks, high-speed locomotives, and the residential segment, operate on different electrical supply standards.
Switchgear Monitoring System Market, By Service
The service segment includes partial discharge monitoring, gas monitoring, temperature monitoring, and other services. Partial discharge monitoring is essential as undetected discharges can cause insulation breakdown, leading to electrical arcing, equipment damage, or system failures. Gas monitoring plays an important role, particularly in enclosed environments, by detecting harmful gases and ensuring compliance with safety standards. It also helps manage SF6 and other insulating gases used in GIS applications. Temperature monitoring is emerging as the fastest-growing service, as switchgear operational temperature is directly linked to asset longevity and reliability. High temperatures accelerate insulation degradation and increase the risk of failure, making temperature monitoring crucial for extending equipment life and preventing costly outages. Other services, including humidity, load, and fault monitoring, complement these systems by ensuring optimal performance and reducing downtime.
Switchgear Monitoring System Market, By Voltage
The voltage segment includes low, medium, and high & extra high. Switchgear systems are designed to enhance the performance, safety, and reliability of electrical distribution systems operating at lower voltage levels. The main advantages of these systems are the avoidance of unplanned outages, reduced repair costs, improved switchgear availability, and a more efficient maintenance strategy. Switchgear monitoring systems monitor devices featuring a medium-voltage range between 1 and 36 kV. They are used by utilities and various end users from industrial and commercial sectors. The main applications of switchgear monitoring systems are to offer electrical protection against overload currents, insulation failure, and emergency switching for residential and commercial infrastructure. Switchgear monitoring systems for high and extra high voltage applications, typically rated above 36 kV, are predominantly gas-insulated and play a critical role in connecting to high-voltage transmission grids.
REGION
Asia Pacific to be fastest-growing region in global switchgear monitoring system market during forecast period
Asia Pacific is projected to be the fastest-growing market, driven by rapid industrialization, increasing investments in smart grid systems, and the rising demand for reliable power distribution. High-performance monitoring applications are particularly critical in emerging economies such as China and India, where the energy and utility sectors continue to evolve. Supportive government policies such as China's Carbon Neutrality 2060 Plan, India's Pradhan Mantri Sahaj Bijli Har Ghar Yojana (Saubhagya Scheme), and ongoing infrastructure development further encourage the adoption of switchgear monitoring systems across various industries in the region.
Switchgear Monitoring System Market: COMPANY EVALUATION MATRIX
In the switchgear monitoring system market matrix, ABB stands out as a leader due to its strong market presence and extensive product portfolio, which supports large-scale adoption across various industries. The market also comprises a few fragmented players, including regional manufacturers and new entrants in the Asia Pacific, Europe, and North America. Market dynamics are motivated by real-time diagnostics, mounting electrification, favoring renewables, and boasting grid stability and sustainability. Major competitors engage in R&D, strategic alliances, and digital platforms to enhance their presence in this new environment.

Source: Secondary Research, Interviews with Experts, MarketsandMarkets Analysis
KEY MARKET PLAYERS
MARKET SCOPE
| REPORT METRIC | DETAILS |
|---|---|
| Market Size Value in 2024 | USD 2.00 Billion |
| Revenue Forecast in 2030 | USD 3.22 Billion |
| Growth Rate | CAGR of 8.2% from 2025–2030 |
| Actual data | 2021–2030 |
| Base year | 2024 |
| Forecast period | 2025–2030 |
| Units considered | Value (USD Million), Volume (Units) |
| Report Coverage | Revenue forecast, company ranking, competitive landscape, growth factors and trends |
| Segments Covered | • By Switchgear Type: Gas-insulated, Air-insulated |
| Regional Scope | Asia Pacific, Europe, North America, South America, and the Middle East & Africa. |
WHAT IS IN IT FOR YOU: Switchgear Monitoring System Market REPORT CONTENT GUIDE
DELIVERED CUSTOMIZATIONS
We have successfully delivered the following deep-dive customizations:
| CLIENT REQUEST | CUSTOMIZATION DELIVERED | VALUE ADDS |
|---|---|---|
| U.S.-based Switchgear monitoring system Manufacturer | • Detailed company profiles of competitors (financials, product portfolio) |
|
| Industry & Application Segmentation | • Comprehensive list of customers with segmentation by end user & switchgear type | |
| Switchgear monitoring system Manufacturer | • Transformative improvements in efficiency and performance, balancing initial cost challenges with long-term operational and system-level economic advantages | |
| U.S.-based switchgear monitoring system Raw Material Supplier | • Global & regional production capacity benchmarking |
RECENT DEVELOPMENTS
- May 2024 : Siemens declared an investment of USD 120 million to increase its manufacturing capacity in India. The plan involves establishing a new power distribution equipment facility in Aurangabad and increasing the capacity of the gas-insulated switchgear (GIS) plant in Goa to address both domestic and export demand.
- May 2024 : Dynamic Ratings partnered with the National Rural Electric Cooperative Association (NRECA) to enhance community development and knowledge sharing. This collaboration aligns Dynamic Ratings with the values upheld by the cooperative community, reinforcing its commitment to continuous growth. Through its engagement with NRECA, Dynamic Ratings will also gain access to industry expertise that supports the advancement of reliability standards and contributes to the safe and effective management of electric utility systems.
- March 2024 : Siemens and Maschinenfabrik Reinhausen partnered under the Siemens Xcelerator ecosystem to deliver enhanced asset monitoring solutions combining Siemens’ NXpower Monitor with MR’s ETOS monitoring for power transformers and switchgear.
- September 2023 : ABB purchased technology transfer there to upgrade the production of UniGear ZS1 medium-voltage switchgear in South Africa. The company plans to strengthen its presence and local manufacturing in the country. Due to the investment, more than 60% of the technology will be locally manufactured and assembled in the country. As a result, the company’s customers will benefit from higher design flexibility, faster accessibility, and decreased costs due to reduced import costs and delivery time.
- January 2023 : Schneider Electric acquired AVEVA to accelerate the shift toward the subscription-only business model and strengthen end-to-end solutions.
Table of Contents
 Exclusive indicates content/data unique to MarketsandMarkets and not available with any competitors.
Methodology
The study involved major activities in estimating the current size of the switchgear monitoring system market. Exhaustive secondary research was done to collect information on the peer and parent markets. The next step was to validate these findings, assumptions, and sizing with industry experts across the value chain through primary research. Both top-down and bottom-up approaches were employed to estimate the complete market size. Thereafter, market breakdown and data triangulation techniques were used to estimate the market size of the segments and subsegments.
Secondary Research
This research study on the switchgear monitoring system market involved the use of extensive secondary sources, directories, and databases, such as Hoovers, Bloomberg, Businessweek, Factiva, International Energy Agency, and BP Statistical Review of World Energy, to identify and collect valuable information for a technical, market-oriented, and commercial study of the global switchgear monitoring system market. Other secondary sources included annual reports, press releases, and investor presentations of companies, white papers, certified publications, articles by recognized authors, manufacturer associations, trade directories, and databases.
Primary Research
The switchgear monitoring system market comprises stakeholders such as switchgear monitoring system manufacturers, technology providers, and support providers in the supply chain. The demand side of this market is characterized by the rising demand for switchgear monitoring systems in nations due to increasing demand for grid reliability, real-time fault detection, and predictive maintenance in aging power infrastructure and expanding renewable energy networks. The supply side is characterized by rising demand for contracts from the distribution utilities, and mergers and acquisitions among big players. Various primary sources from both the supply and demand sides of the market were interviewed to obtain qualitative and quantitative information. The following is the breakdown of primary respondents:

Note: “Others” include sales managers, engineers, and regional managers.
The tiers of the companies are defined based on their total revenue as of 2024: Tier 1: >USD 1 billion, Tier 2:
USD 500 million–1 billion, and Tier 3:
To know about the assumptions considered for the study, download the pdf brochure
Market Size Estimation
Both the top-down and bottom-up approaches were used to estimate and validate the size of the switchgear monitoring system market and its dependent submarkets. The key players in the market were identified through secondary research, and their market share in the respective regions was obtained through primary and secondary research. The research methodology includes studying the annual and financial reports of top market players and interviews with industry experts, such as chief executive officers, vice presidents, directors, sales managers, and marketing executives, for key quantitative and qualitative insights related to the switchgear monitoring system market.
Switchgear Monitoring System Market : Top-Down and Bottom-Up Approach

Data Triangulation
After arriving at the overall market size from the estimation process explained above, the total market was split into several segments and subsegments. The data triangulation and market breakdown processes were employed to complete the overall market engineering process and arrive at the exact statistics for all the segments and subsegments, wherever applicable. The data was triangulated by studying various factors and trends from both the demand and supply sides. The market was also validated using both the top-down and bottom-up approaches.
Market Definition
Switchgear monitoring systems continuously monitor switchgear cubicles by recording the real-time information of operational parameters using sensors. The sensors installed in switchgear systems monitor the threshold breaches, warn of any significant change in operating performance, and assemble an overall condition assessment of the apparatuses. Access to this monitoring system data helps replace conventional maintenance approaches with condition-based services that help reduce switchgear equipment maintenance costs. The main objective of a switchgear monitoring system is to identify poor-quality electrical connections faster with the help of various monitoring types, such as temperature, partial discharge, gas, and others. Thus, this helps in decreasing unplanned downtime while extending the equipment lifespan.
Stakeholders
- Public and private electric utilities
- Distribution companies (DISCOM)
- Switchgear manufacturers, dealers, and suppliers
- Switchgear monitoring system component manufacturers
- Energy & power sector consulting companies
- Government & research organizations
- Independent power producers
- Investment banks
- Electrical equipment associations
- Assembly, testing, and packaging vendors
- Integrated device manufacturers (IDMs)
- Process industries and power and energy associations
- Raw material and manufacturing equipment suppliers
Report Objectives
- To describe and forecast the switchgear monitoring system market based on switchgear type, component, voltage, service, end user, and region, in terms of value
- To describe and forecast the switchgear monitoring system market based on region, in terms of volume
- To describe and forecast the switchgear monitoring system market for various segments with respect to five main regions: North America, Europe, Asia Pacific, South America, and the Middle East & Africa, in terms of value
- To provide detailed information regarding the drivers, restraints, opportunities, and challenges influencing the growth of the market
- To provide a detailed overview of the switchgear monitoring system value chain analysis, use case analysis, key stakeholders and buying criteria, patent analysis, trade analysis, tariff analysis, regulations and codes, pricing analysis, Porter’s five forces analysis, impact of AI and US tariff on the said market
- To strategically analyze micromarkets1 with respect to individual growth trends, prospects, and contributions to the total market
- To analyze opportunities in the market for various stakeholders by identifying high-growth segments
- To strategically profile key players and comprehensively analyze their market position in terms of ranking and core competencies2, along with detailing the market’s competitive landscape
- To analyze growth strategies such as joint ventures, partnerships, mergers and acquisitions, contracts, agreements, and product launches adopted by players in the switchgear monitoring system market
1 Micromarkets are defined as the segments and subsegments of the switchgear monitoring system market included in the report.
2 The core competencies of companies are captured in terms of their key developments and product portfolios, as well as the key strategies they adopted to sustain their position in the switchgear monitoring system market.
Available Customizations
MarketsandMarkets offers customizations according to the specific needs of the companies with the given market data.
The following customization options are available for the report:
Product Analysis
- Product matrix, which gives a detailed comparison of the product portfolio of each company
Geographic Analysis as per Feasibility
- Further breakdown of the Switchgear monitoring system, by country
Company Information
- Detailed analysis and profiling of additional market players (up to five)
Key Questions Addressed by the Report
What was the switchgear monitoring system market size in 2025?
The switchgear monitoring system market size was USD 2.17 billion in 2025.
What are the major drivers for the switchgear monitoring system market?
The switchgear monitoring system market is mainly driven by strengthened power distribution infrastructure, rising use of electric distribution and transmission systems powered by renewable energy sources, and shift from conventional maintenance methods to condition-based services.
Which region is projected to be the fastest-growing switchgear monitoring system market during the forecast period?
Asia Pacific is expected to be the fastest-growing market between 2025 and 2030, fueled by rapid industrialization, increasing investments in smart grid infrastructure, and the escalating need for reliable power distribution.
Which segment, by switchgear type, will hold a larger market share during the forecast period?
Gas-insulated switchgear systems are expected to hold a larger share of the switchgear monitoring system market.
Which segment is projected to be the largest, by end user, in the switchgear monitoring system market throughout the forecast period?
Utilities are likely to account for the largest market share throughout the forecast period.
Need a Tailored Report?
Customize this report to your needs
Get 10% FREE Customization
Customize This ReportPersonalize This Research
- Triangulate with your Own Data
- Get Data as per your Format and Definition
- Gain a Deeper Dive on a Specific Application, Geography, Customer or Competitor
- Any level of Personalization
Let Us Help You
- What are the Known and Unknown Adjacencies Impacting the Switchgear Monitoring System Market
- What will your New Revenue Sources be?
- Who will be your Top Customer; what will make them switch?
- Defend your Market Share or Win Competitors
- Get a Scorecard for Target Partners

Custom Market Research Services
We Will Customise The Research For You, In Case The Report Listed Above Does Not Meet With Your Requirements
Get 10% Free CustomisationTESTIMONIALS

Kimberly Murphy
GLOBAL MARKETING DIRECTOR
Bently Nevada,
Leading Condition Monitoring & Asset Protectionwww.bakerhughesds.com/bently-nevada

MarketsandMarkets™ showed consistent rigor for success and relentlessly worked with Bently Nevada stakeholders to positively impact go-to-market strategy. Their proactiveness and flexibility has been instrumental in achieving the objectives to grow our sales pipeline in key industrial markets.

DARRICK HUEBER
Business Development Leader
Nexus Controls LLC,
Leading Manufacturer of Automation System & Electrical Panelswww.bakerhughesds.com/nexus-controls

We partnered with MarketsandMarkets to expand our business further by tapping into new industrial segments. It was critical for us to gather crucial business insights about specific markets to achieve this goal. MarketsandMarkets engagement model and client services helped us provide those insights, it was really impressive and valuable for my business. The team was extremely flexible and helpful.

Mike Schoff
Global Industrial Commercial Strategy Leader
Nexus Controls LLC
Leading Manufacturer of Automation System & Electrical Panelswww.bakerhughesds.com/nexus-controls
We consulted MarketsandMarkets for potential Partner Identification. Overall, it was a good experience. The insights provided through interviews conducted by the team helped us put together the questionnaire required for discussion with the selected partners. Their ability to provide insights through interviews with customers in a timely manner was quite impressive.


Growth opportunities and latent adjacency in Switchgear Monitoring System Market