
Tow Prepreg Market

Tow Prepreg Market by Resin Type (Epoxy, Phenolic), Fiber Type (Carbon, Glass), Application (Pressure Vessel, Oxygen Cylinders, Scuba Tanks), End-Use Industry (Automotive & Transportation, Oil & Gas, Aerospace & Defense), and Region - Global Forecast to 2029


OVERVIEW
Source: Secondary Research, Interviews with Experts, MarketsandMarkets Analysis
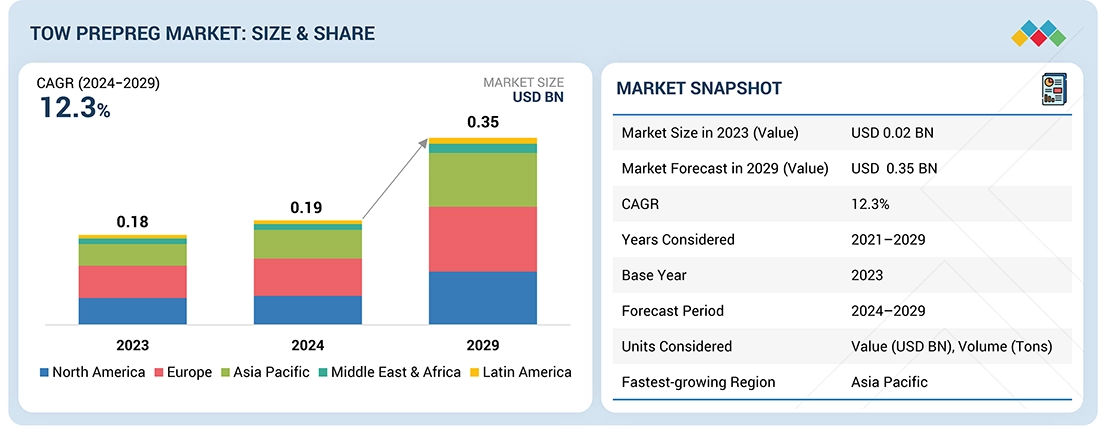
The tow prepreg market is expected to grow from USD 0.19 billion in 2024 to USD 0.35 billion in 2029, at a CAGR of 12.3% during the forecast period. Tow prepreg (also referred to as towpreg) is a material made using continuous fibers impregnated with high-performance resins. These fibers can be glass, carbon, or aramid. Tow prepregs are typically used in the filament winding process to construct high-strength structures in aerospace & defense, automotive & transportation, and other industries. Using the filament winding process results in higher productivity for manufacturers. These materials are used in various applications in several industries, such as automotive & transportation, aerospace & defense, oil & gas, and sports & recreation.
KEY TAKEAWAYS
-
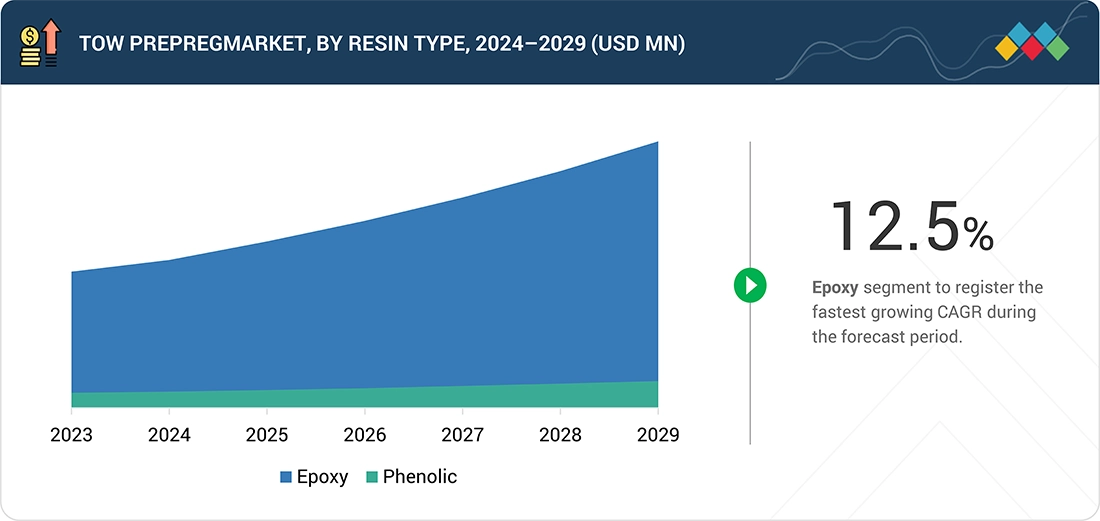
BY RESIN TYPEThe tow prepreg market based on resin type has been segmented into epoxy, phenolic, polyamide, and other resin types.In 2023, epoxy resin dominated the tow prepreg market both in terms of value and volume. The high market share owes to the fact that epoxy resin is the most commonly used in the manufacturing of tow prepreg due to its exceptional properties that enhance the performance and durability of composite materials.
-
BY FIBER TYPETow prepregs are made of carbon fiber, glass fiber, and other fibers in combination with various matrix systems. They are a blend of structural fiber and polymer matrix.Carbon fiber is expected to dominate the forecast period owing to the rising demand from applications like pressure vessels, oxyge cylinders, scuba tanks, bicycle frames, fishing rods, and golf shafts in a variety of markets including automotive & transportation, aerspace & defense, industrial, infrastructure, recreation and marine.
-
BY APPLICATIONBased on application, tow prepreg market is segmented into four types: pressure vessel, oxygen cylinders, scuba tanks, and other applications. Other applications include mobile pipelines, fire extinguishers and other high-pressure vessels, fishing rods, golf shafts, and bicycle frames. The pressure vessel application is expected to lead the application segment as oil & gas sector is a major consumer of tow prepregs due to the need for pressure vessels that can withstand high pressures.
-
BY REGIONEurope was the largest market of tow prepreg in 2023. The increasing demand for tow prepreg in the automotive & transportation industry is a major driver of the market in Europe.
-
COMPETITIVE LANDSCAPEThe market is driven by strategic collaborations, capacity expansions, and technological innovations from leading players such as SGL Carbon, ENEOS Holdings, Inc. Teijin Limited, and Mitsubishi Chemical Carbon Fiber and Composites, Inc. These companies are deploying organic means to grow or leverage partnerships to increase their market presence and overall revenue.
The tow prepreg market is poised for strong growth, driven by robust demand across automotive & transportation, oil & gas, aerospace & defense, sporting equipment, and other industries . Demand from the automotive and aerospace sectors is increasing as manufacturers adopt lightweight materials to improve fuel efficiency.
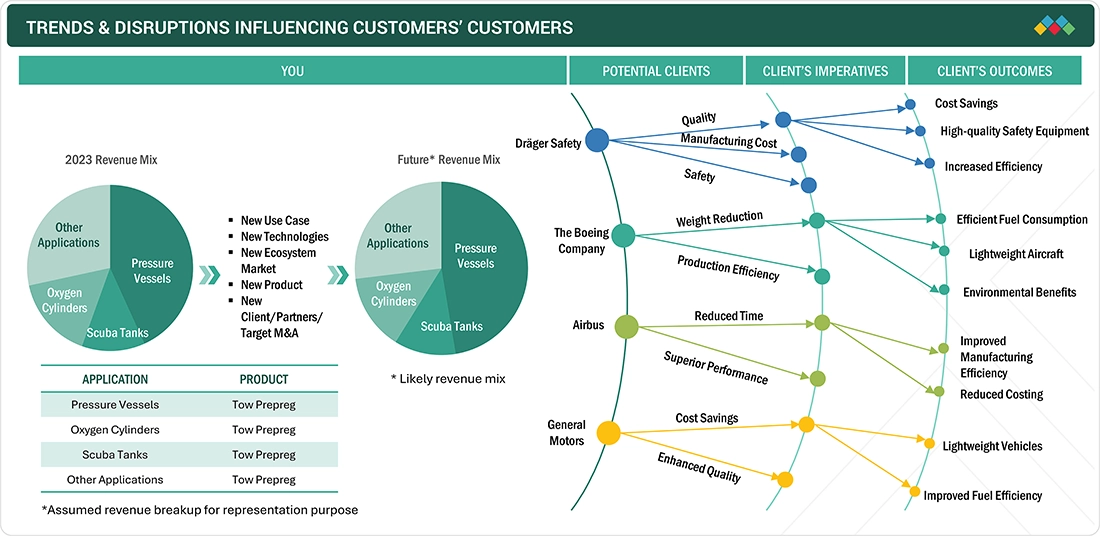
TRENDS & DISRUPTIONS IMPACTING CUSTOMERS' CUSTOMERS
Lightweight, high-strength composites like tow prepreg are increasingly adopted to improve fuel efficiency, reduce emissions, and enhance structural performance in aerospace, automotive, wind energy (turbine blades), and hydrogen storage applications. Automation technologies such as Automated Fiber Placement (AFP) and Automated Tape Laying (ATL) using AI are streamlining the tow prepreg manufacturing process. These innovations increase production speed, improve precision, reduce labor costs, and enable efficient production of complex structures, boosting the market potential.
Source: Secondary Research, Interviews with Experts, MarketsandMarkets Analysis
MARKET DYNAMICS
Level
-
Increase in demand for hydrogen storage pressure vessels

-
Rising demand for carbon fiber tow prepreg in various end-use industries

Level
-
High processing and manufacturing cost

-
Compliance & Regulatory issues

Level
-
Growing adoption of tow prepregs for Automated Fiber Placement technology

-
Growing demand of tow prepregs for wind turbine blades

Level
-
Recyclability of tow prepreg

Source: Secondary Research, Interviews with Experts, MarketsandMarkets Analysis
Driver: Increase in demand for hydrogen storage pressure vessels
Pressure vessels are designed for storage of gas or liquid under high pressure. Mostly, carbon fiber composite pressure vessels are used to hold liquids and gases at very high pressures when low weight is a priority, like in oil & gas, automobile, and aerospace applications. There are five types of pressure vessels, of which three of them uses carbon fiber composite materials. Automotive & transportation, aerospace & defense, and oil & gas industries are adopting these types of pressure vessels for weight savings. Voith GmbH & Co. KGaA, an automotive supplier is producing type IV high pressure hydrogen tanks made with towpreg filament winding technology.
Restraint: High processing and manufacturing cost
The use of tow prepregs has significantly increased in manufacturing various structural parts, including pressure vessels, oxygen cylinders, and scuba tanks. However, the high costs associated with processing and manufacturing limit their usage. It is essential to use tools for early estimation of costs in the process to help reduce overall expenses. While there is an increasing demand for high-strength and lightweight products, the high cost of tow prepreg is a significant barrier for the tow prepreg market. Due to the high cost, end users often favor traditional metal products over tow prepregs.
Opportunity: Growing adoption of tow prepregs for Automated Fiber Placement
AFP enables highly precise and repeatable placement of tow prepregs onto complex curved surfaces, with robotic systems laying individual tows along optimized paths. This precision minimizes material waste and maximizes structural performance, leading to substantial cost savings in high value sectors like aerospace and automotive. The scalability and speed of AFP, especially compared to manual layup or traditional filament winding allows manufacturers to meet growing demand for lightweight, high-strength composite components at larger production volumes.
Challenge: Production of low-cost carbon fiber
Tow prepregs have been utilized in a wide range of applications including pressure vessels, oxygen cylinders, scuba tanks, body panels, bicycle frames, fishing and rods, and golf shafts. Using tow prepregs in these applications allows lightweight, high-strength components, improved fuel-efficiency, increased performance and durability, excellent resistance to corrosion and fatigue. Recycling of tow prepregs is hindered by the complex multiphase structure of these materials and the nature of cross-linked resins. This presents a major challenge to the recyclability of tow prepregs in a range of applications.
Tow Prepreg Market: COMMERCIAL USE CASES ACROSS INDUSTRIES
| COMPANY | USE CASE DESCRIPTION | BENEFITS |
|---|---|---|
 |
Uses tow prepreg carbon fiber for lightweight passenger cell and body panels in i3/i8 electric vehicles and other performance models. | Enables energy efficient EVs via reduced weight, higher range, and improved crash safety. |
 |
Applies tow prepregs in ultra- long turbine blade spars benefiting offshore wind installations. | Provides superior strength- to-weight for blades, boosts energy capture, and lowers maintenance via corrosion resistance. |
 |
Uses tow prepreg in automated fiber placement (AFP) for fuselages, wings, and control surfaces in next-generation commercial aircraft. | Enables 30 – 50% component weight reduction vs. metals, improving fuel efficiency by up to 20% lowering emissions and operating costs, and supporting higher payload or passenger capacity. |
Logos and trademarks shown above are the property of their respective owners. Their use here is for informational and illustrative purposes only.
MARKET ECOSYSTEM
The tow prepreg ecosystem involves identifying and analyzing interconnected relationships among various stakeholders, including raw material suppliers, manufacturers, distributors, contractors, and end users. The raw material suppliers are the source of raw materials like resins and fibers to the tow prepreg manufacturers. The manufacturers use technologies such as impregnation process, winding process, and curing process to produce tow prepreg products. The distributors and suppliers are the ones who establish contact between the manufacturing companies and end users to concentrate the supply chain, increasing operational efficiency and profitability.
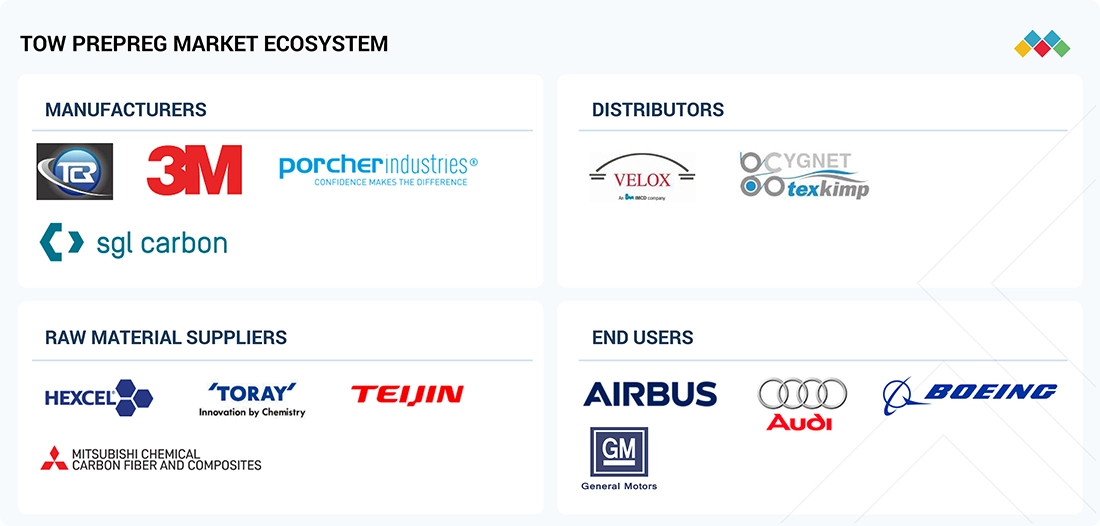
Logos and trademarks shown above are the property of their respective owners. Their use here is for informational and illustrative purposes only.
MARKET SEGMENTS
Source: Secondary Research, Interviews with Experts, MarketsandMarkets Analysis
Tow prepreg Market, By Resin
The epoxy resin dominated the tow prepreg market with a significant market share in 2023. The high market share owes to the fact that this resin is the most commonly used in the manufacturing of tow prepreg due to its exceptional properties that enhance the performance and durability of composite materials.
Tow prepreg Market, By Fiber
Carbon fiber is expected to dominate the overall market in the forecast period. The demand for carbon fiber tow prepregs is rising for pressure vessles, oxygen cylinders, scuba tanks, bicycle frames, fishing rods, and golf shafts in a variety of markets including automotive & transportation, aerospace & defense, industrial, infrastructure, recreation, and marine.
Tow prepreg Market, By Application
The pressure vessel application is expected to lead the market in the forecast period. The oil & gas sector is a major consumer of tow prepregs primarily due to the need for pressure vessels that can withstand high pressures. Tow prepregs are known for their lightweight yet strong characteristics, which are crucial for pressure vessels. They provide enhanced structural integrity, resistance to extreme pressures, and a lower risk of leaks or ruptures.
Tow prepreg Market, By End-use Industry
Oil & gas segment held the largest share of the overall tow prepreg market in 2023.In the oil & gas industry, tow prepregs are often used to manufacture pressure vessels, storage tanks, and pipes. High stiffness-to-weight ratio and light weight properties of tow prepreg makes it an ideal choice for different applications in the oil & gas industry.
REGION
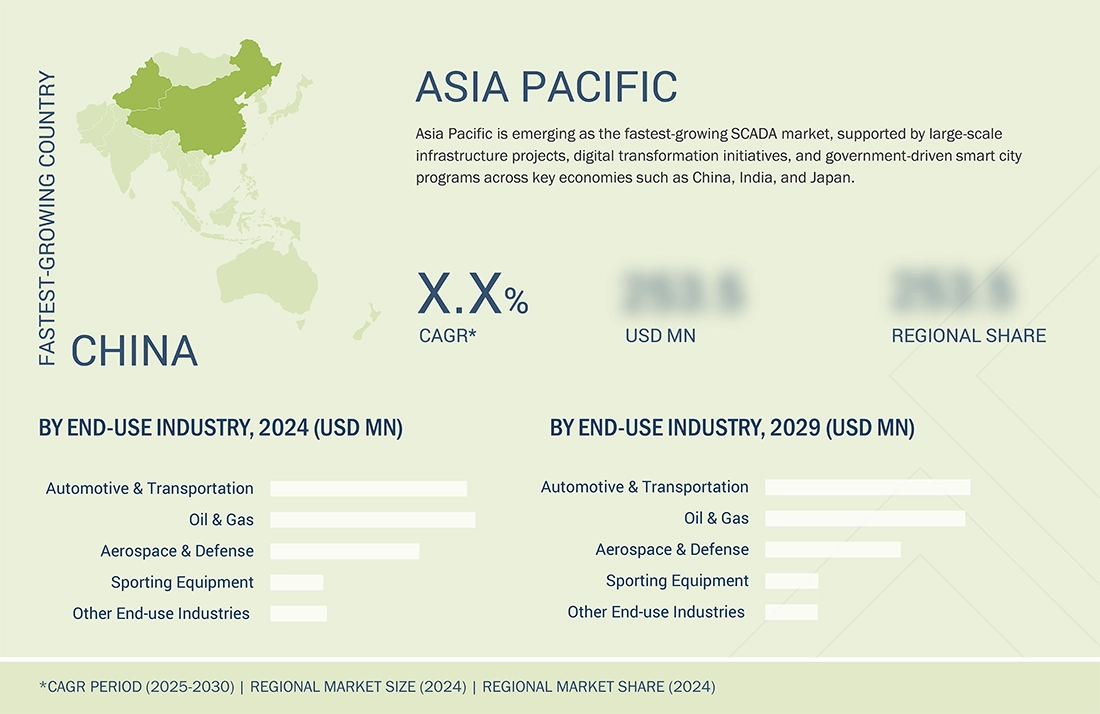
Europe to dominate the global tow prepreg market during forecast period
Europe led the market due to its robust aerospace & defense and automotive industries, which have a high demand for lightweight, high-strength materials to improve fuel efficiency and performance. The increasing demand for tow prepreg in the automotive & transportation industry is a major driver of the market in the region. Automotive is one of the major industries operating in the region and is comparatively stronger than any other region due to the presence of established automotive manufacturers including Mercedes Benz, BMW Group, and Renault Group, that rely on tow prepregs for light weight and fuel-efficient vehicles
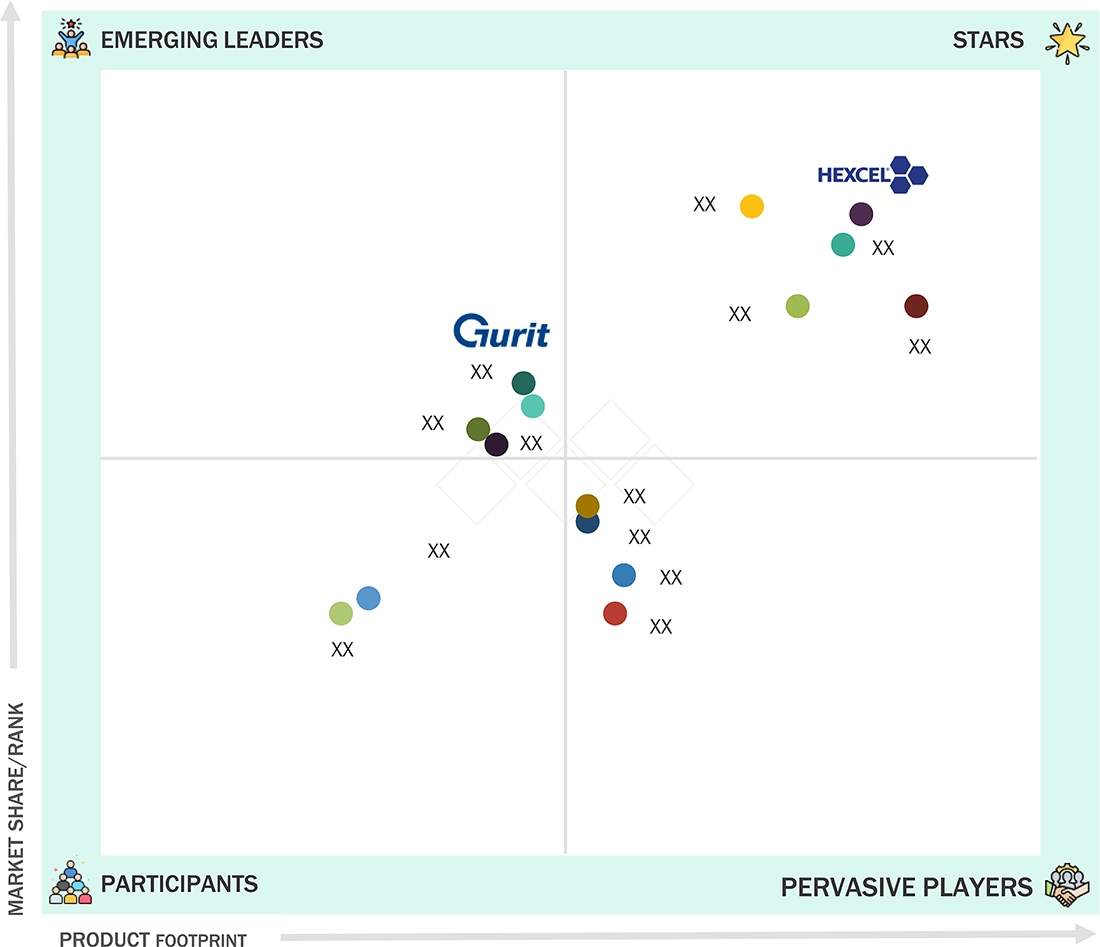
Tow Prepreg Market: COMPANY EVALUATION MATRIX
In the CF & CFRP market matrix, Teijin Limited (Star) leads with a strong market presence and wide product portfolio, driving large-scale adoption across industries like automotive and aerospace. SGL Carbon (Emerging Leader) is gaining traction with sustainable tow prepreg solutions in automotive & transportation, aerospace & defense, and oil & gas applications. While Teijin dominates with scale, SGL Carbon shows strong growth potential to advance toward the leaders' quadrant.
Source: Secondary Research, Interviews with Experts, MarketsandMarkets Analysis
KEY MARKET PLAYERS
MARKET SCOPE
| REPORT METRIC | DETAILS |
|---|---|
| Market Size in 2023 (Value) | USD 0.18 Billion |
| Market Forecast in 2029 (Value) | USD 0.35 Billion |
| Growth Rate | CAGR of 12.5% from 2024-2029 |
| Years Considered | 2021-2029 |
| Base Year | 2023 |
| Forecast Period | 2024-2029 |
| Units Considered | Value (Billion), Volume (tons) |
| Report Coverage | Revenue forecast, company ranking, competitive landscape, growth factors, and trends |
| Segments Covered |
|
| Regions Covered | North America, Asia Pacific, Europe, South America, Middle East & Africa |
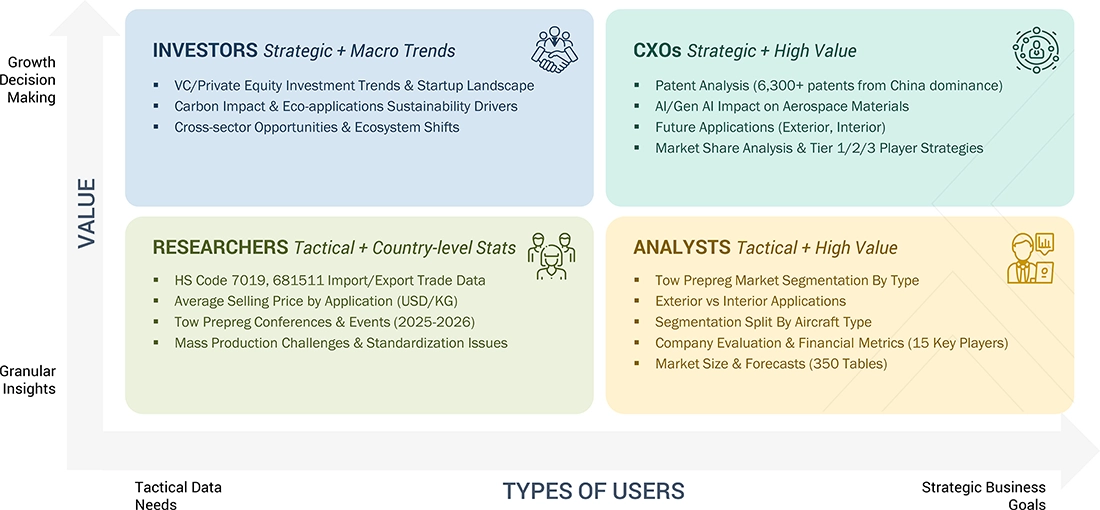
WHAT IS IN IT FOR YOU: Tow Prepreg Market REPORT CONTENT GUIDE
DELIVERED CUSTOMIZATIONS
We have successfully delivered the following deep-dive customizations:
| CLIENT REQUEST | CUSTOMIZATION DELIVERED | VALUE ADDS |
|---|---|---|
| U.S.-based Tow Prepreg Manufacturer | Comprehensive profiles: product portfolio, cost structure, manufacturing capabilities (esp. AFP, ATL integration); customer mapping by end-use (aerospace, wind, hydrogen, auto, sports); M&A & partnership landscape | Reveal market white-spaces for high-value automated applications; identify vertical integration and partnership targets; highlight untapped segments (e.g., hydrogen tanks, next-gen EVs) for tow prepreg expansion |
| Composite Structures Manufacturer | Segmented tow prepreg adoption list by sector (aerospace, wind, automotive, pipelines, hydrogen storage, marine); benchmarking of AFP/ATL use rates; adoption trend modeling by structure/application | Guide strategy for market/mainstream adoption; benchmark advanced automation’s ROI; clarify barriers (cost, automation capex, resin compatibility) and switching risks from legacy prepreg or metal solutions |
| Automotive OEM / EV Manufacturer | Lifecycle impact analysis of tow prepreg for lightweighting (chassis, battery packs); cost-benefit modeling vs. metal/CFRP alternatives; sustainability and recycling pathways assessment | Support electrification & emissions targets; quantify TCO/resale and regulatory impacts; clarify value of recycled or reclaimable tow prepreg in new mobility solutions |
| Global / Regional Raw Material Supplier | Market capacity mapping for tow prepreg fiber/resin; pipeline tracking for new AFP/ATL plants, regional expansions, and re-shoring; customer profiling by mass transit, wind, hydrogen, aerospace | Enable forward contracts/vertical integration; pinpoint regional growth hot spots; assess supply chain resilience and gaps by region/use case |
| Advanced Materials & Technology | Technology scanning: advancements in resin systems, automation, smart towpreg, process patent/IP tracking; regulatory horizon scanning (sustainability, recyclability, local policy); early-adopter profiling | Guide early entry into auto/energy/aero with next-gen smart towpreg; de-risk investments via IP mapping; identify first-mover R&D or scale-up partners in emerging green, circular economy segments |
RECENT DEVELOPMENTS
- March 2024 : Hexcel Corporation launched a new HexTow continuous carbon fiber IM9 24K providing the market with a lightweight, strong, and durable carbon fiber with enhanced value for the world's most advanced aerospace composite applications.
- October 2023 : Toray Industries expanded its French subsidiary Toray Carbon Fibers Europe S.A.'s production facilities for regular tow medium-and high-modulus carbon fibers. This will increase annual capacity at the Abidos plant (South-West France) from 5,000 metric tons annually, to 6,000 metric tons.
- July 2023 : Toray Industries, Inc. expanded its tow carbon fiber production capacity at two facilities: Spartanburg plant in South Carolina, USA of Toray Composite Materials America, Inc. and the Gumi plant in Gyeongsangbuk-do, Korea of Toray Advanced Materials Korea Inc. These investments will increase the company’s annual capacity by over 20% to 35,000 metric tons beginning in 2025.
- November 2020 : Draeger Safety entered partnership with Red Composites to utilize Towpregs to manufacture composite cylinders for SCBA (Self Contained Breathing Apparatus).
Table of Contents
 Exclusive indicates content/data unique to MarketsandMarkets and not available with any competitors.
Methodology
The study involves two major activities in estimating the current market size for the tow prepreg market. Exhaustive secondary research was done to collect information on the market, peer market, and parent market. The next step was to validate these findings, assumptions, and sizing with industry experts across the value chain through primary research. Both top-down and bottom-up approaches were employed to estimate the complete market size. After that, market breakdown and data triangulation were used to estimate the market size of segments and subsegments.
Secondary Research
Secondary sources referred to for this research study include financial statements of companies offering tow prepreg and information from various trade, business, and professional associations. Secondary research has been used to obtain critical information about the industry’s value chain, the total pool of key players, market classification, and segmentation according to industry trends to the bottom-most level and regional markets. The secondary data was collected and analyzed to arrive at the overall size of the tow prepreg market, which was validated by primary respondents.
Primary Research
Extensive primary research was conducted after obtaining information regarding the tow prepreg market scenario through secondary research. Several primary interviews were conducted with market experts from both the demand and supply sides across major countries of North America, Europe, Asia Pacific, Middle East & Africa, and Latin America. Primary data was collected through questionnaires, emails, and telephonic interviews. The primary sources from the supply side included various industry experts, such as Chief X Officers (CXOs), Vice Presidents (VPs), Directors from business development, marketing, product development/innovation teams, and related key executives from tow prepreg industry vendors; system integrators; component providers; distributors; and key opinion leaders. Primary interviews were conducted to gather insights such as market statistics, data on revenue collected from the products and services, market breakdowns, market size estimations, market forecasting, and data triangulation. Primary research also helped in understanding the various trends related to resin type, fiber type, application, end-use industry, and region. Stakeholders from the demand side, such as CIOs, CTOs, CSOs, and installation teams of the customer/end users who are seeking tow prepreg services, were interviewed to understand the buyer’s perspective on the suppliers, products, component providers, and their current usage of tow prepreg and future outlook of their business which will affect the overall market.
The Breakup of Primary Research

To know about the assumptions considered for the study, download the pdf brochure
Market Size Estimation
The research methodology used to estimate the size of the tow prepreg market includes the following details. The market sizing of the market was undertaken from the demand side. The market was upsized based on the demand for tow prepreg in different end-use industries at a regional level. Such procurements provide information on the demand aspects of the tow prepreg industry for each application. For each end-use, all possible segments of the tow prepreg market were integrated and mapped.

Data Triangulation
After arriving at the overall size from the market size estimation process explained above, the total market was split into several segments and subsegments. The data triangulation and market breakdown procedures explained below were implemented, wherever applicable, to complete the overall market engineering process and arrive at the exact statistics for various market segments and subsegments. The data was triangulated by studying various factors and trends from the demand and supply sides. Along with this, the market size was validated using both the top-down and bottom-up approaches.
Market Definition
Tow prepreg (also referred to as towpreg) is a material made using continuous fibers impregnated with high-performance resins. These fibers can be glass, carbon, or aramid. Tow prepregs are typically used in the filament winding process to construct high-strength structures in aerospace & defense, automotive & transportation, and other industries. Using the filament winding process results in higher productivity for manufacturers. These materials are used in various applications in several industries, such as automotive & transportation, aerospace & defense, oil & gas, and sports & recreation.
Stakeholders
- Tow Prepreg Manufacturers
- Tow Prepreg Distributors and Suppliers
- End-use Industries
- Universities, Governments, and Research Organizations
- Associations and Industrial Bodies
- R&D Institutes
- Environmental Support Agencies
- Investment Banks and Private Equity Firms
- Research and Consulting Firms
Report Objectives
- To define, describe, and forecast the tow prepreg market size in terms of volume and value
- To provide detailed information regarding the key factors, such as drivers, restraints, opportunities, and challenges influencing market growth
- To analyze and project the global tow prepreg market, by resin type, by fiber type, by application, end-use industry, and region
- To forecast the market size concerning five main regions (along with country-level data), namely, North America, Europe, Asia Pacific, Middle East & Africa, and Latin America, and analyze the significant region-specific trends
- To strategically analyze micromarkets with respect to individual growth trends, prospects, and contributions of the submarkets to the overall market
- To analyze the market opportunities and the competitive landscape for stakeholders and market leaders
- To assess recent market developments and competitive strategies, such as agreements, contracts, acquisitions, and new product developments/new product launches, to draw the competitive landscape
- To strategically profile the key market players and comprehensively analyze their core competencies
Key Questions Addressed by the Report
Need a Tailored Report?
Customize this report to your needs
Get 10% FREE Customization
Customize This ReportPersonalize This Research
- Triangulate with your Own Data
- Get Data as per your Format and Definition
- Gain a Deeper Dive on a Specific Application, Geography, Customer or Competitor
- Any level of Personalization
Let Us Help You
- What are the Known and Unknown Adjacencies Impacting the Tow Prepreg Market
- What will your New Revenue Sources be?
- Who will be your Top Customer; what will make them switch?
- Defend your Market Share or Win Competitors
- Get a Scorecard for Target Partners

Custom Market Research Services
We Will Customise The Research For You, In Case The Report Listed Above Does Not Meet With Your Requirements
Get 10% Free CustomisationTESTIMONIALS

We at Nissan Chemicals Corporation have been clients of MarketsandMarkets for more than a year now. We recently consulted MarketsandMarkets for a study, the team at MarketsandMarkets was extremely professional and organized. The business insights were very detailed and aligned well with our expectations that really helped us formulate the Business Plans and device new strategies for development themes. MarketsandMarkets offers a unique combination of expertise and dedicated engagement model. Their research findings have helped us in designing our Pricing Strategy which will make it easier for us to predict the future sales and profits for the next ten years. We look forward to working with MarketsandMarkets in the future.
VP of Strategy & New Business Development
Leading Specialty Chemical Company
The MarketsandMarkets Engagement Model, composed of both the Knowledge Store and advisory custom research, has greatly helped us in understanding our markets and making strategic decisions. The Knowledge Store is a fast way to allow everyone in our organization to understand more about most any market they are interested in. The ability to then get custom research done and get answers to specific strategic questions and market insight has been spectacular. The Markets and Markets team feel more like colleagues than vendors and their services have helped us change our culture where statements of things like growth opportunities and competitive position are always backed by industry research.

Rich Gibson,
Director, Corporate Strategy
Milliken & Company,
Leading Industrial Manufacturer of specialty chemical, floor covering, performance and protective textile materials, and healthcaremilliken.com
MarketsandMarkets is a trusted resource that helps us to better understand markets that are near-adjacencies-whether its technology, value chain or geography. Their Knowledge Store platform provides a dashboard of markets and their characteristics which is easy to use and saves us time.
Adam Shaw,
Market Development and Strategy Manager
AdvanSix Inc. USA,
An American Leader in Chemicalswww.advansix.com
The Knowledge Store from MarketsandMarkets is a valuable tool which has helped my team acquire greater insight in to the end markets that our business serves. This has enabled us to help our company build stronger strategies throughout our planning process.
TOSHIO KINOSHITA
Senior Chif Consultion Research & Consulting Division
Mitsubishi Chemical Research Corporation,
Leading Manufacturer of Chemical Productswww.mitsubishichem-res.co.jp/en/

We recently engaged with MarketsandMarkets for a study, the team not only clearly understood our business objectives but was also extremely professional in the way they handled the entire project. The study was efficiently conducted in a phase-wise manner, and the engagement model furnished us with high-quality business insights that far exceeded our expectations at each phase. We were especially happy that MarketsandMarkets could provide us with both, an English as well as a Japanese version of the study. A special thanks to the Analyst Team and Client Services Team, whose fluency in Japanese enhanced our comfort level, as we could converse with them in our preferred language.
Independent entrepreneurs
Arrow Precision
We approached MarketsandMarkets for study on Proppants Market, and their work exceeded our expectations. The study conducted was comprehensive and enabled us to view the market through the various dimensions. In addition, the team was extraordinarily responsive throughout the process and resolved our queries on time. I strongly recommend MarketsandMarkets and will certainly consider them for additional market assessments we will need in the future.
Global engineering company, Japan
Deputy Manager,
Strategic Planning OfficeThe high-quality insights shared by the MarketsandMarkets team helped us understand the pharmaceutical plant designers in a specific geography. It also captured the risks that we may likely face in communicating with our potential partners. The study would enable us identify partners, which would impact our future growth.


Growth opportunities and latent adjacency in Tow Prepreg Market