
Infrared Imaging Market Size, Share & Trends

Infrared Imaging Market Size, Share, Growth & Trends by Type (Reflective, Thermal), Wavelength (NIR, SWIR, MWIR, LWIR), Component (Cameras, Scopes, Modules), Technology (Cooled, Uncooled), Application (Condition Monitoring, Detection, Security & Surveillance)- Global Forecast to 2030


INFRARED IMAGING MARKET SIZE, SHARE & TRENDS
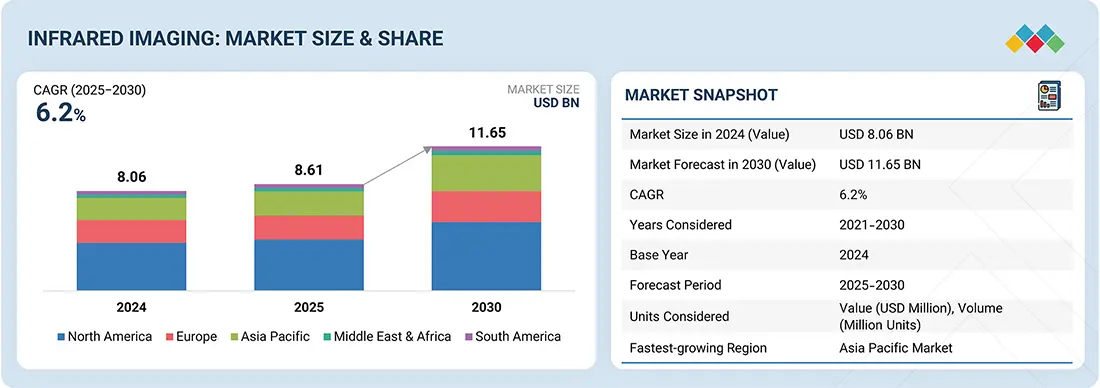
According to Marketsandmarkets, the global infrared imaging market size was valued at USD 8.61 billion in 2025 and is projected to reach USD 11.65 billion by 2030, growing at a CAGR of 12.0% from 2025 to 2030. The infrared imaging market is propelled by rising demand in defence, industrial automation, healthcare diagnostics, and surveillance applications. Growing security threats and the need for enhanced visibility in low-light conditions are accelerating the adoption of thermal imaging across military and law enforcement agencies. In parallel, industries use infrared cameras for predictive maintenance, reducing downtime and improving safety. The Infrared Imaging Market size has been expanding rapidly due to the increasing demand for advanced thermal detection technologies across industries such as defense, healthcare, manufacturing, and security.
The Infrared Imaging Market growth is primarily driven by the rising adoption of thermal cameras for predictive maintenance, surveillance, and medical diagnostics. In recent years, the Infrared Imaging Market share has been influenced by technological advancements in sensor miniaturization and improved image resolution. Additionally, the expanding applications of the IR Camera Market in smart infrastructure, automotive driver assistance systems, and industrial inspection are creating strong momentum for industry expansion. As companies continue investing in research and development, the Infrared IR Sensing Market is expected to experience steady technological innovation and wider commercial adoption.
Furthermore, emerging Infrared Imaging Market trends indicate increasing integration of artificial intelligence and machine learning with thermal imaging systems to improve accuracy and automation. The Infrared Imaging Market growth is also supported by the growing need for contactless temperature monitoring, particularly in healthcare and public safety environments. As a result, the IR Camera Market is witnessing significant demand in sectors such as building inspection, firefighting, and environmental monitoring. At the same time, the Infrared IR Sensing Market is gaining traction in consumer electronics, enabling features like gesture recognition and smart home automation. With continuous advancements in sensor technology and expanding industrial applications, the Infrared Imaging Market size and Infrared Imaging Market share are expected to grow significantly over the coming years.
MARKET SNAPSHOT TABLE
| REPORT METRIC | DETAILS |
|---|---|
| Market Size in 2025 (Value) | USD 8.61 billion |
| Market Forecast in 2030 (Value) | USD 11.65 Billion |
| Growth Rate | CAGR of 6.2% from 2025–2030 |
| Years Considered | 2021–2024 |
| Base Year | 2024 |
| Forecast Period | 2025–2030 |
| Units Considered | Value (USD Billion) and Volume (Million Units) |
| Report Coverage | Revenue forecast, company ranking, competitive landscape, growth factors, and trends |
| Top Companies |
|
| Growth Drivers |
|
| Segments Covered | By Type: Reflective, Thermal By Component: Camera, Scopes, Modules By Wavelength: NIR, SWIR, MWIR, LWIR By Application: Security & Surveillance, Monitoring & Inspection, Detection By Technology: Cooled, Uncooled By Vertical: Industrial (Aerospace, Electro |
| Regional Scope | North America, Europe, Asia Pacific, and RoW |
Market Size & Forecast
INFRARED IMAGING MARKET KEY TAKEAWAYS
- The North American Infrared Imaging market accounted for a 47.1% revenue share in 2025.
- By Type, the reflective segment is expected to account the highest CAGR of 7.2%
- By Component, the cameras segment is projected to grow at fastest rate from 2025-2030
- By Technology, the uncooled segment is expected to dominate the market
- By Application, the monitoring & inspection segment will grow the fastest during the forecast period
- Teledyne FLIR LLC, Fluke Corporation, and L3 Harris Technologies were identified as star players in the infrared imaging market, as they have focused on innovation and have brought industry coverage and strong operational and financial strength
- Seek Thermal, INFRARED CAMERAS INC., and Tonbo Imaging have distinguished themselves among startups and SMEs due to their strong product portfolio and business strategy
The infrared imaging industry is projected to grow rapidly over the next decade, driven by the demand for infrared imaging systems is driven by the need for accurate, non-contact thermal monitoring across defence, manufacturing, healthcare, and energy sectors. Rising concerns about equipment failures, process inefficiencies, and public safety are prompting industries to deploy infrared imaging solutions for real-time diagnostics and surveillance. Market growth is further supported by increasing investments in smart infrastructure, automation, and advanced safety systems.
Source: Secondary Research, Interviews with Experts, MarketsandMarkets Analysis
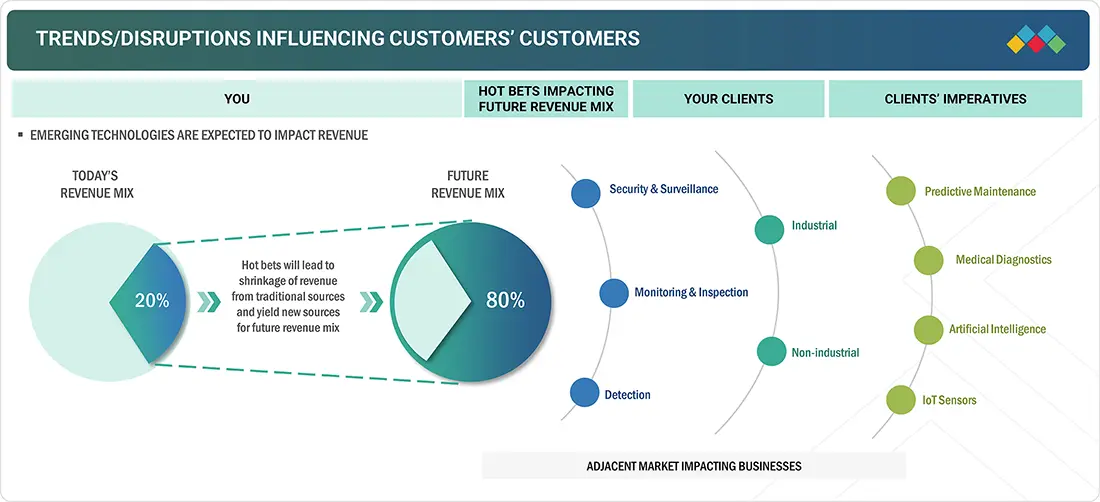
TRENDS & DISRUPTIONS IMPACTING CUSTOMERS' CUSTOMERS
Infrared imaging technology captures and visualizes thermal energy emitted by objects and environments, finding extensive use across defence, industrial, and surveillance sectors. Market growth is fuelled by rising adoption in security and surveillance applications, along with the increasing demand for uncooled infrared cameras. Additionally, expanding applications of SWIR cameras and the growing integration of infrared imaging in aerospace systems are creating significant opportunities for industry players.
Source: Secondary Research, Interviews with Experts, MarketsandMarkets Analysis
INFRARED IMAGING MARKET DYNAMICS
Level
-
Increasing use of infrared imaging products in security & surveillance applications

-
Rising adoption of infrared cameras in quality control and inspection applications

Level
-
Stringent import and export regulations for selling infrared cameras in US

-
Limitations associated with image resolution and sensitivity of infrared cameras

Level
-
Emerging applications of IR imaging technology in automotive sector

-
Integration of infrared imaging technology into consumer electronics

Level
-
Integration and compatibility challenges pertaining to infrared imaging technology

-
Crafting precision-engineered IR imaging products requires advanced design expertise.

Source: Secondary Research, Interviews with Experts, MarketsandMarkets Analysis
Driver: Increasing use of infrared imaging products in security & surveillance applications
The increasing use of infrared imaging products in security and surveillance applications is a significant growth driver for the market. Rising global concerns over safety, border security, and crime prevention fuel demand for advanced imaging solutions. Infrared cameras enable enhanced visibility in low-light or no-light conditions, providing critical support for law enforcement, military, and civilian security operations. This trend is expected to accelerate adoption across both developed and emerging economies.
Restraint: Stringent import and export regulations for selling infrared cameras in US
Stringent import and export regulations in the U.S. for selling infrared cameras pose a significant barrier for market players. Restrictions on advanced infrared technology due to national security concerns limit global trade, making it difficult for manufacturers to expand their international footprint and capitalize on cross-border opportunities.
Opportunity: Emerging applications of IR imaging technology in automotive sector
The automotive sector presents a significant opportunity for infrared imaging technology, particularly with the rise of advanced driver assistance systems (ADAS) and autonomous vehicles. Infrared cameras enhance driver safety by detecting pedestrians, animals, and obstacles in low visibility conditions such as night or fog. Growing investments by automotive OEMs in thermal imaging for collision avoidance, smart navigation, and driver monitoring systems are expected to accelerate demand, creating lucrative avenues for infrared imaging providers worldwide.
Challenge: Integration and compatibility challenges pertaining to infrared imaging technology
Integration and compatibility challenges remain a key hurdle in the infrared imaging market. Aligning infrared systems with existing digital platforms, sensors, and industrial setups requires specialized expertise. High costs of integration and interoperability issues hinder seamless adoption, particularly across emerging industries, slowing down large-scale deployment of infrared imaging solutions.
Infrared Imaging Market: COMMERCIAL USE CASES ACROSS INDUSTRIES
| COMPANY | USE CASE DESCRIPTION | BENEFITS |
|---|---|---|
 |
Thermal imaging cameras for military surveillance and border security applications | Enhanced threat detection| Real-time monitoring| Improved operational safety in low-visibility conditions |
 |
Handheld IR thermography for electrical and mechanical predictive maintenance | Reduced downtime| Early fault identification| Cost savings through preventive repairs |
 |
Cooled MWIR/LWIR sensors in aerospace platforms for target acquisition and tracking | High-resolution imaging| Extended detection range| Superior performance in adverse weather |
 |
Integrated IR cameras in IP video surveillance systems for perimeter security | 24/7 monitoring| Low-light visibility| Seamless integration with network analytics |
 |
Uncooled IR modules for missile guidance and defense electronics | Compact design| Reliable performance|Enhanced accuracy in guidance systems |
Logos and trademarks shown above are the property of their respective owners. Their use here is for informational and illustrative purposes only.
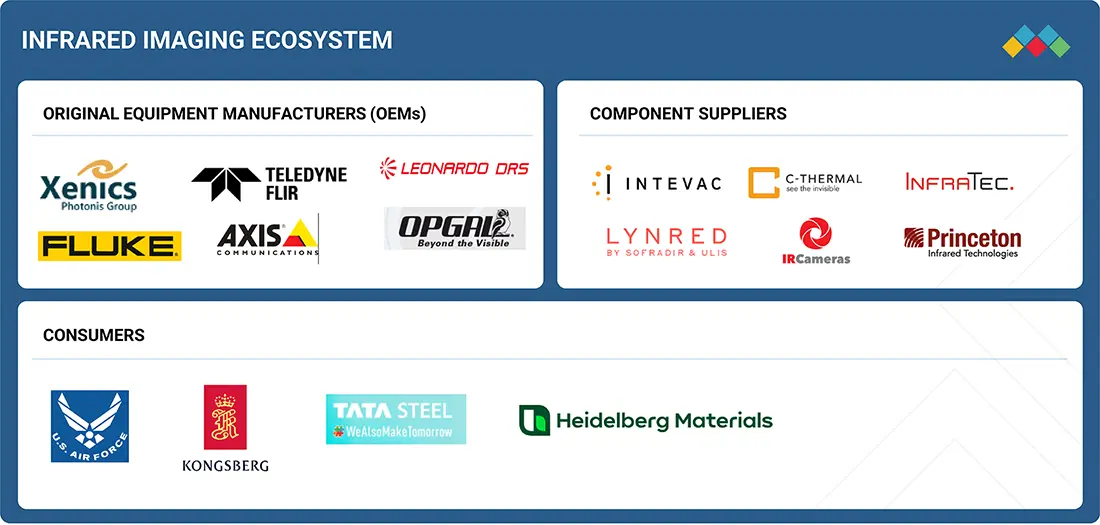
INFRARED IMAGING MARKET ECOSYSTEM
The infrared imaging market ecosystem features a robust network of stakeholders driving innovation in thermal and reflective technologies. OEMs like Xenics, Teledyne FLIR, Leonardo DRS, Fluke, Axis, and Opgal develop integrated imaging solutions for security and industrial applications. Component suppliers, including Intevac, C-Thermal, InfraTec, Lynred, IR Cameras, and Princeton Infrared Technologies, provide essential sensors and lenses. Software providers such as HGH Infrared Systems and New Imaging Technologies enable advanced analytics and AI integration. End consumers, notably the U.S. Air Force and Kongsberg, leverage these for defense, surveillance, and aerospace needs, fostering market growth across sectors.
Logos and trademarks shown above are the property of their respective owners. Their use here is for informational and illustrative purposes only.
INFRARED IMAGING MARKET SEGMENTS
Source: Secondary Research, Interviews with Experts, MarketsandMarkets Analysis
Infrared Imaging Market, By Type
The reflective segment is expected to grow at the highest CAGR, driven by its increasing use in scientific research, industrial testing, and material inspection. Its ability to provide high-precision imaging in laboratory and field applications is fuelling adoption, supported by advancements in sensor technology and cost-efficient optical solutions.
Infrared Imaging Market, By Component
The camera segment is projected to hold the largest share, owing to their wide applications in security, defence, industrial inspection, and healthcare. Continuous innovations, miniaturization, and cost reduction of infrared cameras have expanded adoption across industries, while rising demand for surveillance and monitoring in both military and civil applications boosts growth.
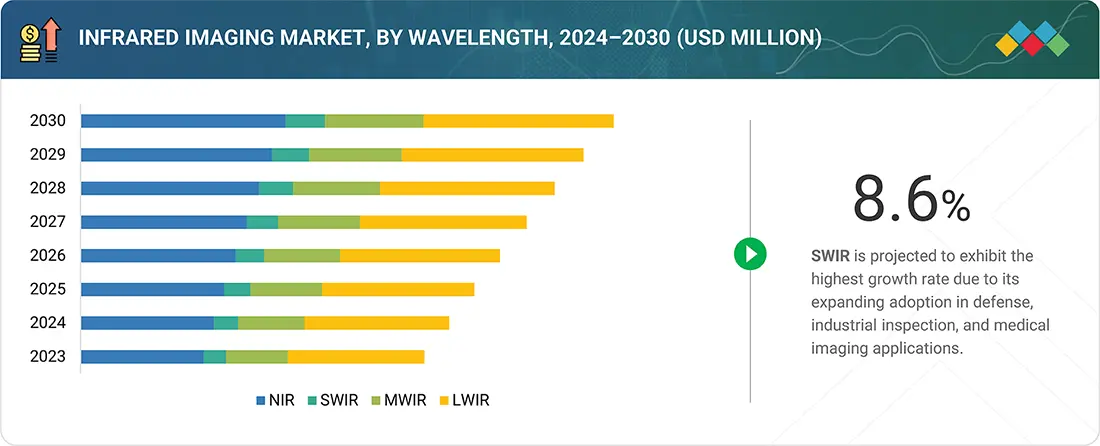
Infrared Imaging Market, By Wavelength
In 2024, the LWIR (Long-Wave Infrared) segment accounted for the largest share, owing to its strong suitability for night vision, surveillance, and thermal monitoring. LWIR cameras operate effectively in total darkness and through atmospheric obscurants, making them essential in defence, security, and industrial inspection applications.
Infrared Imaging Market, By Application
The security & surveillance segment captured the highest market share due to rising global security concerns, border monitoring needs, and critical infrastructure protection. Infrared imaging provides round-the-clock monitoring in low-light or obscured environments. Growing adoption by defence forces, airports, and smart cities initiatives has further accelerated the dominance of this segment.
Infrared Imaging Market, By Technology
The uncooled technology segment captured the highest market share, fuelled by lower costs, compact design, and maintenance-free operation. Uncooled infrared cameras are increasingly deployed in industrial monitoring, firefighting, and commercial surveillance applications, as they provide reliable imaging performance while being energy-efficient and more affordable than cooled counterparts.
Infrared Imaging Market, By Vertical
Between 2025 and 2030, the non-industrial segment is expected to register the highest CAGR, driven by rapid adoption in defence, civil infrastructure, medical, and research applications. In scientific studies, demand for enhanced security, early disease detection, and thermal monitoring will accelerate market growth globally across non-industrial sectors.
INFRARED IMAGING MARKET BY REGION
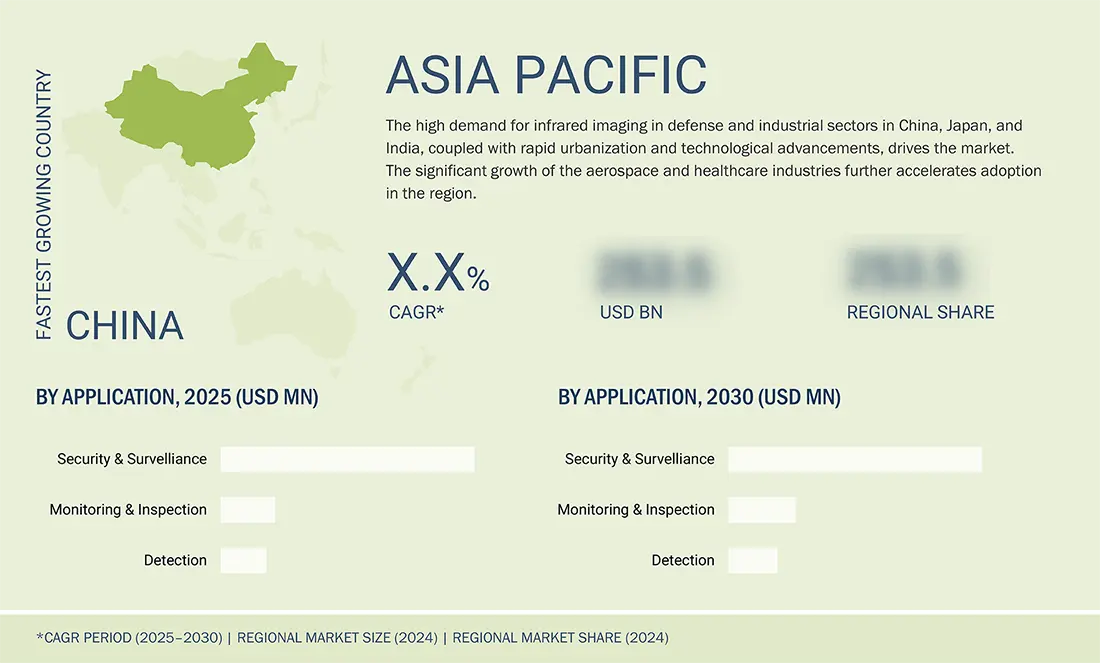
Asia Pacific to be the fastest-growing region in the global prinfrared imaging market during the forecast period
The Asia Pacific region is projected to grow at the highest CAGR during the forecast period, driven by increasing defense budgets, rising industrial automation, and the adoption of surveillance solutions in countries like China, India, and Japan. Expanding aerospace, electronics, and semiconductor sectors also contribute significantly to infrared imaging demand in the region.
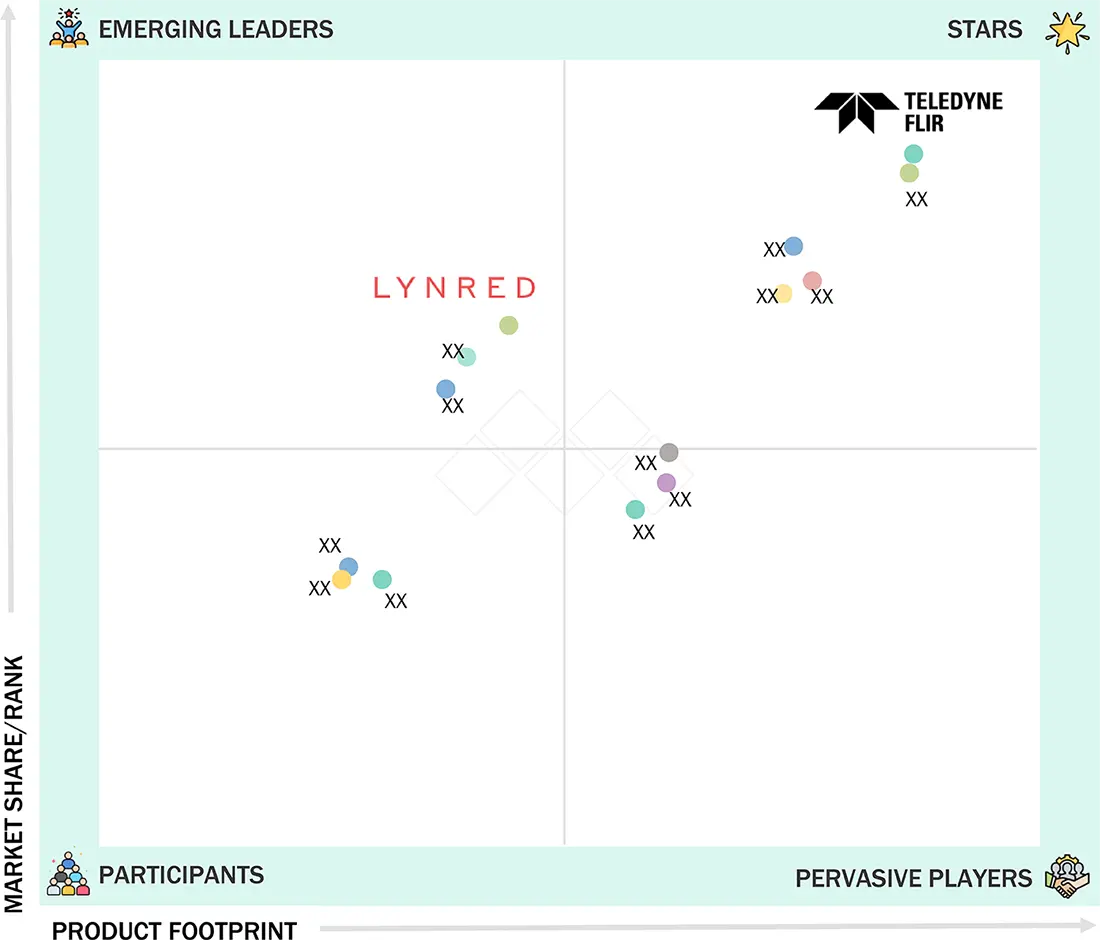
Infrared Imaging Market: COMPANY EVALUATION MATRIX
Teledyne FLIR LLC (Star) leads with a strong market presence and a wide portfolio in the infrared imaging market matrix, driving large-scale adoption across industries like defence and industrial inspection. Lynred (Emerging Leader) is gaining traction with advanced cooled IR detectors in aerospace and security applications. While Teledyne FLIR dominates with scale, Lynred shows strong growth potential to advance toward the leaders' quadrant.
Source: Secondary Research, Interviews with Experts, MarketsandMarkets Analysis
KEY MARKET PLAYERS - Top Infrared Imaging Companies
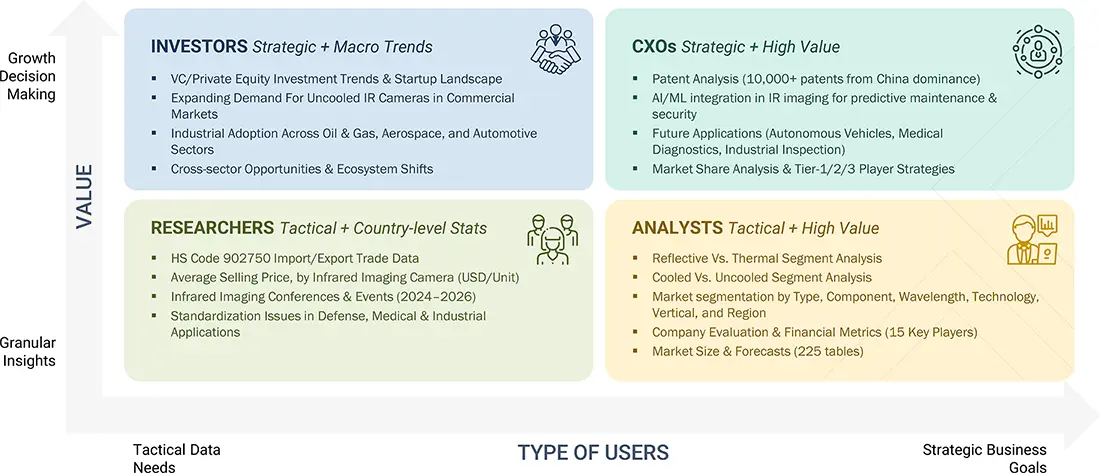
WHAT IS IN IT FOR YOU: Infrared Imaging Market REPORT CONTENT GUIDE
DELIVERED CUSTOMIZATIONS
We have successfully delivered the following deep-dive customizations:
| CLIENT REQUEST | CUSTOMIZATION DELIVERED | VALUE ADDS |
|---|---|---|
| US-based Infrared Imaging Manufacturer |
|
|
| Thermal Imaging-Based Manufacturer |
|
|
| Security & Surveillance Infrared Imaging Manufacturer |
|
|
| US-based Infrared Imaging Raw Material Supplier |
|
|
| Aerospace Infrared Imaging Customer |
|
|
RECENT DEVELOPMENTS
- June 2024 : Teledyne FLIR LLC (US) completed its acquisition of Adimec (Netherlands), a developer of high-performance industrial and scientific cameras. Known for delivering precise imaging for critical applications in life sciences and semiconductor inspection, Adimec joins Teledyne’s portfolio to strengthen its digital imaging capabilities across niche, accuracy-driven markets.
- September 2024 : Fluke Corporation (US) introduced the iSee Mobile Thermal Camera, a compact, smartphone-compatible tool designed for electricians, HVAC technicians, and contractors. Real-time thermal imaging capabilities enhance on-the-go inspections, enabling accurate temperature measurements in hard-to-reach areas while improving safety, portability, and convenience in professional thermal diagnostics.
- May 2024 : Axis Communications AB (Sweden) introduced the AXIS Q1961-XTE, the world’s first explosion-protected thermometric camera for Zone and Division 2 hazardous areas. Building on their 2023 innovation, this launch demonstrates Axis’ continued expansion in explosion-protected solutions, offering safer and cost-efficient temperature monitoring for high-risk industrial environments.
- September 2023 : Leonardo S.p.A. (US) unveiled its STAG-5 LLD, a next-gen 5-inch EO/IR stabilized gimbal designed for Group 1 UAS platforms. Equipped with high-definition LWIR, SWIR, EO sensors, and the TENUM 1280 core, it enhances military airborne ISR operations with superior imaging, reduced weight, and MOSA compatibility.
- December 2024 : RTX (US) launched its advanced PC5 series thermal cameras, designed for forest fire prevention and perimeter surveillance. With multi-spectral capabilities, real-time analytics, and long-range detection, the compact PC5 enhances environmental safety and security with high-resolution thermal and visible imaging, making it ideal for 24/7 outdoor monitoring.
Table of Contents
 Exclusive indicates content/data unique to MarketsandMarkets and not available with any competitors.
Methodology
The study involved four major activities in estimating the current size of the infrared imaging market—exhaustive secondary research collected information on the market, peer, and parent markets. The next step was to validate these findings, assumptions, and sizing with industry experts across the value chain through primary research. Both top-down and bottom-up approaches were employed to estimate the complete market size. After that, market breakdown and data triangulation were used to estimate the market size of segments and subsegments.
Secondary Research
The secondary research process involved referring to various secondary sources to identify and collect necessary information for this study. The secondary sources include annual reports, press releases, and investor presentations of companies; white papers; journals and certified publications; and articles from recognized authors, websites, directories, and databases. Secondary research was conducted to obtain critical information about the industry’s supply chain, the market’s value chain, the total pool of key players, market segmentation according to the industry trends (to the bottom-most level), regional markets, and key developments from market- and technology-oriented perspectives. The secondary data was collected and analyzed to determine the overall market size, further validated by primary research.
List of major secondary sources
|
Source |
Web Link |
|
Company Blogs |
https://www.lynred.com/blog/what-makes-infrared-market-unique |
|
News |
|
|
Infrared Commission on Non-ionizing Radiation Protection |
Primary Research
In the primary research process, various primary sources from both the supply and demand sides were interviewed to obtain qualitative and quantitative information for this report. The primary sources from the supply side included industry experts, such as chief executive officers (CEOs), vice presidents (VPs), marketing directors, technology and innovation directors, and related key executives from various key companies and organizations operating in the infrared imaging market. After the complete market engineering (calculations for market statistics, market breakdown, market size estimations, market forecasting, and data triangulation), extensive primary research was conducted to gather information and verify and validate the critical numbers arrived at. Primary research was also conducted to identify the segmentation types, industry trends, competitive landscape of infrared imaging solutions offered by various market players, and key market dynamics, such as drivers, restraints, opportunities, challenges, industry trends, and key player strategies.
In the complete market engineering process, the top-down and bottom-up approaches and several data triangulation methods were extensively used to perform the market estimation and market forecasting for the overall market segments and subsegments listed in this report. Extensive qualitative and quantitative analysis was performed on the complete market engineering process to list the key information/insights throughout the report.

Note: Other designations include sales, marketing, and product managers.
The three tiers of the companies were defined based on their total revenue as of 2024: tier 1: revenue greater than USD 1 billion, tier 2: revenue between USD 500 million and USD 1 billion, and tier 3: revenue less than USD 500 million.
To know about the assumptions considered for the study, download the pdf brochure
Market Size Estimation
In the complete market engineering process, top-down and bottom-up approaches and several data triangulation methods were used to estimate and forecast the overall market segments and subsegments listed in this report. Key players in the market were identified through secondary research, and their market shares in the respective regions were determined through primary and secondary research. This entire procedure includes the study of annual and financial reports of the top market players and extensive interviews for key insights (quantitative and qualitative) with industry experts (CEOs, VPs, directors, and marketing executives).
All percentage shares, splits, and breakdowns were determined using secondary sources and verified through primary sources. All the parameters affecting the markets covered in this research study were accounted for, viewed in detail, verified through primary research, and analyzed to obtain the final quantitative and qualitative data. This data was consolidated and supplemented with detailed inputs and analysis from MarketsandMarkets and presented in this report. The following figure represents this study’s overall market size estimation process.
Infrared Imaging Market : Top-Down and Bottom-Up Approach

Data Triangulation
After arriving at the overall market size from the above estimation process, the market was split into several segments and subsegments. The data triangulation procedure was employed wherever applicable to complete the overall market engineering process and arrive at the exact statistics for all segments and subsegments. The data was triangulated by studying various factors and trends from both the demand and supply sides. Additionally, the market size was validated using top-down and bottom-up approaches.
Market Definition
Infrared imaging is an advanced technology that captures images of the infrared (IR) spectrum beyond the visible light range. Infrared Cameras convert IR radiation into visible images using detectors from materials such as indium gallium arsenide (InGaAs) and mercury cadmium telluride (MCT or HgCdTe). This technology enables the detection of heat signatures and temperature variations, allowing users to identify heat leaks in buildings, electrical faults, and locate people or animals in low-light conditions. Infrared imaging is also widely applied in astronomy, medical diagnostics, industrial inspection, and environmental monitoring, making it a versatile tool across diverse sectors.
Key Stakeholders
- Infrared imaging product manufacturers
- Infrared imaging product traders/suppliers
- Raw material suppliers and distributors
- Research organizations and consulting companies
- Associations, organizations, forums, and alliances related to infrared technology
- Technology investors
- Governments, regulatory bodies, and financial institutions
- Venture capitalists, private equity firms, and startups
- End users
Report Objectives
- To define, describe, and forecast the infrared imaging market, in terms of value, by type, component, technology, wavelength, application, vertical, and region
- To provide the market size estimation for North America, Europe, Asia Pacific, and Rest of the World (RoW), along with their respective country-level market sizes, in terms of value
- To describe and forecast the infrared imaging market for reflective and thermal cameras, in terms of volume
- To provide information about two types of infrared imaging products: Portable and fixed
- To provide detailed information regarding the drivers, restraints, opportunities, and challenges that influence market growth
- To provide a detailed overview of the infrared imaging value chain, ecosystem analysis, Porter’s five forces analysis, case studies, tariff analysis, regulations, pricing analysis, patent analysis, AI impact, and US tariff impact
- To strategically analyze micromarkets with respect to individual growth trends, prospects, and contributions to the total market
- To analyze key trends related to components, connectivity technologies, and applications that shape and influence the global infrared imaging market
- To profile key players and comprehensively analyze their ranking based on their revenues and core competencies
- To analyze opportunities in the market for stakeholders and provide a detailed competitive landscape of the market
- To analyze competitive developments in the infrared imaging market, such as expansions, agreements, partnerships, contracts, product developments, and research and development (R&D) activities
Available customizations:
With the given market data, MarketsandMarkets offers customizations according to the specific requirements of companies. The following customization options are available for the report:
- Detailed analysis and profiling of additional market players (up to 5)
- Additional country-level analysis of the infrared imaging market
Product Analysis
- The product matrix provides a detailed comparison of the product portfolio of each company in the infrared imaging market.
Key Questions Addressed by the Report
What is the current size of the global infrared imaging market?
The global infrared imaging market is estimated at USD 8.61 billion in 2025. (MarketsandMarkets)
What will be the projected size of the infrared imaging market by 2030?
The market is projected to reach USD 11.65 billion by 2030, driven by increased adoption in defense, industrial, and surveillance applications. (MarketsandMarkets)
What is the growth rate (CAGR) of the infrared imaging market?
The infrared imaging market is expected to grow at a CAGR of 6.2% during 2025–2030. (MarketsandMarkets)
What are the major growth drivers of the infrared imaging market?
Key drivers include rising demand for non-contact thermal monitoring, predictive maintenance, defense surveillance, healthcare diagnostics, and industrial automation. (MarketsandMarkets)
What are the major trends in the infrared imaging industry?
Key trends include AI-integrated thermal imaging, miniaturized sensors, improved image resolution, drone-based surveillance, and smart infrastructure applications. (MarketsandMarkets)
Which industries use infrared (IR) sensing and imaging technology?
Major industries include defense & military, healthcare, automotive, manufacturing, energy, electronics, and security & surveillance. (MarketsandMarkets)
Which companies are leading in the infrared imaging market?
Key players include Teledyne FLIR LLC, Fluke Corporation, L3Harris Technologies, Leonardo S.p.A., Axis Communications AB, RTX, Opgal Optronic Industries, Lynred, Allied Vision Technologies, and BAE Systems. (MarketsandMarkets)
Which segment is expected to grow fastest in the infrared imaging market?
The reflective segment is expected to register the highest growth, while cameras dominate the component segment due to expanding industrial and security applications. (MarketsandMarkets)
Which region dominates the infrared imaging market?
North America leads with 47.1% market share in 2025, driven by strong defense spending and industrial adoption. (MarketsandMarkets)
What does the MarketsandMarkets infrared imaging report cover?
The report includes market sizing (2025–2030), segmentation by type, wavelength, component, technology, application, regional analysis, and competitive landscape with 260+ pages and 225+ tables. (MarketsandMarkets)
Need a Tailored Report?
Customize this report to your needs
Get 10% FREE Customization
Customize This ReportPersonalize This Research
- Triangulate with your Own Data
- Get Data as per your Format and Definition
- Gain a Deeper Dive on a Specific Application, Geography, Customer or Competitor
- Any level of Personalization
Let Us Help You
- What are the Known and Unknown Adjacencies Impacting the Infrared Imaging Market
- What will your New Revenue Sources be?
- Who will be your Top Customer; what will make them switch?
- Defend your Market Share or Win Competitors
- Get a Scorecard for Target Partners

Custom Market Research Services
We Will Customise The Research For You, In Case The Report Listed Above Does Not Meet With Your Requirements
Get 10% Free CustomisationTESTIMONIALS

Tetsuya Ohhira
Business Development Manager-Technology Business
Nikon Corporation,
Leading Japanese MNC specializing in optics and imaging productswww.nikon.com
MarketsandMarkets™ response
is quick. Their attitude is flexible and positive. Analyst Insights are globally considered and
significant. Client Services quickly respond to our inquiry and demand. Their wide range of global
surveys help us make our strategic plan.
We hope Knowledge Store will be easier to search
for a report.
VP - Marketing & Business Development
Leading Provider of Process Control Solutions
We engaged with MarketsandMarkets on a study to perform an analysis and recommend a Go-To-Market strategy for metrology and process control in the semiconductor market. The study was tailored to our targets and needs with well-defined milestones. Our overall experience with the MarketsandMarkets team was very good throughout the project in all aspects including the analysis methodologies used, the quality and depth of primary and secondary data sets, the professionalism and flexibility of the team and the ability to meet the target schedule and milestones. We want to thank MarketsandMarkets team for a job well done.
- US Infrared Imaging Market
- Canada Infrared Imaging Market
- Mexico Infrared Imaging Market
- Germany Infrared Imaging Market
- UK Infrared Imaging Market
- France Infrared Imaging Market
- Italy Infrared Imaging Market
- China Infrared Imaging Market
- Japan Infrared Imaging Market
- India Infrared Imaging Market
- Rest Of Europe Infrared Imaging Market
- Rest Of Asia Pacific Infrared Imaging Market
- Bahrain Infrared Imaging Market
- Kuwait Infrared Imaging Market
- Oman Infrared Imaging Market
- Qatar Infrared Imaging Market
Growth opportunities and latent adjacency in Infrared Imaging Market


Nicholas
Apr, 2026
What are the latest technological trends in infrared imaging, including cloud integration, AI-based imaging, and advancements in thermal cameras?.
Cary
Apr, 2026
How are different wavelength technologies (NIR, SWIR, MWIR, LWIR) used in infrared imaging, and which industries benefit most from each type?.
User
Sep, 2019
Thermal hyperspectral imagers provide information that conventional spectral imagers cannot. A broader range of materials can be detected, mapped, and sorted by thermal hyperspectral imagers. We are planning to expand our offerings in this area so wanted to know if insights on thermal hyperspectral imaging present in the report..
User
Sep, 2019
I can see that the SWIR technology is witnessing significant growth in the infrared imaging market. We are planning include SWIR technology based products in our product portfolio, so would like to have an estimate of the SWIR market in China, and South Korea..
User
Sep, 2019
We are into the business of providing infrared cameras, and want to explore the market for infrared sensors. We are particularly interested in volume data of IR sensors, is it covered in the study?.
User
Nov, 2019
LWIR and MWIR are the prominent technologies in the infrared market, while NIR and SWIR are the emerging ones. Can you tell me if the report analyzes the market between NIR, LWIR, MWIR, and SWIR technologies? .
User
Mar, 2019
My company is engaged in providing hardware and software solutions for infrared camera. Our solutions are aimed at automated process monitoring application. Is the information on this application available in the report?.