
Automated Border Control Market Size, Share & Trends

Automated Border Control Market by Solution Type (E-gates, Kiosks), Component Type [Hardware (Document Verification, Biometrics (Facial, Iris Recognition), Software, Services], Application (Airports, Seaports, Land Ports) - Global Forecast to 2030


OVERVIEW
Source: Secondary Research, Interviews with Experts, MarketsandMarkets Analysis
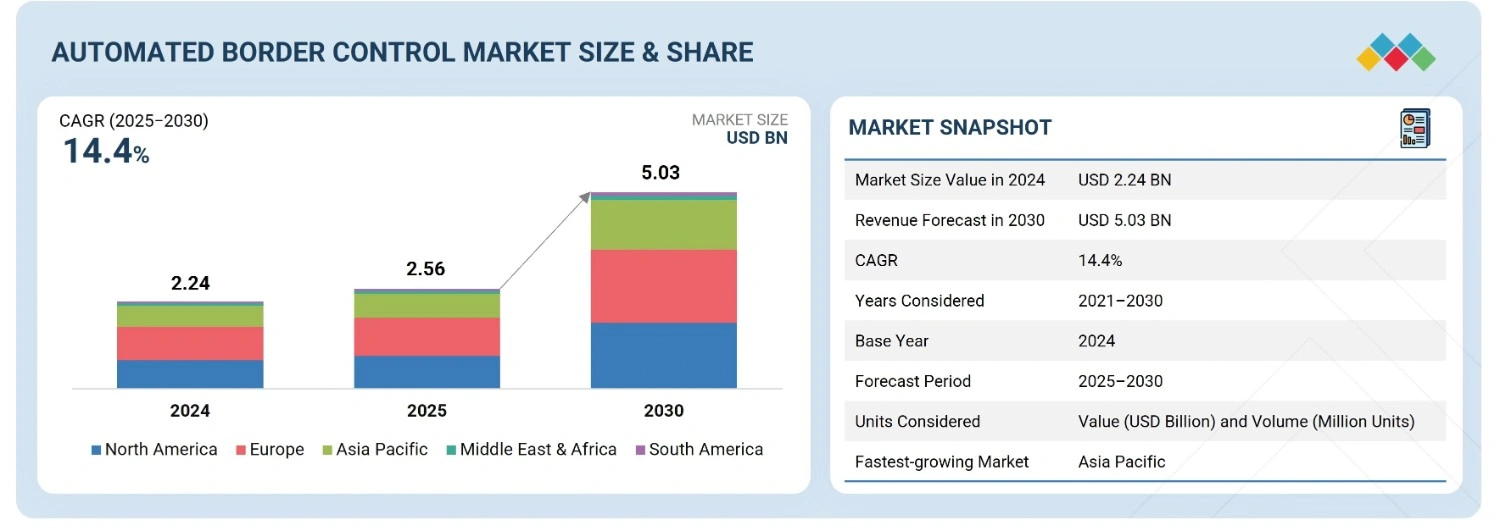
The automated border control market is projected to grow from USD 2.56 billion in 2025 to USD 5.03 billion by 2030, at a CAGR of 14.4% from 2025 to 2030. The market is driven by the rising volume of international passengers, the mounting demand for contactless and secure travel, and advancements in biometric technologies. With global travel recovering strongly, border agencies face pressure to process more passengers efficiently while maintaining high levels of security. Automated border control (ABC) systems, including eGates and biometric kiosks, enable rapid and accurate identity verification using facial recognition, fingerprint, or iris scanning, significantly reducing manual processing times and congestion
Market Size & Forecast
KEY TAKEAWAYS
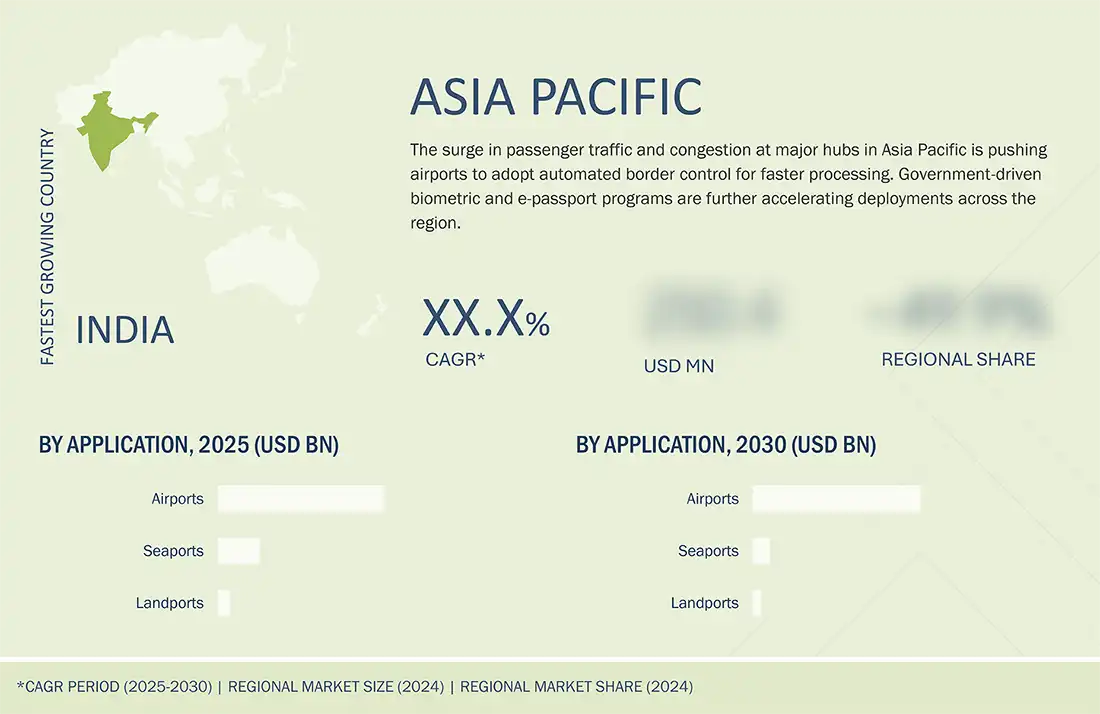
- The Asia Pacific automated border control market accounted 32.6% revenue share in 2024
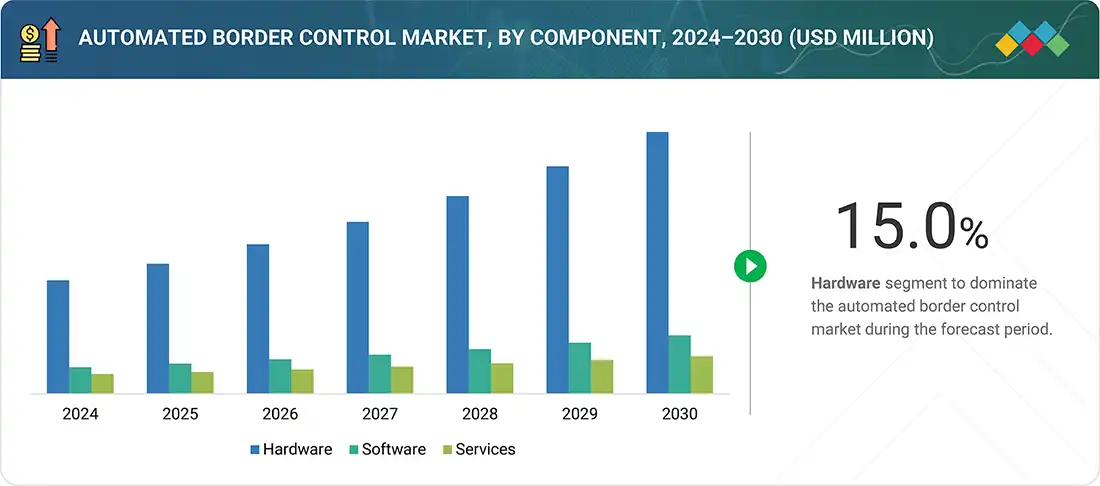
- By component, hardware is expected to register highest CAGR of 15.0%
- By application, the airports segment is expected to hold a share of 83.1% of the automated border control market in 2025.
- By solution type, e-gates segment is projected to grow fastest during the forecast period.
- The companies such Thales, Secunet Security Networks AG and IDEMIA were identified as Star players in the automated border control market, given their broad industry coverage and strong operational & financial strength.
- The companies such Securiport, BioID and Biolink among others have distinguished themselves among SMEs due to their well-developed marketing channels and extensive funding to build their product portfolios
The automated border control market growth can be attributed to the rise in the number of international passengers, the burgeoning demand for contactless and secure travel, and advances in biometric technologies. Due to the recovery in global travel, border agencies face pressure to process more passengers efficiently while maintaining high levels of security. Automated border control systems, including eGates and biometric kiosks, enable rapid and accurate identity verification using facial recognition, fingerprint, or iris scanning, reducing manual processing times and congestion.
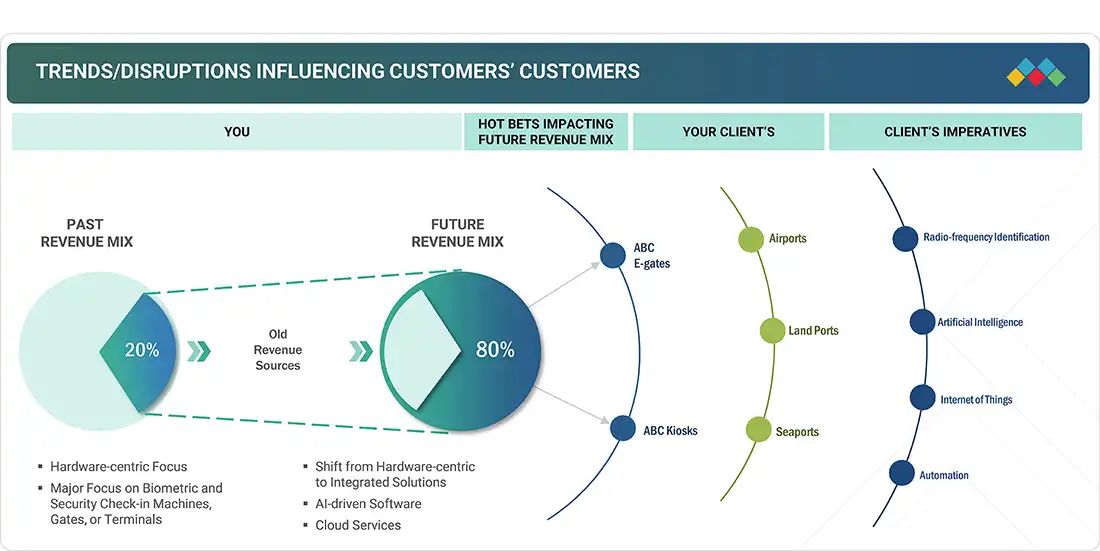
TRENDS & DISRUPTIONS IMPACTING CUSTOMERS' CUSTOMERS
The disruptions and emerging trends impacting customers’ businesses in the automated border control industry include the increasing demand for e-gates and kiosk solutions across various applications. Rising international passenger travel and increasing border security concerns led to the adoption of automated border control systems. These are the factors driving the market. ABC system manufacturers can generate new revenue streams by utilizing IoT and AI in the R&D of these systems.
Source: Secondary Research, Interviews with Experts, MarketsandMarkets Analysis
MARKET DYNAMICS
Level
-
Increasing number of international passengers traveling across borders

-
Growing security concerns at land ports, airports, and seaports

Level
-
Inconsistent security protocols across jurisdictions

-
High implementation costs

Level
-
Growing implementation of digital ID verification systems by governments and transportation organizations

-
Rising integration of artificial intelligence in automated border control systems

Level
-
Vulnerability to cyber threats

Source: Secondary Research, Interviews with Experts, MarketsandMarkets Analysis
Driver: Growing security concerns at land ports, airports, and seaports
Border security is one of the significant concerns globally, ranging from terrorism to drug trafficking and illegal immigration. Automated border control (ABC) systems can help address these concerns by incorporating advanced biometric authentication and other security measures. Moreover, increased global trade has resulted in high-level scanning and inspection technologies to prevent the entry of goods, weapons, and hazardous materials. ABC is an advanced security system with advanced biometrics systems, maintaining security at international border control points.
Restraint: : High initial implementation costs
The cost of implementing an ABC system involves the cost of research and design, equipment, staff, installation, and training. Significant investments are required at different stages of the value chain of ABC systems, especially R&D, manufacturing, system integration, assembly, and installation.
Opportunity: Rising integration of artificial intelligence into automated border control systems
The integration of AI in automated border control systems enables faster identity verification, enhanced accuracy, and predictive threat detection, creating opportunities for smarter, more secure border management globally.
Challenge: Vulnerability in cyber attacks
Automated border control systems face growing cybersecurity threats, where potential attacks can compromise sensitive passenger data and disrupt operations, challenging governments to maintain security and trust.
Automated Border Control Market: COMMERCIAL USE CASES ACROSS INDUSTRIES
| COMPANY | USE CASE DESCRIPTION | BENEFITS |
|---|---|---|
|
|
ABC eGates and integrated border/visa management that connect to national border systems and perform on-the-fly biometric verification | Faster throughput, lower queue times as well as scalable/modular hardware footprint for constrained spaces |
|
|
ABC eGate and kiosk portfolio for automated passport/border checks (sensor-rich eGates used in German/European airports) | Proven high security (anti-tailgating, robust sensors) and high throughput |
|
|
Multi-modal ABC gates (face/fingerprint), centralized supervisor for kiosks/gates and entry/exit authorization with proven roll-outs | Multi-biometric verification, centralized monitoring, stronger identity assurance and exception handling |
|
|
Biometric identity hub and self-service gates/kiosks plus mobile enrolment (face = boarding pass) to automate check-in → security → border → boarding flows | End-to-end passenger journey automation and mobile enrolment that reduces on-site friction and contact points |
|
|
Biometric walkthrough gates and ABC solutions (high-accuracy face recognition, large-scale walkthrough deployments — integration partnerships, e.g., with SITA). Recent deployments in major Japanese airports | Very fast passenger processing, mature face recognition, and flexible integration |
Logos and trademarks shown above are the property of their respective owners. Their use here is for informational and illustrative purposes only.
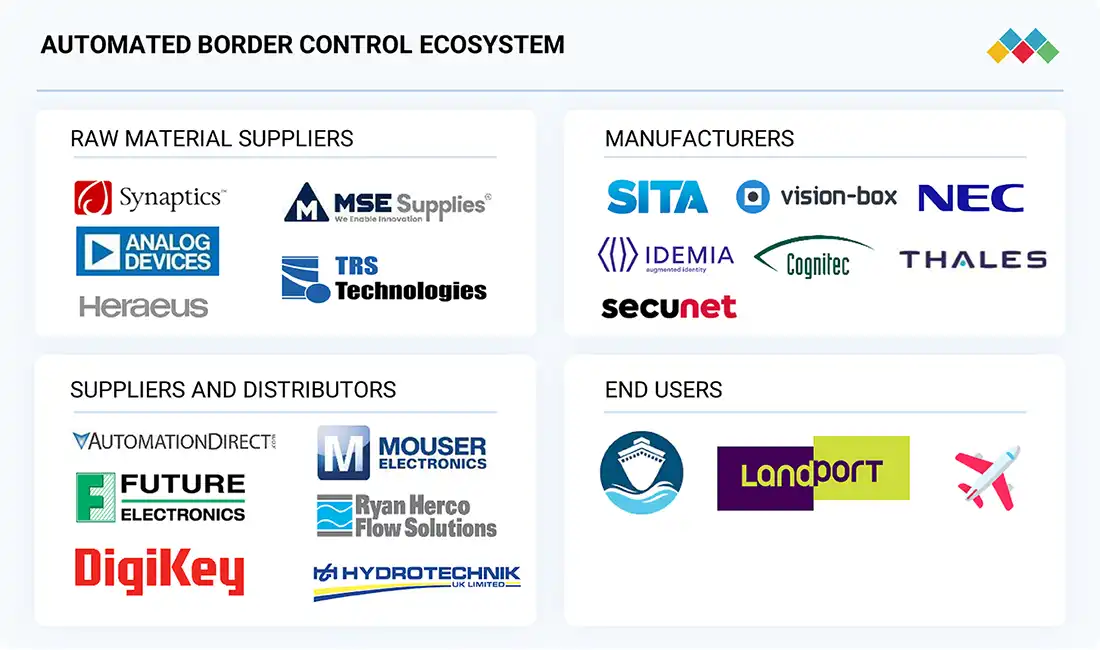
MARKET ECOSYSTEM
The automated border control ecosystem involves identifying and analysing interconnected relationships among stakeholders, including raw material suppliers, manufacturers, distributors, and end users. Raw material suppliers are manufacturers' source of components and semiconductor materials. The distributors and suppliers act as those who establish direct contact between the manufacturing companies and end users to concentrate the supply chain, increasing operational efficiency and profitability.
Logos and trademarks shown above are the property of their respective owners. Their use here is for informational and illustrative purposes only.
MARKET SEGMENTS
Source: Secondary Research, Interviews with Experts, MarketsandMarkets Analysis
Automated Border Control Market, By Solution Type
E-gates are expected to witness the highest CAGR among solution types in the automated border control market during the forecast period. This is primarily driven by the increasing demand for faster, contactless, and secure passenger processing at international airports, seaports, and land crossings. E-gates offer automated identity verification using biometric technologies, such as facial recognition, fingerprint scanning, and e-passport validation, significantly reducing passenger wait times and relieving pressure on border security personnel.
Automated Border Control Market, By Component
Hardware components are expected to contribute the largest share of the automated border control market due to the high demand for biometric devices, e-gates, and kiosks that enable secure passenger verification. Increasing airport expansions, investments in modern surveillance systems, and reliance on robust physical infrastructure further drive hardware adoption. Additionally, the need for accuracy, speed, and durability in high-traffic border points strengthens hardware’s dominance over software and services.
Automated Border Control Market, By Application
The airport application segment contributed to the largest share of the automated border control market in 2024 due to the surge in international air travel, heightened security requirements, and the global push for seamless passenger experiences. Airports face immense pressure to process large volumes of passengers efficiently while ensuring security and compliance with immigration laws. Automated border control systems, particularly e-gates and kiosks, help achieve this by enabling faster identity verification, reducing congestion, and minimizing human error.
REGION
Asia Pacific to be fastest-growing region in global automated border control market during forecast period
Asia Pacific is set to grow fastest in the automated border control market due to rapid growth in international air travel, massive airport modernization projects, and government focus on strengthening border security. Rising adoption of biometric technologies, digital ID programs, and smart city initiatives further accelerate the deployment across airports, seaports, and landports in countries such as China, Japan, South Korea, and India.
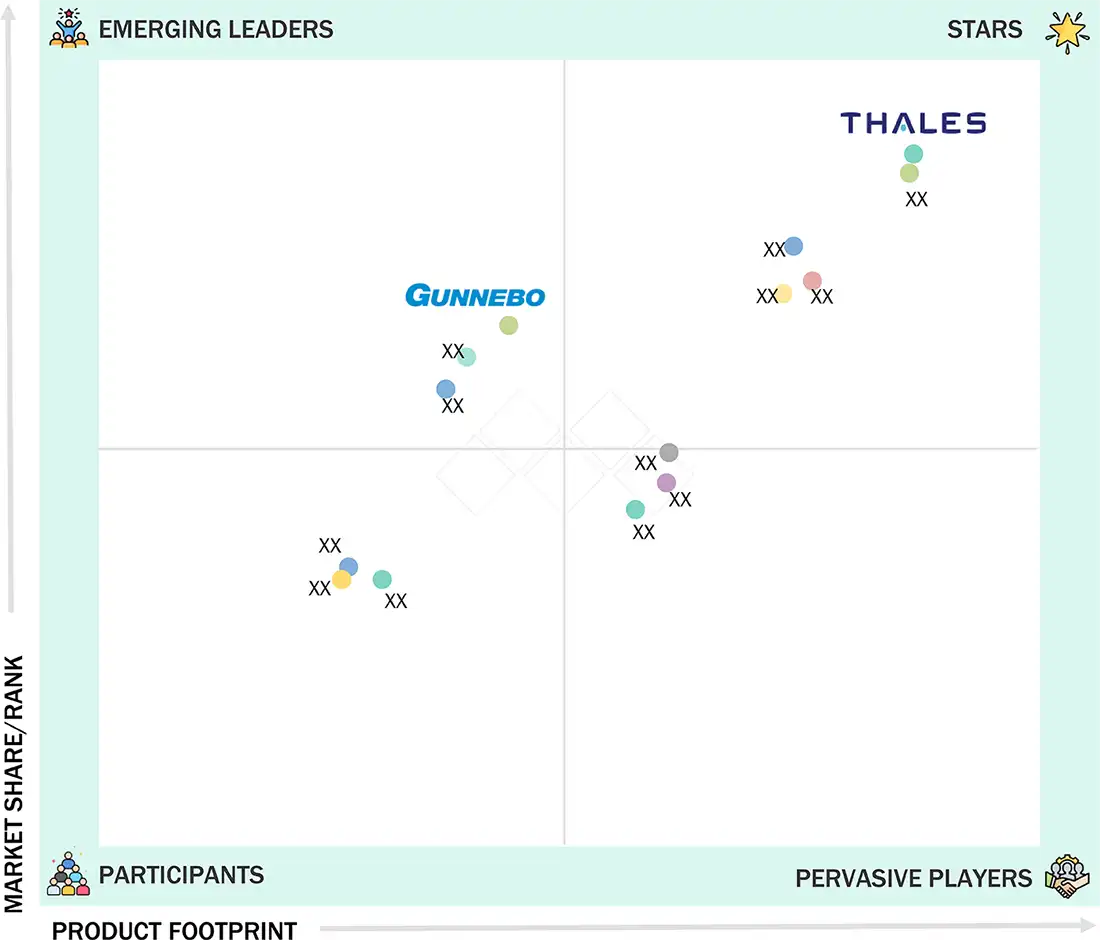
Automated Border Control Market: COMPANY EVALUATION MATRIX
In the automated border control market matrix, Thales (Star) leads with a strong market presence and an extensive product portfolio, enabling widespread adoption across airports, landports, and seaports. Gunnebo AB (Emerging Leader) is steadily gaining traction with innovative solutions focused on similar applications. While Thales dominates through scale, an established customer base, and advanced biometric and integrated security solutions , Gunnebo AB focuses on cost-effective, modular ABC systems for scalable border control deployment.
Source: Secondary Research, Interviews with Experts, MarketsandMarkets Analysis
KEY MARKET PLAYERS - Automated Border Control Companies
MARKET SCOPE
| REPORT METRIC | DETAILS |
|---|---|
| Market Size in 2024 (Value) | USD 2.24 Billion |
| Market Forecast in 2030 (Value) | USD 5.03 Billion |
| Growth Rate | CAGR of 14.4% from 2025–2030 |
| Years Considered | 2021–2030 |
| Base Year | 2024 |
| Forecast Period | 2025–2030 |
| Units Considered | Value (USD Billion) and Volume (Million Units) |
| Report Coverage | Revenue Forecast, Company Ranking, Competitive Landscape, Growth Factors, and Trends |
| Segments Covered |
|
| Regional Scope | North America, Asia Pacific, Europe, the Middle East, Africa, and South America |
WHAT IS IN IT FOR YOU: Automated Border Control Market REPORT CONTENT GUIDE
DELIVERED CUSTOMIZATIONS
We have successfully delivered the following deep-dive customizations:
| CLIENT REQUEST | CUSTOMIZATION DELIVERED | VALUE ADDS |
|---|---|---|
| US-based ABC Adoption |
|
|
| Asian ABC Manufacturer |
|
|
| European Airport Authority |
|
|
| US-based Technology Stakeholder for Airport/Seaport/landport |
|
|
| Material Provider |
|
|
RECENT DEVELOPMENTS
- April 2025 : The Saudi Data and AI Authority (SDAIA) deployed 152 e-gates across major airports, including Riyadh, Jeddah, Dammam, and Madinah, integrating visa, biometric, and airline databases to speed up immigration and align with the country’s Vision?2030 smart border strategy.
- January 2025 : Chennai International began rolling out biometric e-gates. The system links boarding pass scanning with facial recognition, reducing immigration time from ~25?sec to ~10?sec per traveler. It integrates seamlessly with international border and security databases, reinforcing India’s Digi Yatra and IATA One ID initiatives.
- November 2024 : Vision-Box announced the successful completion of its Seamless Border Programme with the opening of the new and reconstructed arrivals area in collaboration with Princess Juliana International Airport (PJIAE) in Sint Maarten. This development is set to provide a more efficient, secure, and pleasant travel experience for all passengers arriving at PJIAE.
- October 2024 : Thales unveiled its latest modular biometric e-gates featuring ultra-fast facial recognition (sub-2?sec matching), global e-passport authentication, and flexible form factors (single/dual-door or kiosks). These gates aim to streamline border control while reducing space and boosting passenger dwell time.
- September 2024 : Ireland’s Department of Justice awarded a new contract to upgrade Automated Border Control e-gates at Dublin Airport to Vision-Box, a global provider of biometric border management solutions. This partnership continues Italy’s commitment to streamlining immigration processes and powering a modern, secure, and frictionless border experience at Dublin Airport.
Table of Contents
 Exclusive indicates content/data unique to MarketsandMarkets and not available with any competitors.
Methodology
The research process for this study included systematic gathering, recording, and analysis of data about customers and companies operating in the automated border control market. This process involved the extensive use of secondary sources, directories, and databases (Factiva and Oanda) to identify and collect valuable information for the comprehensive, technical, market-oriented, and commercial study of the automated border control market.
In-depth interviews were conducted with primary respondents, including experts from core and related industries and preferred manufacturers, to obtain and verify critical qualitative and quantitative information and assess growth prospects. Key players in the automated border control market were identified through secondary research, and their market rankings were determined through primary and secondary research. This research included studying annual reports of top players and interviewing key industry experts, such as CEOs, directors, and marketing executives.
Secondary Research
Various sources were used in the secondary research process to identify and collect information important for this study. These include company annual reports, press releases, investor presentations, white papers, technology journals, certified publications, articles by recognized authors, directories, and databases.
Secondary research was mainly used to obtain key information about the industry’s value chain, the total pool of market players, the market classification according to industry trends to the bottom-most level, regional markets, and key developments from market and technology-oriented perspectives.
Primary Research
Primary research was also conducted to identify the segmentation types, key players, competitive landscape, and key market dynamics, such as drivers, restraints, opportunities, challenges, and industry trends, along with key strategies adopted by players operating in the automated border control market. Extensive qualitative and quantitative analyses were performed on the complete market engineering process to list key information and insights throughout the report.
Extensive primary research has been conducted after acquiring knowledge about the automated border control market scenarios through secondary research. Several primary interviews have been conducted with experts from the demand (application and region) and supply side (solution type) across four major geographic regions: North America, Europe, Asia Pacific, and RoW. Approximately 60% and 40% of the primary interviews were conducted from the supply and demand sides. These primary data have been collected through questionnaires, emails, and telephonic interviews.

Note: The three tiers of the companies have been defined based on their total/segmental revenue as of 2024: Tier 1 = >USD 1 billion, Tier 2 = USD 1 billion–USD 500 million, and Tier 3 = USD 500 million. ‘Others’ include sales, marketing, and product managers.
To know about the assumptions considered for the study, download the pdf brochure
Market Size Estimation
In the complete market engineering process, the top-down and bottom-up approaches and several data triangulation methods were implemented to estimate and validate the size of the automated border control market and various other dependent submarkets. Key players in the market were identified through secondary research, and their market share in the respective regions was determined through primary and secondary research. This entire research methodology included the study of annual and financial reports of the top players and interviews with experts (CEOs, VPs, directors, and marketing executives) for key insights (quantitative and qualitative).
All percentage shares, splits, and breakdowns were determined using secondary sources and verified through primary sources. All the possible parameters that affect the markets covered in this research study were accounted for, viewed in detail, verified through primary research, and analyzed to obtain the final quantitative and qualitative data. This data was consolidated and supplemented with detailed inputs and analysis from MarketsandMarkets and presented in this report.
Automated Border Control Market : Top-Down and Bottom-Up Approach

Data Triangulation
After arriving at the overall market size from the market size estimation process, as explained above, the total market has been split into several segments and subsegments. To complete the overall market engineering process and arrive at the exact statistics for all segments and subsegments, market breakdown and data triangulation procedures have been employed, wherever applicable. The data have been triangulated by studying various factors and trends from the demand and supply sides. Along with this, the market has been validated using top-down and bottom-up approaches.
Market Definition
The automated border control refers to the industry segment focused on deploying automated systems—eGates, biometric kiosks, facial recognition cameras, and document readers—to streamline and secure border crossing processes at airports, seaports, and land borders. These solutions verify traveler identities and authenticate documents with minimal human intervention, enhancing efficiency, reducing wait times, and strengthening security. The market includes hardware, software, and related services, such as installation and maintenance. Growing international travel, rising security concerns, and the push for contactless processing are key drivers of market expansion. Adoption is supported by government agencies and airport authorities worldwide, with initiatives such as ICAO’s TRIP and IATA’s One ID promoting standardization and interoperability.
Key Stakeholders
- Raw material and manufacturing equipment suppliers
- Automated border control hardware and software manufacturers
- Card readers and biometrics original equipment manufacturers (OEMs)
- ODM and OEM technology solution providers
- Suppliers and distributors
- System integrators
- Middleware providers
- Assembly, testing, and packaging vendors
- Research institutes and organizations
- Technology standards organizations, forums, alliances, and associations
- Technology investors
- Governments, financial institutions, and regulatory bodies
Report Objectives
- To define, describe, and forecast the automated border control market, by solution type, application, and component in terms of value
- To forecast the size of the market segments for four major regions—North America, Europe, Asia Pacific, and the Rest of the World (RoW), in terms of value
- To define, describe, and forecast the automated border control market, by solution type, in terms of volume
- To provide detailed information regarding the major drivers, restraints, opportunities, and challenges influencing the growth of the market
- To strategically analyze micromarkets with respect to individual growth trends, prospects, and contributions to the total market
- To study the complete value chain and allied industry segments, and perform a value chain analysis of the market
- To strategically profile the key players and comprehensively analyze their market shares and core competencies
- To analyze the opportunities in the market for stakeholders and describe the competitive landscape of the market
- To analyze competitive developments, such as collaborations, agreements, contracts, partnerships, mergers & acquisitions, product developments, and research & development (R&D), in the market
- To analyze the macroeconomic outlook for regions in the report
- To understand the impact of the 2025 US tariff and AI/Gen AI on the market
Available customizations:
With the given market data, MarketsandMarkets offers customizations according to the company’s specific needs. The following customization options are available for the report:
Key Questions Addressed by the Report
What strategies have been adopted by key companies in the automated border control market?
Product launches, partnerships, and contracts are some major strategies key players adopt to grow in the automated border control market.
Which region will dominate the automated border control market in the near future?
Europe and Asia Pacific are expected to dominate the automated border control market during the forecast period.
Which application will dominate the automated border control market between 2025 and 2030?
The airports segment is expected to dominate the automated border control market during the forecast period.
Why is the e-gates segment expected to capture the largest share of the automated border control market in 2030?
E-gates are set to capture the largest market share due to their high deployment at major international airports, enabling fast, secure, and contactless passenger processing. Their scalability, integration with biometric systems, and compliance with global border regulations make them the preferred choice for modern border control..
What are the major companies in the automated border control market?
Major players in the automated border control market include Thales (France), Secunet Security Networks AG (Germany), IDEMIA (France), SITA (Switzerland), Vision-Box (Portugal), NEC Corporation (Japan), Indra Sistemas, S.A. (Spain), Gunnebo AB (Sweden), and HID Global Corporation (US).
Need a Tailored Report?
Customize this report to your needs
Get 10% FREE Customization
Customize This ReportPersonalize This Research
- Triangulate with your Own Data
- Get Data as per your Format and Definition
- Gain a Deeper Dive on a Specific Application, Geography, Customer or Competitor
- Any level of Personalization
Let Us Help You
- What are the Known and Unknown Adjacencies Impacting the Automated Border Control Market
- What will your New Revenue Sources be?
- Who will be your Top Customer; what will make them switch?
- Defend your Market Share or Win Competitors
- Get a Scorecard for Target Partners

Custom Market Research Services
We Will Customise The Research For You, In Case The Report Listed Above Does Not Meet With Your Requirements
Get 10% Free Customisation
Still Researching the
Automated Border Control Ecosystem?
See the competitors, opportunity evaluation, and growth signals shaping it - Instantly!
Generate 15+ consulting-grade strategic intelligence outputs - from competitor analysis to board-ready strategy decks, tailored to your Automated Border Control growth question.


Growth opportunities and latent adjacency in Automated Border Control Market