
AI In Education Market Forecast & Size

AI In Education Market by Software Type (Learning Management System (LMS), Adaptive Learning Platform, Chatbot & Virtual Assistant, Plagiarism Detection Tools), Technology, Academic Application (Predictive Analysis, Gamification) - Global Forecast to 2030


OVERVIEW
Source: Secondary Research, Interviews with Experts, MarketsandMarkets Analysis
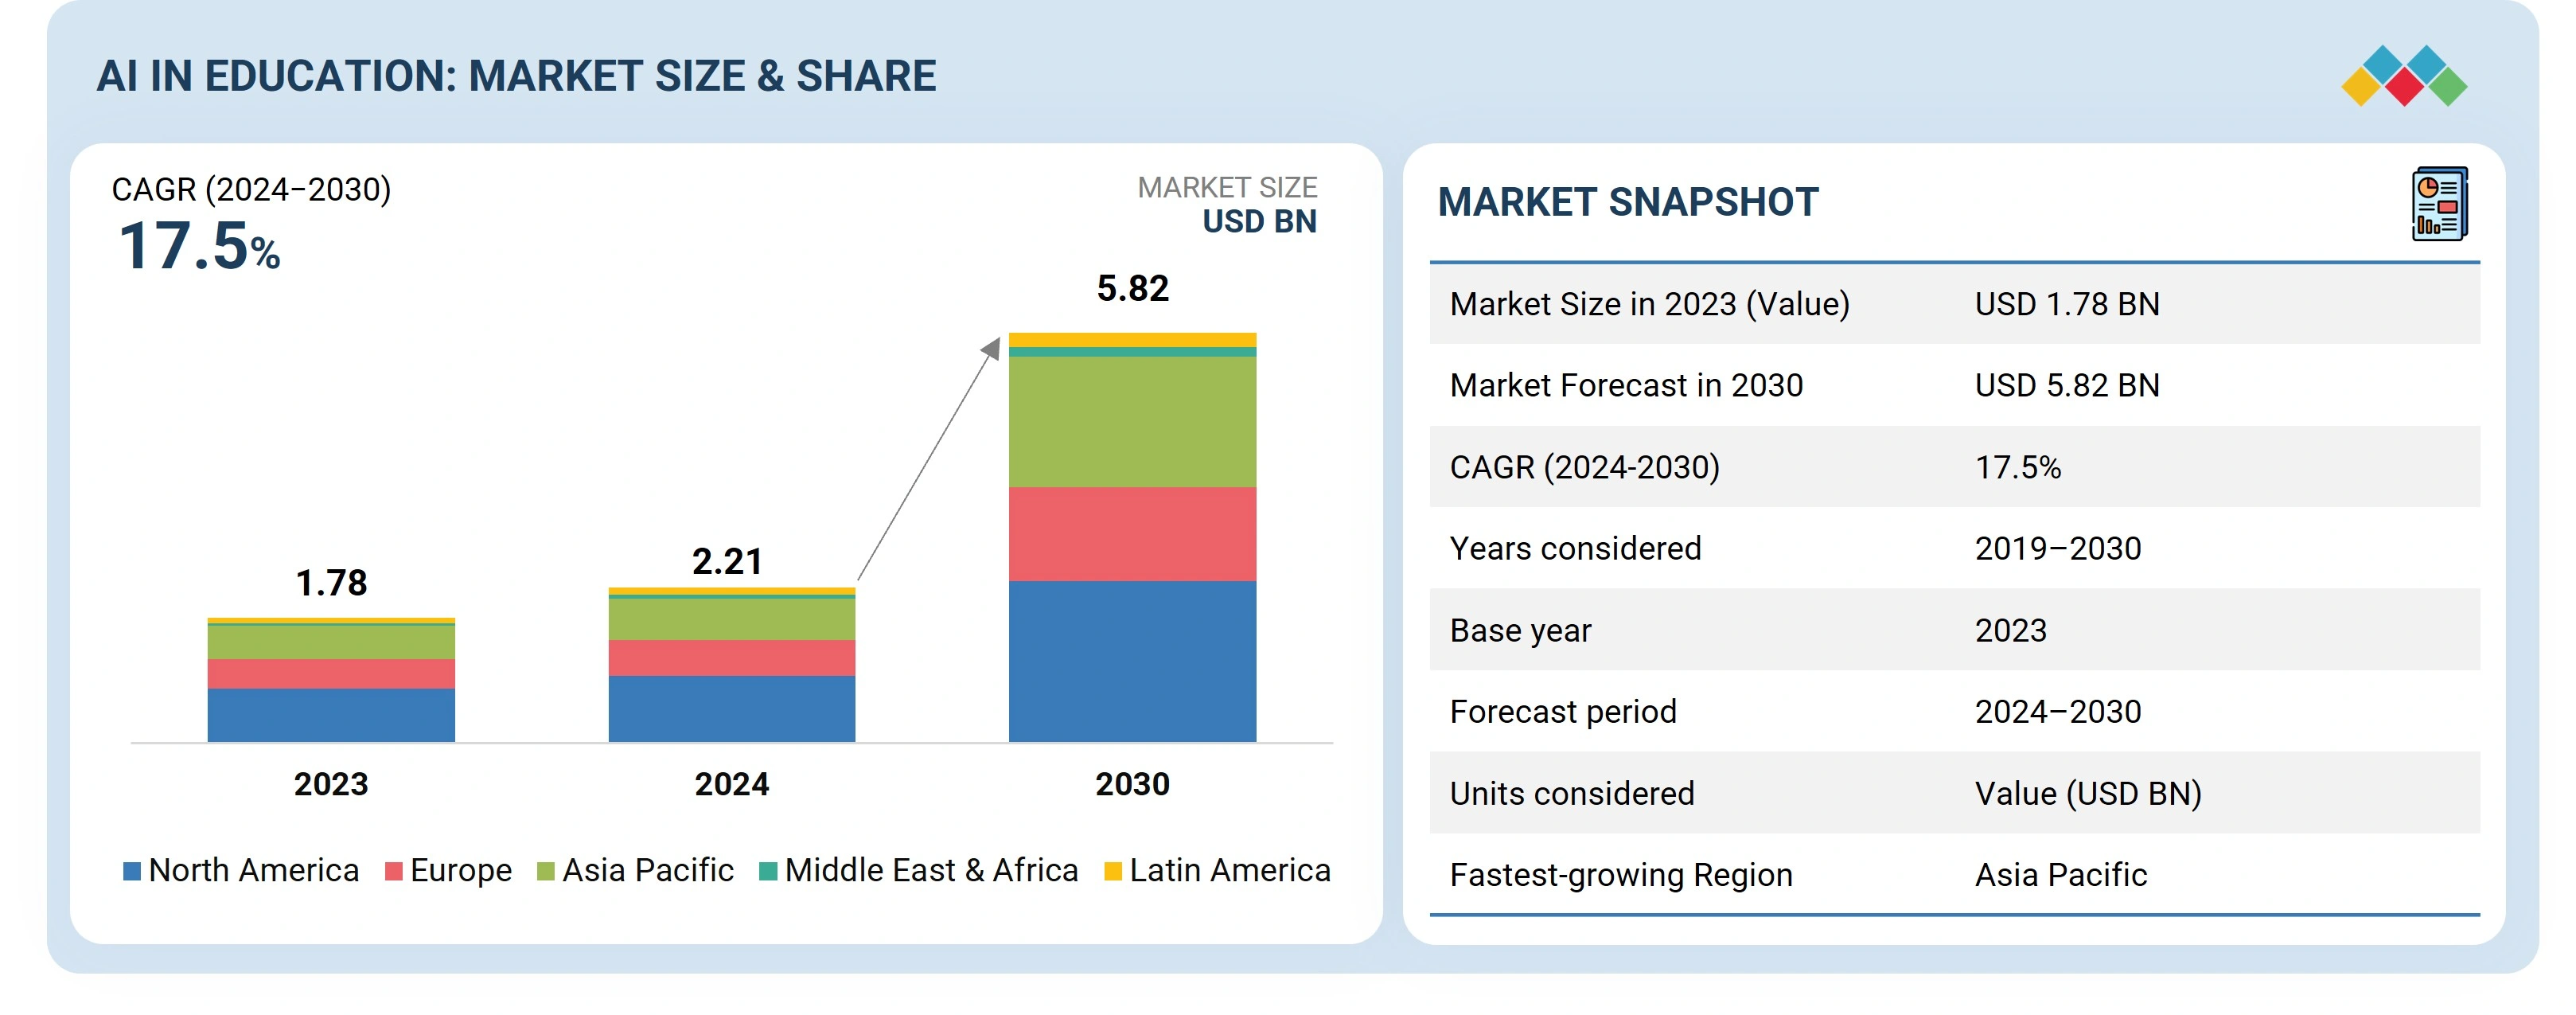
The AI in Education market is projected to grow from USD 2.21 billion in 2024 to USD 5.82 billion by 2030, registering a CAGR of 17.5%. This growth is driven by the sector’s accelerated shift toward digital transformation, where AI technologies are being embedded across learning platforms, tutoring mediums, and interactive educational applications. Vendors are increasingly positioning AI as a catalyst for personalized learning, adaptive content delivery, and data-driven student assessment. The integration of machine learning, natural language processing, and generative AI is enabling institutions to curate tailored content, automate feedback loops, and enhance engagement through game-based learning modules. As educational institutions seek to improve learning outcomes and operational efficiency, AI is being adopted not just as a tool for automation but as a strategic enabler of intelligent pedagogy, real-time performance tracking, and inclusive learning experiences. The rise of generative AI is further transforming curriculum design and instructional delivery, making content personalization and learner-centric models central to next-generation education systems.
Market Size and Forecast:
- 2023 Market Size: USD 1.78 Billion
- 2024 Projected Market Size: USD 2.21 Billion
- 2030 Forecasted Market Size: USD 5.82 Billion
- Growth Rate (2024-2030): CAGR of 17.5%
- Data available from 2019 to 2030
Key Market Trends and Insights
- Growth Driver: Rising demand for personalized learning accelerates AI in education market growth.
-
Growth Drivers: Generative AI, e-learning, and adaptive platforms drive AI in education adoption.
- Opportunities: AI tutors and curriculum personalization create new AI in education market opportunities.
- AI Impact: AI enables adaptive learning, automated assessments, and real-time student performance insights.
KEY TAKEAWAYS
- North America dominates the AI in Education market by 43% market share in 2024.
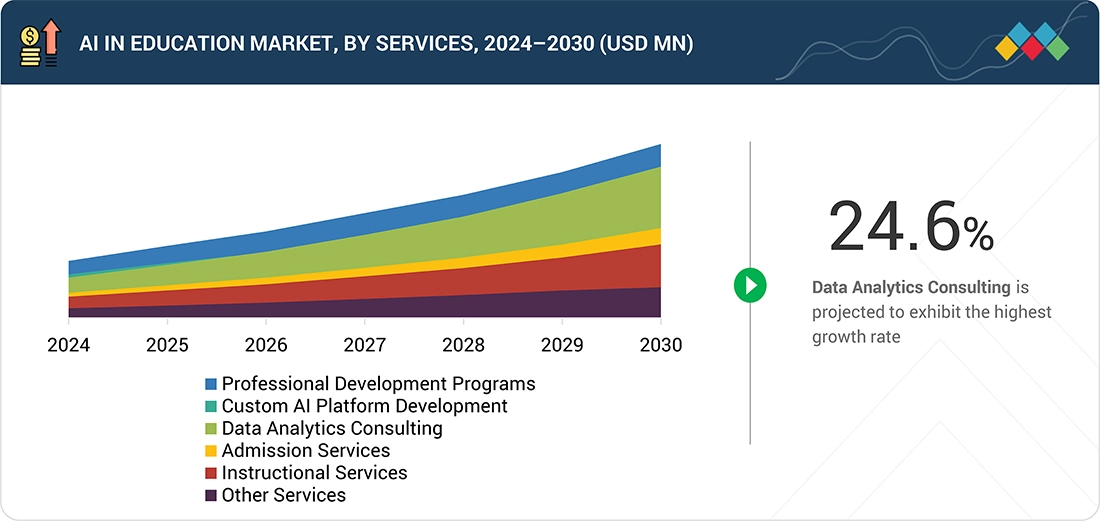
- By offering, the content generation tools is projected to register the highest CAGR of 19.1%, during the forecast period.
- By application, the personalized learning & content management segment dominates the market with 34.5% share in 2024.
- By technology, the generative AI segment is expected to be the fastest growing segment, during the forecast period.
- By end user, the K-12 segment is expected to dominate the market.
- Duolingo, Carnegie Learning and DreamBox Learning are identified as some of the star players in the AI in Education market, given their strong market share and product footprint.
- Blipper, 360Learning, and Riiid, among others, have distinguished themselves among startups and SMEs by securing strong footholds in specialized niche areas, underscoring their potential as emerging leaders.
The AI in Education market is undergoing rapid expansion, fueled by the rise of smart learning ecosystems, EdTech innovation, and competency-based education models powered by artificial intelligence. Institutions across K–12, higher education, and corporate training are increasingly adopting virtual classrooms, adaptive assessment engines, and automated student engagement platforms to deliver scalable, personalized learning experiences. Vendors are emphasizing the role of AI-driven learning analytics, intelligent content creation, and curriculum optimization in improving both operational efficiency and student outcomes. Strategic collaborations between EdTech providers and educational institutions, along with government-backed digital education initiatives, are accelerating the deployment of immersive learning tools, natural language generation, and AI-enabled tutoring systems. These technologies are reshaping pedagogy by enabling data-driven decision-making, real-time performance tracking, and outcome-focused instructional design, positioning AI as a foundational layer in the future of education.
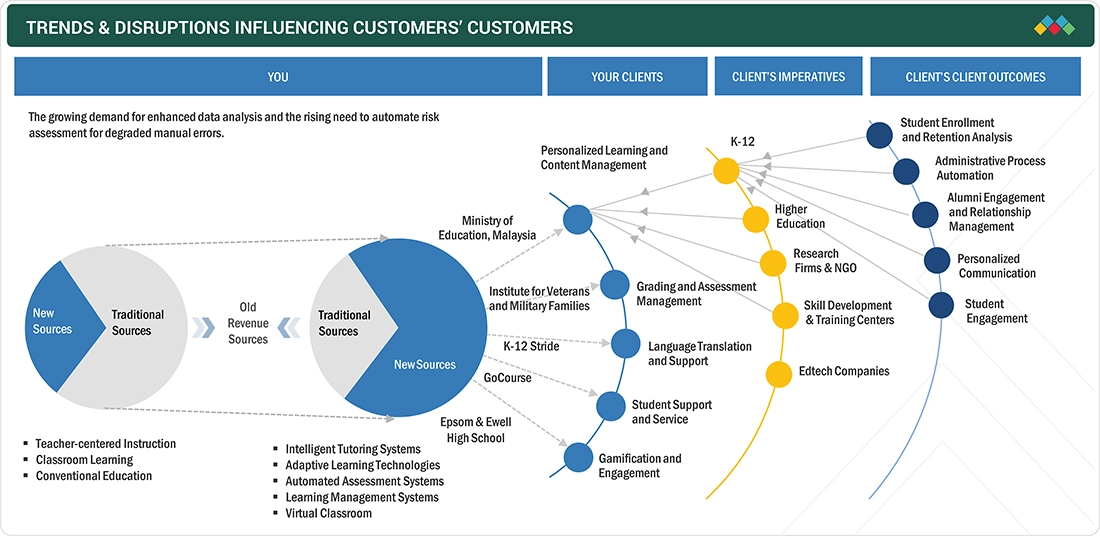
TRENDS & DISRUPTIONS IMPACTING CUSTOMERS' CUSTOMERS
The AI in education market is rapidly transforming as schools, universities, and EdTech companies increasingly leverage AI-driven insights for personalized learning, adaptive assessments, and data-driven decision-making. This growth is fueled by the demand for intelligent tutoring systems, predictive analytics, and tailored learning solutions that enhance student engagement and learning outcomes. Educational institutions use AI to optimize curriculum delivery, track performance metrics, and implement adaptive learning pathways. Real-time analytics, learning management system (LMS) integration, and automated administrative tools enable educators to make agile decisions. Privacy, data security, and compliance remain critical as AI adoption scales across K–12, higher education, and professional training sectors.
Source: Secondary Research, Interviews with Experts, MarketsandMarkets Analysis
MARKET DYNAMICS
Level
-
Increasing demand for personalized learning experiences.

-
Rising adoption of e-learning platforms and digital education tools.

Level
-
Reluctance among institutions to replace traditional teaching/learning methods.

Level
-
Adaptive Tech Unlocks Immersive Experiences.

-
Rise in demand for AI-powered assessment systems and real-time feedback

Level
-
Misuse of AI tools for unethical academic practices

Source: Secondary Research, Interviews with Experts, MarketsandMarkets Analysis
Driver: Increasing demand for personalized learning experiences
Adoption in education is being driven by the need for personalized learning pathways, scalable infrastructure, and data-informed instruction. Implementations are deploying cloud-native platforms, adaptive learning engines, and real-time analytics to enhance engagement and improve outcomes. For example, GetCourse leveraged cloud compute and storage to scale its platform, while Century Tech's AI-powered solution enabled personalized instruction and reduced teacher workload. These implementations reflect a broader market shift toward intelligent automation, student-centric pedagogy, and operational agility.
Restraint: Reluctance among institutions to replace traditional teaching/learning methods.
Adoption of AI in education continues to grow, yet institutional hesitation to overhaul traditional teaching models and concerns over data privacy, cybersecurity, and regulatory compliance remain significant barriers. Vendors recognize these challenges, with reports from Microsoft, EDUCAUSE, and AWS Education highlighting GDPR, FERPA, and escalating cyber threats as primary concerns. In response, leading providers are implementing privacy-first architectures, secure cloud infrastructures, and transparent AI governance frameworks, prominently featured in their offerings and whitepapers. Additionally, faculty enablement, ethical AI deployment, and robust governance structures are critical to mitigating risk, fostering trust, and driving adoption of AI-powered educational solutions.
Opportunity: Adaptive Tech Unlocks Immersive Experiences
AI presents significant opportunities to transform education through adaptive technologies, generative content creation, and immersive learning tools. Institutions are integrating virtual tutors, automated assessments, and AR/VR-enhanced instruction to support self-paced learning and improve accessibility. Stride’s use of generative AI to create interactive storytelling apps for K–12 learners exemplifies how vendors are enabling creative engagement, digital literacy, and personalized content delivery. These innovations position institutions to expand reach, attract diverse learners, and differentiate through intelligent education ecosystems.
Challenge: Misuse of AI tools for unethical academic practices
The rise of generative AI has amplified concerns around academic integrity, with tools increasingly misused for plagiarism and content manipulation. Vendors are vocal about these risks, with Microsoft, Turnitin, and other academic integrity platforms developing plagiarism detection engines, usage monitoring tools, and ethical AI guidelines to safeguard learning environments. Institutions face the challenge of balancing innovation with accountability, ensuring AI-enhanced learning does not compromise ethical standards. This issue is prominently reflected in vendor events, product updates, and policy briefings, driving the creation of AI literacy programs, student integrity protocols, and transparent governance models to promote responsible AI adoption.
AI In Education Market: COMMERCIAL USE CASES ACROSS INDUSTRIES
| COMPANY | USE CASE DESCRIPTION | BENEFITS |
|---|---|---|
 |
GetCourse leveraged Alibaba Cloud’s Elastic Compute and Object Storage Services to enhance scalability, streamline operations, and ensure reliable performance for its rapidly expanding online education platform. | Alibaba Cloud delivered cost efficiency, flexible scaling, and responsive support, improving platform stability, operational agility, and user experience across GetCourse’s growing online education network. |
 |
Epsom and Ewell High School implemented Century Tech’s AI-powered adaptive learning platform to personalize education, reduce teacher workload, and improve student engagement through automated assessments and data-driven insights. | Century Tech enabled personalized learning, reduced administrative workload, and enhanced classroom engagement while equipping teachers with actionable analytics to deliver targeted support and improve overall learning outcomes. |
 |
Malaysia’s Ministry of Education adopted Google Cloud solutions, integrating Google Workspace and BigQuery to unify platforms, enhance digital access, and enable data-driven insights for improved learning outcomes nationwide. | Google Cloud improved digital accessibility, strengthened collaboration, and streamlined administration, empowering educators with real-time analytics to enhance teaching efficiency and student engagement across Malaysia’s education system. |
 |
Stride utilized Amazon Bedrock’s stable diffusion models to develop the Legend Library app, enabling K–12 students to create AI-generated stories and images for improved reading comprehension and engagement. | Amazon Bedrock empowered Stride to deliver secure, high-quality, and interactive learning experiences through Generative AI, enhancing content quality, ensuring data privacy, and accelerating innovation in digital education. |
Logos and trademarks shown above are the property of their respective owners. Their use here is for informational and illustrative purposes only.
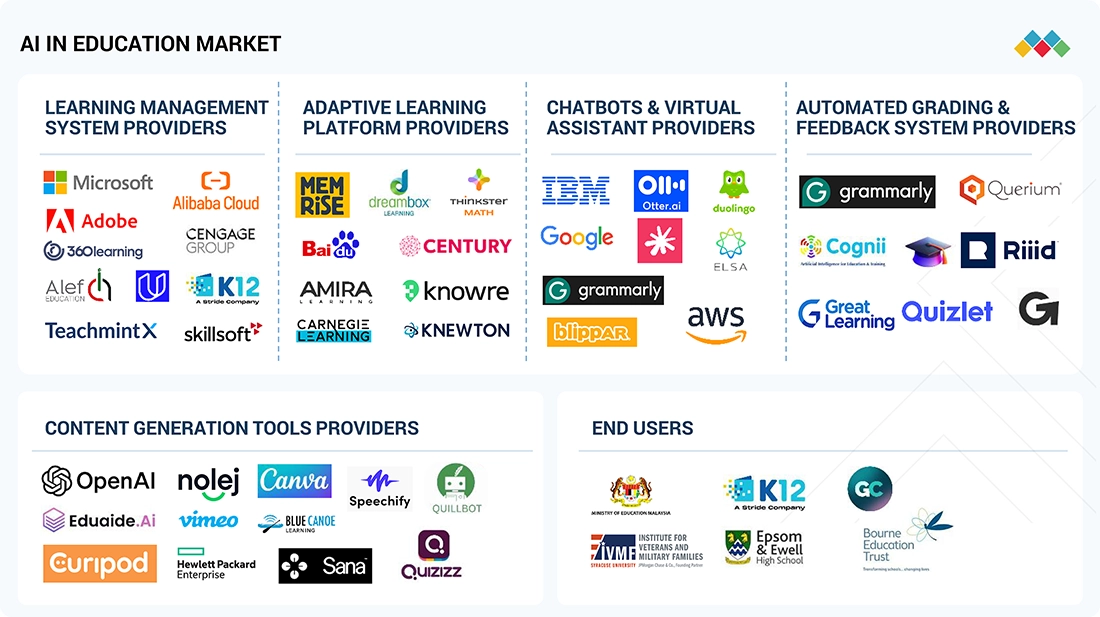
MARKET ECOSYSTEM
The AI in education market ecosystem comprises a diverse range of stakeholders. Key players include learning management system (LMS) providers, adaptive learning platform providers, chatbots & virtual assistants, automated grading and feedback system providers, and gen AI-based content generation tools. These entities collaborate to develop, deliver, and utilize AI-based education tools, driving innovation and growth in the market.
Logos and trademarks shown above are the property of their respective owners. Their use here is for informational and illustrative purposes only.
MARKET SEGMENTS
Source: Secondary Research, Interviews with Experts, MarketsandMarkets Analysis
AI in education Market, By Software Type
Content generation tools are emerging as one of the fastest-growing software type in the AI in education market. These platforms leverage AI to create dynamic educational materials, automated lesson plans, interactive quizzes, and multimedia content tailored to diverse learning styles. By integrating natural language processing, generative AI, and automated content personalization, these tools enhance student engagement and reduce instructional workload. Educational institutions and EdTech platforms increasingly adopt AI-powered content creation software to deliver scalable, adaptive learning experiences, improve curriculum quality, and optimize teaching efficiency, making it a high-demand, revenue-driving segment globally.
AI in education Market, By Technology
Generative AI is a leading technology segment propelling the AI in education market. It powers intelligent content creation, automated tutoring, adaptive simulations, and interactive learning experiences. By utilizing machine learning models, natural language generation, and image/audio synthesis, generative AI enables highly personalized educational materials, scenario-based learning, and immersive digital classrooms. Schools, universities, and EdTech companies deploy generative AI to enhance curriculum development, reduce instructor workload, and boost student engagement. With growing demand for AI-driven educational solutions, generative AI is transforming teaching methodologies and driving adoption across K–12, higher education, and professional training, positioning it as a high-growth technology.
AI in education Market, By Institutional Application
Workforce alignment and skills mapping are rapidly gaining traction as a key application of AI in education. Institutions leverage AI algorithms and predictive analytics to assess skill gaps, align learning programs with industry needs, and personalize training pathways for students and employees. By integrating competency-based assessments, labor market insights, and learning management systems (LMS), AI enables actionable workforce planning, improved employability, and targeted professional development. This segment benefits K–12, higher education, and corporate training programs seeking to bridge talent shortages, upskill learners, and enhance career readiness, making it a critical driver of market growth.
AI in education Market, By Institutional End user
EdTech companies represent the fastest-growing institutional end-user segment in the AI in education market. These organizations integrate AI-driven solutions such as adaptive learning platforms, intelligent tutoring systems, predictive analytics, and automated assessment tools to deliver scalable, personalized learning experiences. By leveraging cloud-based LMS, generative AI content, and real-time performance tracking, EdTech firms enhance user engagement, optimize learning outcomes, and expand digital education offerings. Increasing investment in AI-powered solutions, growing student demand for interactive learning, and the need for efficient curriculum delivery position EdTech companies as the primary adopters driving revenue growth and innovation across global and Asia Pacific markets.
REGION
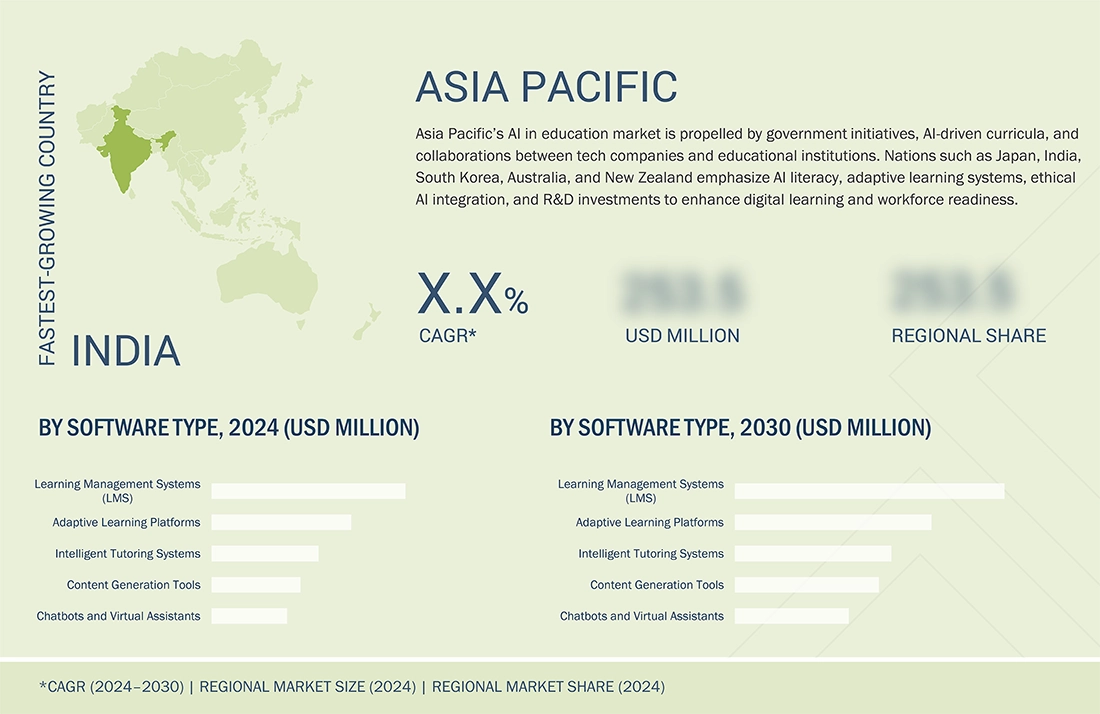
Asia Pacific to be the fastest-growing region in the AI in education market during the forecast period
Asia Pacific is emerging as the fastest-growing region in the AI in Education market, fueled by government-led digital transformation initiatives, regional education policies, and public-private partnerships. Vendors are witnessing strong adoption of adaptive learning systems, student engagement analytics, and AI-powered educational platforms, driven by a cultural emphasis on academic excellence and workforce readiness. These dynamics position Asia Pacific as a global leader in AI-driven education innovation, with increasing investments in infrastructure, training, and scalable digital learning ecosystems.
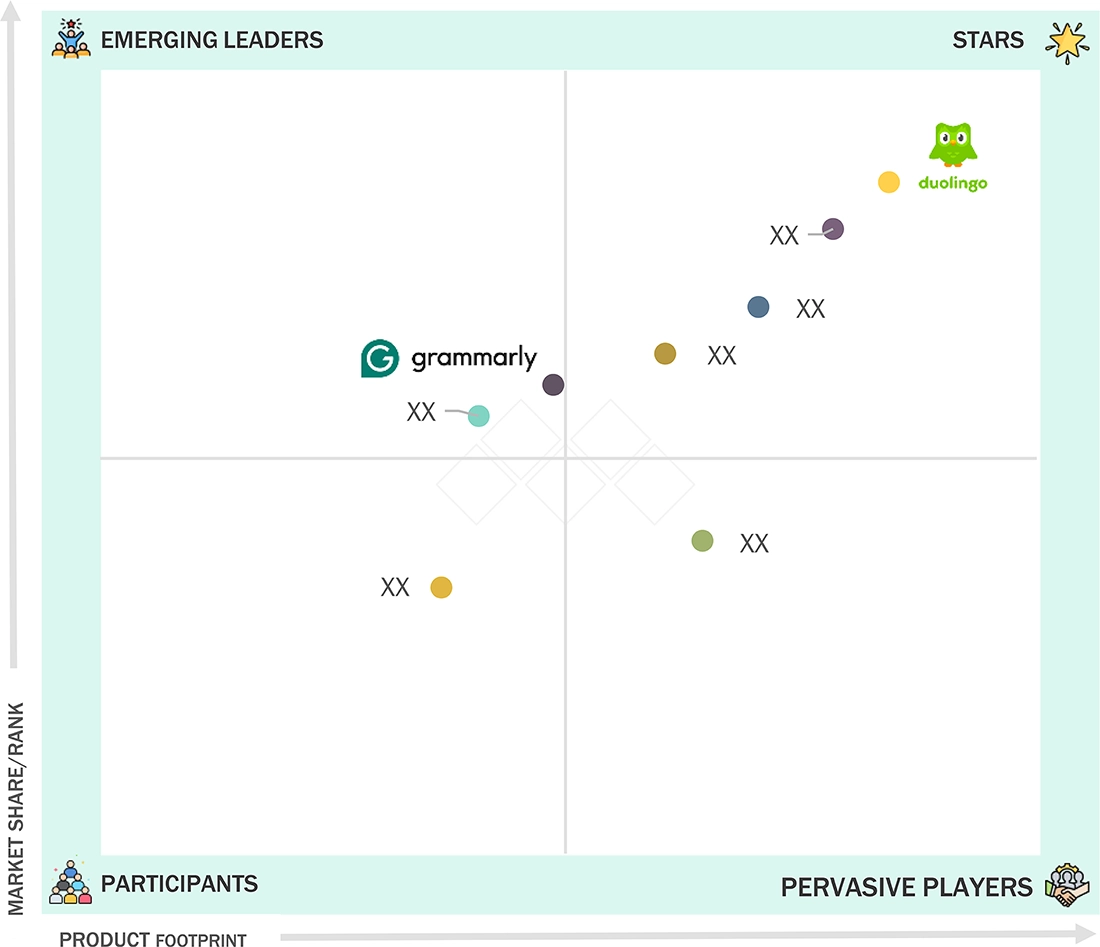
AI In Education Market: COMPANY EVALUATION MATRIX
In the AI in education market matrix, Duolingo (Star) leads with a strong market presence and a comprehensive suite of AI-driven learning solutions, enabling large-scale adoption in areas such as personalized language learning, adaptive assessments, student engagement analytics, and skill proficiency tracking. Grammarly (Emerging Leader) is gaining traction with its AI-powered writing assistance, real-time feedback, and adaptive learning models, helping students and professionals enhance writing skills, comprehension, and communication effectiveness. While Duolingo dominates with scale, innovation, and platform-wide integration, Grammarly demonstrates strong growth potential, steadily advancing toward the star quadrant.
Source: Secondary Research, Interviews with Experts, MarketsandMarkets Analysis
KEY MARKET PLAYERS
MARKET SCOPE
| REPORT METRIC | DETAILS |
|---|---|
| Market Size in 2023 (Value) | USD 1.78 Billion |
| Market Forecast in 2030 | USD 5.82 Billion |
| Growth Rate | CAGR of 17.5% during 2024-2030 |
| Years Considered | 2019-2030 |
| Base Year | 2023 |
| Forecast Period | 2024-2030 |
| Units Considered | Value (USD Billion) |
| Report Coverage | Revenue forecast, company ranking, competitive landscape, growth factors, and trends |
| Segments Covered |
|
| Regions Covered | North America, Asia Pacific, Europe, the Middle East & Africa, and Latin America |
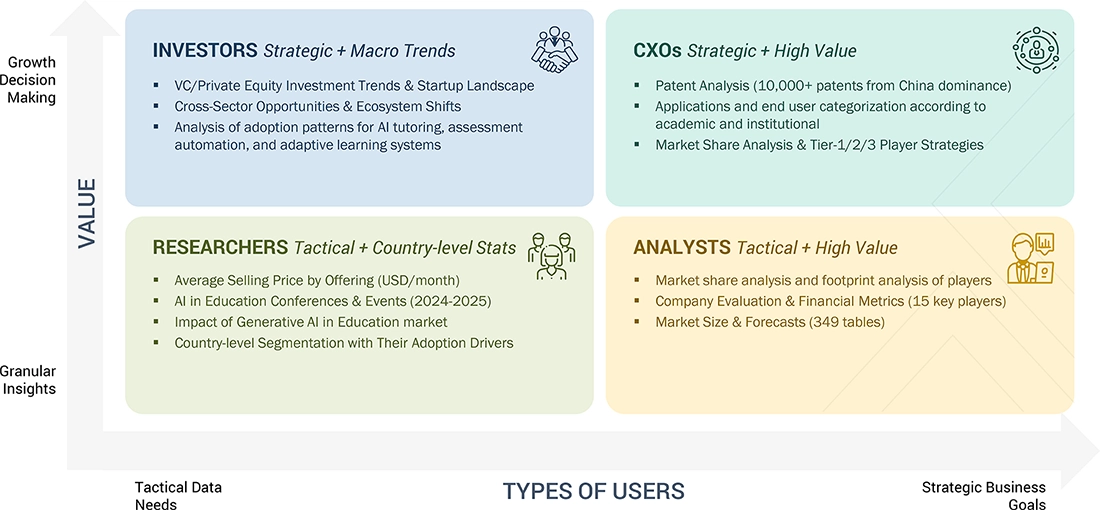
WHAT IS IN IT FOR YOU: AI In Education Market REPORT CONTENT GUIDE
DELIVERED CUSTOMIZATIONS
We have successfully delivered the following deep-dive customizations:
| CLIENT REQUEST | CUSTOMIZATION DELIVERED | VALUE ADDS |
|---|---|---|
| Leading Solution Provider (US) | Delivered competitive profiling of additional vendors, brand comparative analysis, and a drill-down of country-level segmentation across key markets. | Enabled competitive positioning insights, product differentiation clarity, and multi-country market intelligence, supporting go-to-market strategy refinement and stakeholder alignment. |
| Leading Solution Provider (Europe) | Provided competitive profiling, brand benchmarking, and segmentation analysis across additional geographies. | Delivered in-depth market insights, comparative brand positioning, and segment-level intelligence, empowering strategic decision-making and regional growth planning. |
RECENT DEVELOPMENTS
- October 2024 : Pearson expanded its partnership with ServiceNow to enhance workforce development and employee experiences in the age of AI. The partnership aims to address the growing skills gap by providing tailored training and reskilling opportunities, ultimately boosting productivity and talent retention. By combining expertise from both companies, this initiative seeks to prepare individuals and organizations for the future of work in an increasingly AI-driven economy.
- August 2024 : IBM partnered with the University of Wollongong India (UOW India) to enhance educational experiences and career readiness for students. This collaboration will provide access to IBM's Innovation Centre for Education, offering advanced training in emerging technologies such as AI, cloud computing, and cybersecurity. This initiative aims to strengthen UOW India's academic offerings and improve students' competitiveness in the global job market, preparing them for modern workforce demands.
- May 2024 : Khan Academy and Microsoft partnered to enhance access to AI tools for educators. This collaboration allows K-12 teachers in the U.S. to use the AI-powered teaching assistant Khanmigo for free, leveraging Microsoft’s Azure infrastructure. Khanmigo assists teachers by generating custom lesson plans and providing creative teaching suggestions, ultimately saving them time and reducing burnout. This initiative seeks to personalize learning and effectively support educators.
- April 2024 : Alibaba Cloud partnered with Hanyang University in South Korea to launch the Alibaba Cloud Academic Empowerment Program (AAEP), aimed at nurturing local digital talent. This initiative will provide students and educators with access to advanced cloud computing and AI technologies, enhancing their practical skills for the digital economy. The program includes seminars, workshops, and certification courses, allowing participants to gain professional qualifications. Alibaba Cloud's commitment to education is evident as it seeks to prepare graduates for future innovation and leadership in digital transformation across various industries in Korea.
- January 2024 : Arizona State University (ASU) collaborated with OpenAI to explore the integration of AI in higher education. This collaboration focuses on using OpenAI's technologies, including ChatGPT, to enhance student success, support research initiatives, and improve administrative processes. Initially, access will be granted to ASU faculty, staff, and researchers who can propose innovative applications for AI in academic settings. The partnership emphasizes responsible AI use while ensuring data privacy, positioning ASU as a leader in adopting AI technologies to transform educational experiences and operational efficiency within the institution.
Table of Contents
 Exclusive indicates content/data unique to MarketsandMarkets and not available with any competitors.
Methodology
The study involved major activities in estimating the current market size for the AI in education market. Exhaustive secondary research was done to collect information on the AI in education market. The next step was to validate these findings, assumptions, and sizing with industry experts across the value chain using primary research. Different approaches, such as top-down and bottom-up, were employed to estimate the total market size. After that, the market breakup and data triangulation procedures were used to estimate the market size of the segments and subsegments of the AI in education market.
Secondary Research
The market for the companies offering AI in education solutions is arrived at by secondary data available through paid and unpaid sources, analyzing the product portfolios of the major companies in the ecosystem, and rating the companies by their performance and quality. Various sources were referred to in the secondary research process to identify and collect information for this study. The secondary sources include annual reports, press releases, investor presentations of companies, white papers, journals, certified publications, and articles from recognized authors, directories, and databases.
In the secondary research process, various secondary sources were referred to for identifying and collecting information related to the study. Secondary sources included annual reports, press releases, and investor presentations of AI in education vendors, forums, certified publications, and whitepapers. The secondary research was used to obtain critical information on the industry’s value chain, the total pool of key players, market classification, and segmentation from the market and technology-oriented perspectives.
Primary Research
In the primary research process, various primary sources from both the supply and demand sides were interviewed to obtain qualitative and quantitative information for this report. The primary sources from the supply side included industry experts, such as Chief Executive Officers (CEOs), Vice Presidents (VPs), marketing directors, technology and innovation directors, and related key executives from various key companies and organizations operating in the AI in education market. After the complete market engineering (calculations for market statistics, market breakdown, market size estimations, market forecasting, and data triangulation), extensive primary research was conducted to gather information and verify and validate the critical numbers arrived at. Primary research was also conducted to identify the segmentation types, industry trends, competitive landscape of AI in education solutions offered by various market players, and key market dynamics, such as drivers, restraints, opportunities, challenges, industry trends, and key player strategies. In the complete market engineering process, the top-down and bottom-up approaches were extensively used, along with several data triangulation methods, to perform the market estimation and market forecasting for the overall market segments and subsegments listed in this report. Extensive qualitative and quantitative analysis was performed on the complete market engineering process to list the key information/insights throughout the report.

Note: Tier 1 companies account for annual revenue of >USD 10 billion; tier 2 companies’ revenue ranges
between USD 1 and 10 billion; and tier 3 companies’ revenue ranges between USD 500 million–USD
1 billion
To know about the assumptions considered for the study, download the pdf brochure
Market Size Estimation
Both top-down and bottom-up approaches were used to estimate and validate the total size of the cell culture market. These methods were also used extensively to estimate the size of various subsegments in the market. The research methodology used to estimate the market size includes the following:
AI In Education Market : Top-Down and Bottom-Up Approach

Data Triangulation
After arriving at the overall market size using the market size estimation processes explained above, the market was split into various segments and subsegments. The data triangulation and market breakup procedures were employed, wherever applicable, to complete the overall market engineering process and arrive at the exact statistics of each market segment and subsegment. The data was triangulated by studying various factors and trends from both the demand and supply sides.
Market Definition
AI in education refers to the deployment of underlying technologies such as discriminative machine learning, deep learning, NLP and generative AI to enhance the efficiency and efficacy of pedagogy and learning experience. It involves implementation of AI-based software across educational institutions to bolster and streamline administrative and operational processes and systems. From an academic perspective, this involves incorporation of AI-based platforms that can help tailor personalized learning modules and experiences to assist educational instructors to gauge, track and efficiently improve learning outcomes.
Stakeholders
- AI in education software developers
- AI in education service vendors
- Educators
- LMS Providers
- Instructors
- Government Educational Institutions
- Research Academic Firms
- Distributors and Value-added Resellers (VARs)
- Independent Software Vendors (ISV)
- Managed service providers
- Support & maintenance service providers
- System Integrators (SIs)/migration service providers
- OEMs
- Technology providers
Report Objectives
- To define, describe, and predict the AI in education market by offering (software by type, services, and deployment mode), application, end users, and region
- To provide detailed information related to major factors (drivers, restraints, opportunities, and industry-specific challenges) influencing the market growth
- To analyze the micro markets with respect to individual growth trends, prospects, and their contributions to the total market
- To analyze the opportunities in the market for stakeholders by identifying the high-growth segments of the AI in education market
- To analyze opportunities in the market and provide details of the competitive landscape for stakeholders and market leaders
- To forecast the market size of five main regions: North America, Europe, Asia Pacific, the Middle East & Africa, and Latin America
- To profile key players and comprehensively analyze their market rankings and core competencies
- To analyze competitive developments, such as partnerships, new product launches, and mergers & acquisitions, in the AI in education market
- To analyze the impact of the recession across all regions in the AI in education market
Available Customizations
With the given market data, MarketsandMarkets offers customizations as per your company’s specific needs. The following customization options are available for the report:
Product Analysis
- Product quadrant, which gives a detailed comparison of the product portfolio of each company.
Geographic Analysis as per Feasibility
Further breakup of the North American AI in education market
- Further breakup of the European AI in education market
- Further breakup of the Asia Pacific AI in education market
- Further breakup of the Middle Eastern & African AI in education market
- Further breakup of the Latin America AI in education market
Company Information
- Detailed analysis and profiling of additional market players (up to five)
Key Questions Addressed by the Report
What are the opportunities for the AI in education market?
The key opportunities for AI in the education market include enhanced customization of curriculum to individual student needs, rising demand for AI-powered assessment systems and real-time feedback, the advent of virtual tutors for self-paced learning, and the integration of AR and VR with AI for immersive learning experiences. Demand for AI-powered assessments and real-time feedback is rising, which enhances student engagement and learning outcomes.
Define the market for AI in education.
AI in education refers to the deployment of underlying technologies such as discriminative machine learning, deep learning, NLP, and generative AI to enhance the efficiency and efficacy of pedagogy and learning experience. It involves the implementation of AI-based software across educational institutions to bolster and streamline administrative and operational processes and systems. From an academic perspective, this involves the incorporation of AI-based platforms that can help tailor personalized learning modules and experiences to assist educational instructors in gauging, tracking, and efficiently improving learning outcomes.
Which region is estimated to have the largest share in the AI in education market?
The North American region set to acquire the largest share of the AI in education market during the forecast period.
Which are the major market players covered in the report?
Some of the key companies in market for AI in education are Microsoft (US), IBM (US), Google (US), Alibaba Cloud (China), AWS (US), Adobe (US), Pearson (UK), Baidu (China), OpenAI (US), Duolingo (US), Cengage Group (US), Knewton (US), Skillsoft (US), Udacity (US), Stride (US), HPE (US), Carnegie Learning (US), Dreambox Learning (US), Quizlet (US), Grammarly (US), Vimeo (US), Riiid (South Korea), Cognii (US), Elsa Speak (US), Memrise (UK), Alef Education (UAE), Querium (US), Amira Learning (US), Knowre (US), Century Tech (UK), Thinkster Math (US), Quizizz (India), Khan Academy (US), Sana Labs (Sweden), Teachmint X (India), 360Learning (US), Mainstay (India), Blippar (UK), Blue Canoe Learning (US), Otter.ai (US), QuillBot (US), Nolej (France), and Speechify (US).
How big is the global AI in education market today?
The global AI in education market is projected to grow from USD 2.21 billion in 2024 to USD 5.82 billion by 2030, at a CAGR of 17.5% during the forecast period.
What are the key trends and technologies in the AI in education market?
The key trends and technologies in the AI in education market include personalized learning platforms, AI-powered chatbots and virtual assistants, adaptive learning systems, gamification, predictive analytics, and generative AI for creating customized content. The market is also seeing growth in AI-driven educational robots and integration with education ERP systems. These innovations aim to enhance student engagement, automate administrative tasks, and improve learning outcomes.
What is the estimated annual growth rate of the AI in education market in North America during the projected years?
The North American AI in education market is expected to grow at a compound annual growth rate of 15.9% during the forecast period leading up to 2030.
Need a Tailored Report?
Customize this report to your needs
Get 10% FREE Customization
Customize This ReportPersonalize This Research
- Triangulate with your Own Data
- Get Data as per your Format and Definition
- Gain a Deeper Dive on a Specific Application, Geography, Customer or Competitor
- Any level of Personalization
Let Us Help You
- What are the Known and Unknown Adjacencies Impacting the AI In Education Market
- What will your New Revenue Sources be?
- Who will be your Top Customer; what will make them switch?
- Defend your Market Share or Win Competitors
- Get a Scorecard for Target Partners

Custom Market Research Services
We Will Customise The Research For You, In Case The Report Listed Above Does Not Meet With Your Requirements
Get 10% Free CustomisationTESTIMONIALS


Growth opportunities and latent adjacency in AI In Education Market