
AI Platform Market

AI Platform Market by Offering (Conversational AI, Generative AI, AI Agent, Deep Learning, Edge AI, AI API, MLOps, Data Mesh, Data Science Platforms), Functionality (Data Management, Model Development, Deployment, Training) - Global Forecast to 2030


OVERVIEW
Source: Secondary Research, Interviews with Experts, MarketsandMarkets Analysis
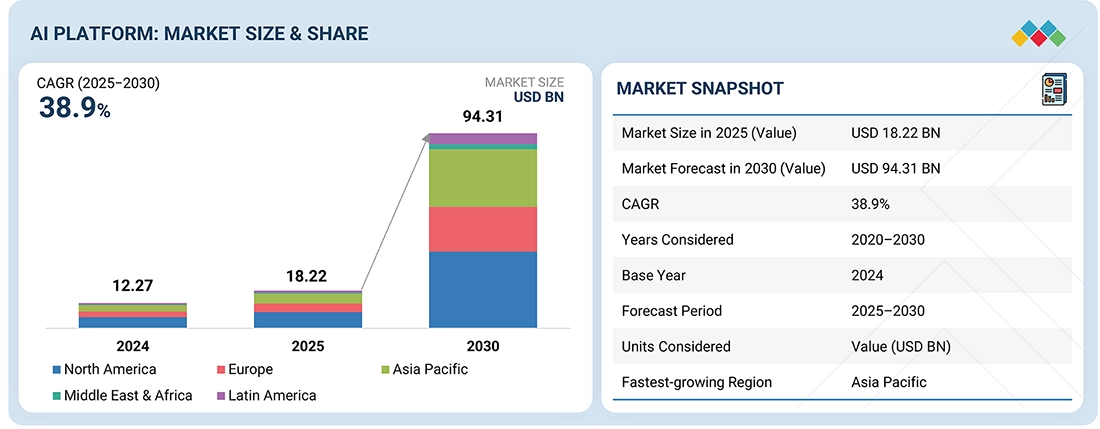
The AI platform market is experiencing strong growth, expected to increase from approximately USD 18.22 billion in 2025 to over USD 94.31 billion by 2030, with a CAGR of nearly 38.9%. According to GitHub’s Octoverse Report 2023, 92 million AI-focused repositories were created worldwide in 2023, reflecting the growing dependence on AI development platforms and tools. Stack Overflow’s 2024 survey also shows that 44% of professional developers now use AI-assisted development tools in their workflows. In Anthropic’s analysis of 500,000 developer-AI interactions, more than 59% of AI requests involved web-focused languages mainly aimed at user interface development. Segments positively influencing the market include AI development frameworks, automated machine learning (AutoML), MLOps platforms, and no-code/low-code AI solutions, which facilitate quicker model deployment and operational scalability.
Market Size and Forecast:
- 2024 Market Size: USD 12.27 Billion
- 2025 Projected Market Size: USD 18.22 Billion
- 2030 Forecasted Market Size: USD 94.31 Billion
- Growth Rate (2025-2030): CAGR of 38.9%
- Data available from 2020 to 2030
- Forecast period: 2025-2030
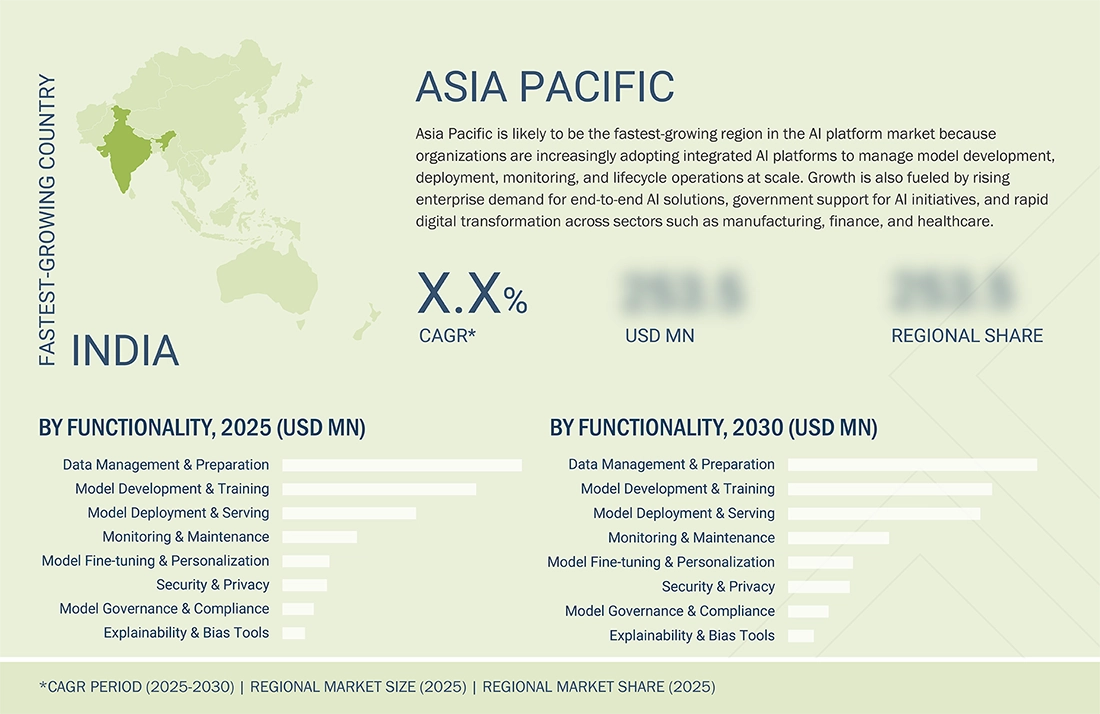
- Fastest Growing Region: Asia Pacific
- North America is expected to account for the largest market share, reaching 42.94% in 2025.
- The Model Deployment & Serving segment is expected to grow at the fastest CAGR of 44.2% by functionality.
Key Market Trends and Insights
- Key opportunities: integrating with business automation stacks and model interoperability.
-
Growth Factor: market is driven by demand for cross-model orchestration and domain-tuned foundation models.
- Latest Trends: multi-agent orchestration, MLOps, low-code frameworks, and healthcare-focused applications.
- Generative AI Transformation: streamlining code generation and content development through large language models.
KEY TAKEAWAYS
- By region, North America is projected to hold largest market share of 42.94% in 2025
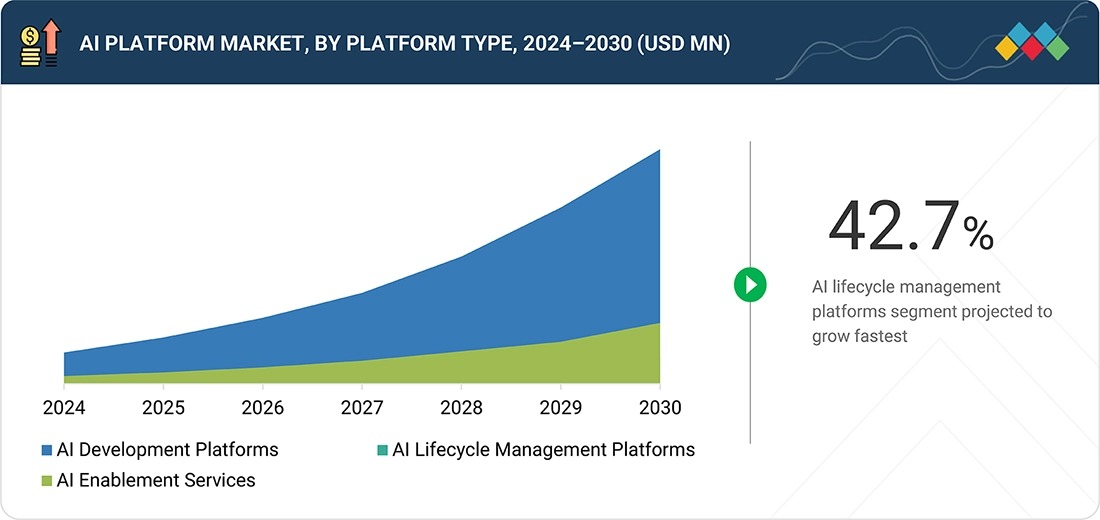
- By platform type, AI lifecycle management platforms are forecasted to grow at highest CAGR.
- By functionality, Model Deployment & Serving segment is estimated to grow at highest CAGR of 44.2%
- By user type, Data Scientists & ML Engineers are projected to dominate the market during forecast period.
- Healthcare & Life Sciences as an end user segment is projected to grow at highest CAGR of 44.8% during the forecast period.
- Major market players such as Google, Nvidia, Microsoft have adopted both organic and inorganic strategies, including partnerships and investments. Companies are focusing on innovation through acquisitions, AI-focused collaborations, and cloud integrations.
- Companies like DataRobot, H2O.ai, and Cohere among others, have distinguished themselves among startups and SMEs by securing strong footholds in specialized niche areas, underscoring their potential as emerging market leaders.
The AI platform market is growing steadily with increasing demand for automation, data-driven decision-making, and advanced analytics across industries. Businesses are adopting AI platforms to improve efficiency, reduce costs, and enhance customer experiences. The proliferation of generative AI, especially large language models, is transforming platform capabilities by streamlining code generation and content development. The rise of cloud-based AI platforms is also fueling adoption among SMEs and enterprises, positioning AI platform solutions as vital enablers of automation and digital transformation across key industries.
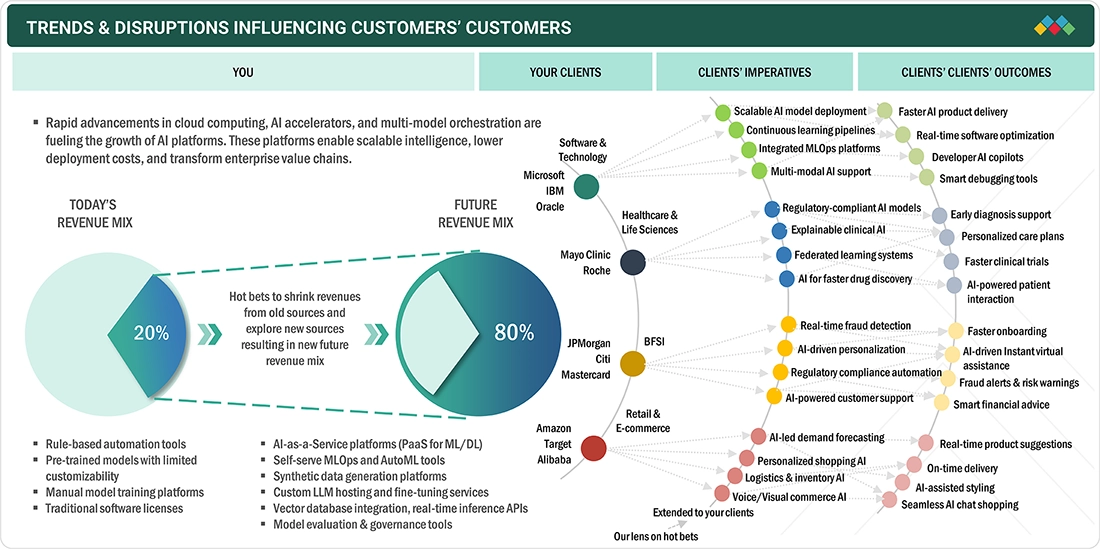
TRENDS & DISRUPTIONS IMPACTING CUSTOMERS' CUSTOMERS
Businesses today are being reshaped by a wave of powerful trends and disruptions driven by technological advancements, changing customer behaviors, and the demand for more agile, data-driven decision-making. Traditional revenue sources are being challenged as companies increasingly adopt innovative solutions such as artificial intelligence, cloud platforms, automation, and real-time analytics to stay competitive. This shift is not confined to internal operations; it influences the entire value chain, from the enterprise to its clients and ultimately their end-users. The impact of these changes is complex: organizations must adopt new technologies, redesign workflows, and better align with evolving client expectations. The 'Trends and Disruptions Impacting Customers' Businesses' framework provides a structured view of how emerging imperatives affect not only the core business but also ripple outward, transforming client strategies and creating new outcomes at the end-user level. It emphasizes the move from traditional revenue models to new, digital-first sources of growth. By understanding these interconnected shifts, stakeholders can prioritize investments, anticipate future demands, and position themselves for long-term success in a rapidly changing marketplace.
Source: Secondary Research, Interviews with Experts, MarketsandMarkets Analysis
MARKET DYNAMICS
Level
-
•Demand for cross-model orchestration and agentic workflow integration

-
•Adoption of domain-tuned foundation models with compliance-ready pipelines

Level
-
•Platform redundancy and feature saturation

-
•High inference and fine-tuning costs for SMEs

Level
-
•Fusion of AI platforms with business automation stacks

-
•Middleware abstraction for model interoperability

Level
-
•Regulatory burden on model deployment

-
•Platform fatigue from toolchain fragmentation

Source: Secondary Research, Interviews with Experts, MarketsandMarkets Analysis
Driver: Demand for cross-model orchestration and agentic workflow integration
The rising demand for multi-model and multi-agent orchestration is reshaping AI platforms, as organizations adopt complex, goal-oriented workflows like RAG, tool-using agents, and chained LLMs. These workflows require seamless integration of multiple AI models, APIs, knowledge bases, and plugins, with orchestration layers managing dependencies, context, and task execution. Platforms must coordinate diverse models in real time, handle fallback strategies, and ensure scalability and efficiency. Businesses also seek modular, interoperable solutions to avoid vendor lock-in. Robust orchestration capabilities are becoming foundational infrastructure, enabling adaptive, autonomous AI systems and serving as a competitive differentiator in enterprise adoption.
Restraint: High inference and fine-tuning costs
High costs of inference and fine-tuning hinder AI platform adoption, particularly for SMEs. While large enterprises can handle these expenses, smaller firms face challenges with budgets, integration, and monitoring. This disparity limits adoption, hampers market diversity, and slows ecosystem growth until more affordable and flexible pricing options are introduced.
Opportunity: Fusion of AI platforms with business automation stacks
Integrating AI with business automation systems (such as RPA, BPM, and workflow automation) presents strong growth opportunities. AI contributes cognitive skills like natural language understanding, predictive analytics, and decision-making, making processes smarter, more adaptable, and more efficient. Industries like finance, logistics, and healthcare benefit greatly from this integration, increasing demand for scalable, AI-driven automation.
Challenge: Platform fatigue from toolchain fragmentation
Businesses often depend on disjointed toolchains for tasks such as model training, monitoring, and deployment. This leads to inefficiencies, onboarding difficulties, and developer fatigue caused by constant context-switching. Fragmentation also raises the chances of errors, delays, and compliance problems. The need for unified, end-to-end platforms is essential to enhance scalability, reliability, and cross-team collaboration.
AI Platform Market: COMMERCIAL USE CASES ACROSS INDUSTRIES
| COMPANY | USE CASE DESCRIPTION | BENEFITS |
|---|---|---|
 |
AT&T ’s legacy fraud detection systems were rule-based and reactive, resulting in delayed detection and high false positives. Manual processes also limited their ability to forecast equipment failures and optimize resource allocation. | The implementation of H2O.ai led to an over 80% reduction in fraud-related incidents and saved AT&T an estimated USD 17 million annually through predictive maintenance and process optimization. The platform also enabled quicker rollout of new AI-driven services. |
 |
Handshake faced the challenge of deploying over a dozen LLM use cases in under six months while ensuring safety, reliability, and cost efficiency, but lacked consistent observability and evaluation capabilities to monitor model performance effectively. | By leveraging Arize, Handshake gained unified tracing, evaluation, and monitoring from the start, which enabled faster iteration, reduced hallucination risks, and allowed the company to successfully scale and ship over 15 LLM features in record time. |
 |
Canva faced limitations with its legacy ML infrastructure, which only supported single-machine workloads and made it difficult to efficiently train models on its massive content library or scale AI features to millions of users. | By adopting Anyscale as its modern AI platform, Canva cut cloud costs by nearly 50%, achieved up to 12× faster training speeds, and scaled generative and non-generative AI capabilities seamlessly to over 170 million users. |
 |
Prologis had an outdated setup where data scientists developed models locally and then handed them off for deployment, leading to delays, inconsistencies, and often causing models to be outdated before going live; additionally, AI efforts were highly siloed with only a few experts able to build models, which limited scalability. | By using Dataiku, Prologis democratized AI so that more users, up to approximately 2,000, including analysts, could build, deploy, and maintain ML projects; they increased the number of production-ready AI/ML projects by about 12 times and grew from roughly 5 to 30 active APIs and models in use, integrating with Snowflake and embedding AI into business operations on a much larger scale. |
Logos and trademarks shown above are the property of their respective owners. Their use here is for informational and illustrative purposes only.
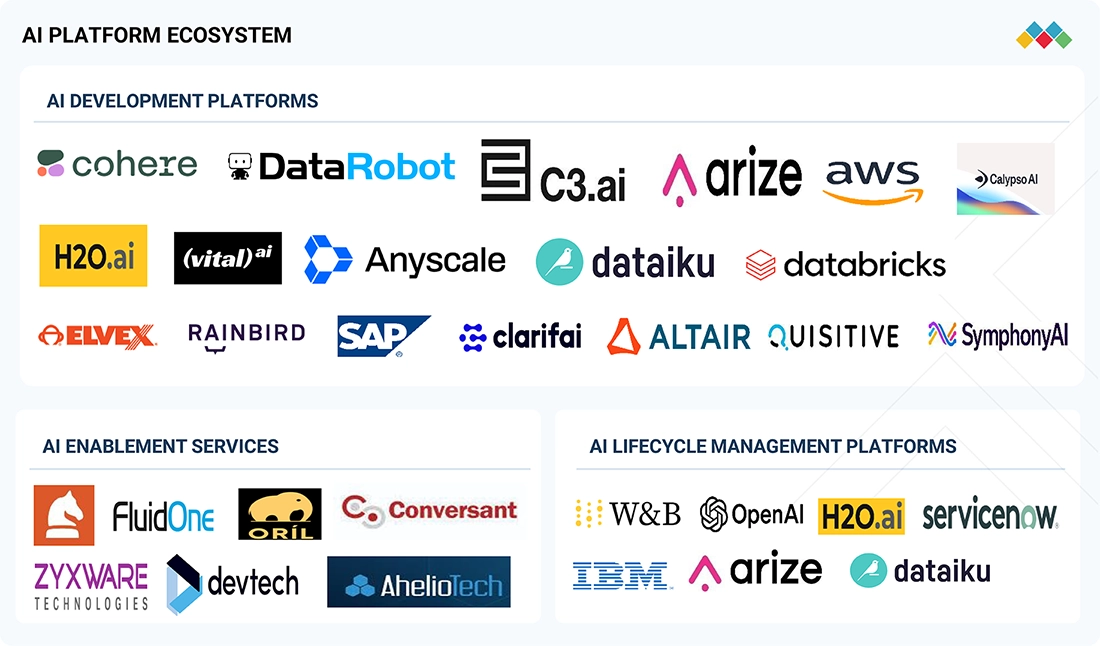
MARKET ECOSYSTEM
The AI platform market ecosystem, comprises of three major segments. These categories include tools and platforms for building, training, and deploying AI models (development platforms), managing AI workflows and governance (lifecycle management platforms), and AI enablement services. The ecosystem functions as an integrated network where providers collaborate across the AI value chain from foundational development to model governance and business enablement, driving intelligent automation, innovation acceleration, and enterprise AI adoption.
Logos and trademarks shown above are the property of their respective owners. Their use here is for informational and illustrative purposes only.
MARKET SEGMENTS
Source: Secondary Research, Interviews with Experts, MarketsandMarkets Analysis
AI Platform Market, By Platform Type
AI development platforms possess the largest market share by platform type, as they offer the essential tools and infrastructure necessary for constructing, training, and deploying tailored AI models. Their scalability, integration with cloud services, and support for machine learning, deep learning, and natural language processing drive extensive adoption. As organizations pursue flexibility and innovation over pre-existing solutions, investments in development platforms continue to lead the AI platform market.
AI Platform Market, By Functionality
Data management and preparation are expected to hold the largest share by functionality because high-quality, well-structured data is the foundation of effective AI models. Organizations spend significant resources on cleaning, labeling, and organizing data to ensure accuracy and reliability in AI outcomes. Since poor data directly impacts model performance, demand for tools that streamline data integration, governance, and preparation remains high. This makes data management the most critical and resource-intensive functionality in the AI platform market.
AI Platform Market, By User Type
Data scientists and ML engineers are projected to hold the largest share by user type because they are the main professionals responsible for developing, training, and deploying AI models. Their knowledge of algorithms, data management, and model optimization makes them the primary users of AI platforms. As organizations heavily invest in AI-driven solutions, these experts lead adoption efforts and enhance platform capabilities. This positions data scientists and ML engineers as the leading user group in the AI platform market.
AI Platform Market, By End User
Software & technology companies will hold the largest market share in the AI platform market because they are the earliest and fastest adopters of AI for product innovation and service improvement. These firms depend heavily on AI platforms for model creation, deployment, and monitoring to support applications like cloud services, SaaS, cybersecurity, and automation. With substantial R&D investments and a strong demand for scalable AI infrastructure, they continuously incorporate AI into their main business processes. Their role as both providers and users of AI technology ensures they remain the dominant end-user segment.
REGION
Asia Pacific to be fastest-growing region in global AI Platform Market during forecast period
Asia Pacific is projected to be the fastest-growing region in the AI platform market due to rapid digital transformation and strong government initiatives promoting AI adoption. Countries like China, India, Japan, and South Korea are heavily investing in AI research, startups, and infrastructure. The region’s large population and increasing internet penetration generate massive amounts of data, driving demand for AI-driven insights. The growing adoption of cloud services, smart devices, and automation in sectors such as healthcare, manufacturing, and retail further boosts growth. Additionally, increasing collaboration between global tech giants and regional players supports faster innovation and deployment. Together, these factors make Asia Pacific the most dynamic and fastest-growing AI platform market.
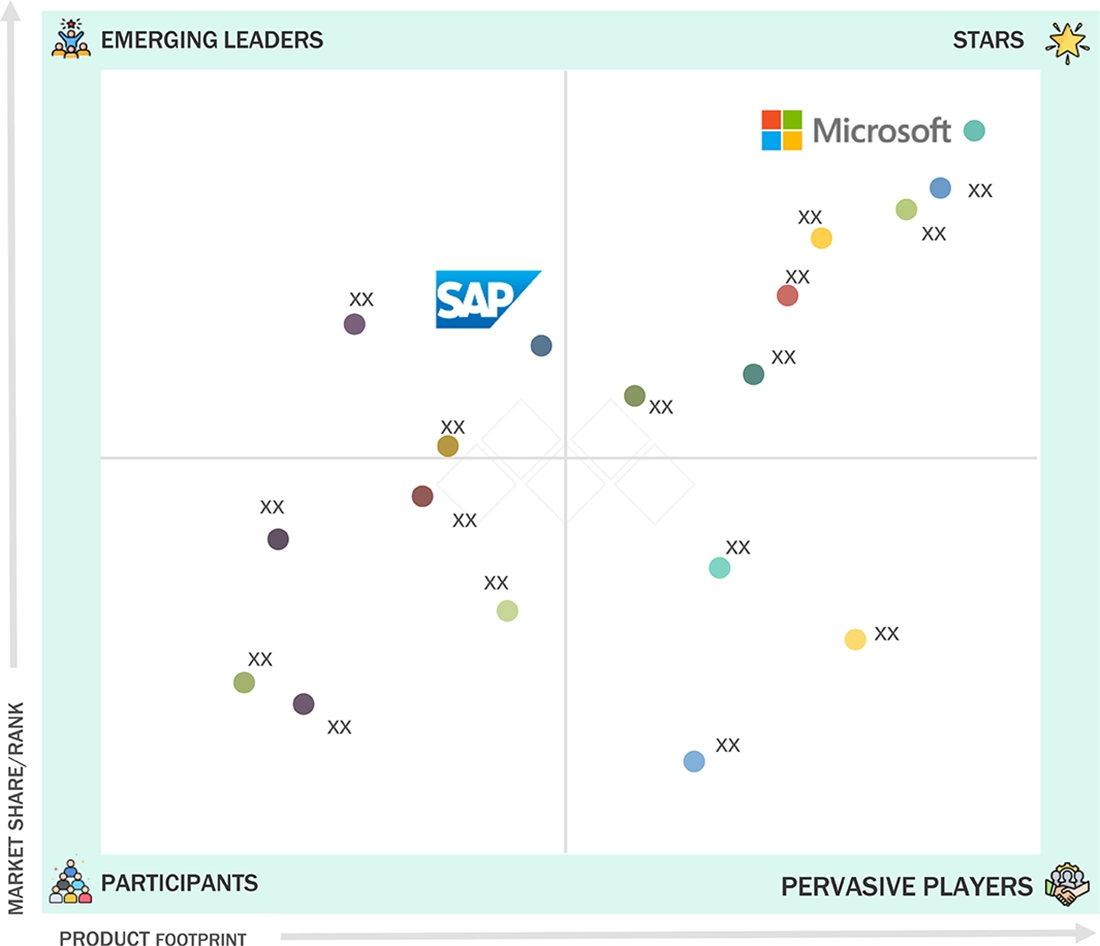
AI Platform Market: COMPANY EVALUATION MATRIX
In the AI platform market matrix, Microsoft (Star) leads with Azure AI, Azure Machine Learning, Cognitive Services, and Others, providing comprehensive tools for model development, deployment, and monitoring. Its scalable infrastructure and integrated generative AI features reinforce its leadership. SAP (Emerging Leader) is progressing with AI platform solutions focused on development, integration, and lifecycle management.
Source: Secondary Research, Interviews with Experts, MarketsandMarkets Analysis
KEY MARKET PLAYERS
MARKET SCOPE
| REPORT METRIC | DETAILS |
|---|---|
| Market Size in 2025 (Value) | USD 18.22 Billion |
| Market Forecast in 2030 (Value) | USD 94.31 Billion |
| Growth Rate | 38.90% |
| Years Considered | 2020 – 2030 |
| Base Year | 2024 |
| Forecast Period | 2025 – 2030 |
| Units Considered | USD Million/Billion |
| Report Coverage | Revenue forecast, company ranking, competitive landscape, growth factors, and trends |
| Segments Covered |
|
| Regions Covered | North America, Asia Pacific, Europe, Middle East & Africa, and Latin America |
WHAT IS IN IT FOR YOU: AI Platform Market REPORT CONTENT GUIDE
DELIVERED CUSTOMIZATIONS
We have successfully delivered the following deep-dive customizations:
| CLIENT REQUEST | CUSTOMIZATION DELIVERED | VALUE ADDS |
|---|---|---|
| Leading AI Platform Vendor |
|
|
| Leading AI Platform Vendor |
|
|
RECENT DEVELOPMENTS
- May 2025 : Google partnered with SAP to integrate Vertex AI into SAP’s cloud solutions, enabling advanced AI-powered analytics and forecasting.
- March 2025 : Microsoft extended its partnership with the Government of Kuwait to accelerate AI transformation in line with Kuwait's Vision 2035. A key aspect of this collaboration was the intent to establish an AI-powered Azure Region in Kuwait to boost local AI capabilities and drive economic growth.
- March 2025 : IBM leveraged NVIDIA's AI data platform technologies to accelerate AI at scale. This collaboration aimed to improve how enterprises discover, use, and deploy AI. IBM integrated NVIDIA's AI platform with its Watson AI and data platform, offering optimized infrastructure and software for AI workloads.
- March 2025 : Oracle and NVIDIA collaborated to help enterprises accelerate AI inference. NVIDIA's AI Enterprise software will be natively available through the Oracle Cloud Infrastructure (OCI) Console, providing access to over 160 AI tools and 100+ NVIDIA NIM microservices. The companies are also working on no-code AI Blueprint deployment and accelerating AI vector search in Oracle Database 23ai using NVIDIA cuVS.
- March 2025 : Seekr adopted Intel Developer Cloud to run foundation models and content evaluation workflows on Intel cloud services, using cloud-hosted AI capabilities for scalable development.
Table of Contents
 Exclusive indicates content/data unique to MarketsandMarkets and not available with any competitors.
Methodology
The research study for the AI platform market involved extensive secondary sources, directories, journals, and paid databases. Primary sources were mainly industry experts from the core and related industries, preferred AI platform providers, end users, and other commercial enterprises. In-depth interviews with primary respondents, including key industry participants and subject matter experts, were conducted to obtain and verify critical qualitative and quantitative information and assess the market’s prospects.
Secondary Research
In the secondary research process, various sources were referred to identify and collect information for the study. The secondary sources included annual reports, press releases, investor presentations of companies, white papers, journals, certified publications, and articles from recognized authors, directories, and databases. The data was also collected from other secondary sources, such as AI conferences and related magazines.
Additionally, the AI Platform spending of various countries was extracted from respective sources. Secondary research was used to obtain key information about the industry’s value chain and supply chain to identify key players by solution, service, market classification, and segmentation based on the offerings of major players and industry trends related to offering, functionality, end user, and regions, and key developments from market and technology-oriented perspectives.
Primary Research
In the primary research process, various primary sources from the supply and demand sides were interviewed to obtain qualitative and quantitative information on the market. The primary sources from the supply side included various industry experts, including Chief Experience Officers (CXOs); Vice Presidents (VPs), directors from business development, marketing, and AI Platform expertise, related key executives from AI Platform solution vendors, SIs, managed service providers, and industry associations, and key opinion leaders.
Primary interviews were conducted to gather insights, such as market statistics, revenue data collected from solutions and services, market breakups, market size estimations, market forecasts, and data triangulation.
Primary research also helped understand various trends related to technologies, offerings, business functions, user types, and regions. Stakeholders from the demand side, such as chief information officers (CIOs), chief technology officers (CTOs), chief strategy officers (CSOs), and end users using AI platform solutions, were interviewed to understand the buyer’s perspective on suppliers, products, service providers, and their current usage of AI platform, which would impact the overall AI platform market.

Note: Tier 1 companies account for annual revenue of >USD 10 billion; tier 2 companies’
revenue ranges between USD 1 and 10 billion; and tier 3 companies’ revenue ranges between USD 500 million–USD 1 billion
Source: MarketsandMarkets Analysis
To know about the assumptions considered for the study, download the pdf brochure
Market Size Estimation
Multiple approaches were adopted to estimate and forecast the AI platform market. The first approach involves estimating the market size by summing up the companies’ revenue generated by selling solutions and services.
Market Size Estimation Methodology- Top-down approach
In the top-down approach, an exhaustive list of all the vendors offering solutions and services in the AI platform market was prepared. The revenue contribution of the market vendors was estimated through annual reports, press releases, funding, investor presentations, paid databases, and primary interviews. Each vendor’s offerings were evaluated based on the breadth of solutions according to offering, functionality, user type, and end user.
The aggregate of all the companies’ revenue was extrapolated to reach the overall market size. Each subsegment was studied and analyzed for its global market size and regional penetration. The markets were triangulated through primary and secondary research. The primary procedure included extensive interviews for key insights from industry leaders, such as CIOs, CEOs, VPs, directors, and marketing executives. The market numbers were further triangulated with the existing MarketsandMarkets repository for validation.
Market Size Estimation Methodology-Bottom-up approach
In the bottom-up approach, the adoption rate of AI platform solutions and services among different end users in key countries with respect to their regions contributing the most to the market share was identified. For cross-validation, the adoption of AI platform solutions across various industries was identified, along with different use cases specific to their regions. The use cases identified in different regions were weighted for the calculation of market size.
Based on the market numbers, the regional split was determined by primary and secondary sources. The procedure included the analysis of the AI platform market’s regional penetration. Based on secondary research, the regional spending on information and communications technology (ICT), socio-economic analysis of each country, strategic vendor analysis of major AI platform providers, and organic and inorganic business development activities of regional and global players were estimated. With the data triangulation procedure and data validation through primary interviews, the exact values of the overall AI Platform market size and the segments’ size were determined and confirmed using the study.
AI Platform Market : Top-Down and Bottom-Up Approach

Data Triangulation
After arriving at the overall market size using the market size estimation processes explained above, the market was split into several segments and subsegments. To complete the overall market engineering process and determine the exact statistics of each market segment and subsegment, data triangulation and market breakup procedures were employed, wherever applicable. The overall market size was then used in the top-down procedure to estimate the size of other individual markets via percentage splits of the market segmentation.
Market Definition
The AI platforms includes software and infrastructure that enable the development, training, deployment, and management of AI models and applications. These platforms offer tools for machine learning, deep learning, natural language processing, and data processing. They support developers, data scientists, and enterprises in building intelligent systems efficiently.
Stakeholders
- AI platform software developers
- AI training dataset providers
- Business analysts
- Cloud service providers
- Enterprise end users
- Distributors and value-added resellers (VARs)
- Government agencies
- Independent software vendors (ISV)
- Managed service providers
- Market research and consulting firms
- Support & maintenance service providers
- System integrators (SIs)/migration service providers
- Language service providers
- Technology providers
- Academia & research institutions
- Investors & venture capital firms
Report Objectives
- To define, describe, and forecast the AI platform market by offering, functionality, user type, and vertical
- To provide detailed information related to major factors (drivers, restraints, opportunities, and industry-specific challenges) influencing the market growth
- To analyze the micro markets with respect to individual growth trends, prospects, and their contribution to the total market
- To analyze the opportunities in the market for stakeholders by identifying the high-growth segments of the AI platform market
- To analyze opportunities in the market and provide details of the competitive landscape for stakeholders and market leaders
- To forecast the market size of segments for the five main regions: North America, Europe, Asia Pacific, the Middle East & Africa, and Latin America
- To profile the key players and comprehensively analyze their market ranking and core competencies
- To analyze competitive developments, such as partnerships, product launches, and mergers & acquisitions, in the AI platform market
Available Customizations
With the given market data, MarketsandMarkets offers customizations as per your company’s specific needs. The following customization options are available for the report:
Product Analysis
- Product quadrant, which gives a detailed comparison of the product portfolio of each company.
Geographic Analysis as per Feasibility
- Further breakup of the North American AI platform market
- Further breakup of the European AI platform market
- Further breakup of the Asia Pacific AI platform market
- Further breakup of the Middle Eastern & African AI platform market
- Further breakup of the Latin American AI platform market
Company Information
- Detailed analysis and profiling of additional market players (up to five)
Key Questions Addressed by the Report
What is an AI platform?
An AI platform refers to software frameworks, development tools, and infrastructure that enable organizations to build, train, deploy, and manage artificial intelligence models and applications across various industries and use cases.
What is driving growth in the AI platform market?
The growth is driven by increasing demand for AI-based automation, adoption of no-code/low-code platforms, expanding digital transformation initiatives, and supportive government policies across sectors like healthcare, BFSI, manufacturing, and retail.
What are the key components of AI platforms?
Core components include machine learning frameworks, data science platforms, no-code and low-code AI development tools, model training environments, and deployment solutions, which enable organizations to build, manage, and scale AI applications efficiently.
Who are the major users of AI platforms?
Key users include enterprises in BFSI, healthcare, retail, manufacturing, telecom, and logistics sectors seeking to automate processes, enhance customer experience, optimize operations, and drive predictive analytics using AI capabilities.
How do no-code and low-code tools impact the AI platform market?
No-code and low-code tools democratize AI adoption by enabling non-technical users to develop AI solutions, accelerating deployment, reducing development time, and expanding the customer base for AI platform providers.
Need a Tailored Report?
Customize this report to your needs
Get 10% FREE Customization
Customize This ReportPersonalize This Research
- Triangulate with your Own Data
- Get Data as per your Format and Definition
- Gain a Deeper Dive on a Specific Application, Geography, Customer or Competitor
- Any level of Personalization
Let Us Help You
- What are the Known and Unknown Adjacencies Impacting the AI Platform Market
- What will your New Revenue Sources be?
- Who will be your Top Customer; what will make them switch?
- Defend your Market Share or Win Competitors
- Get a Scorecard for Target Partners

Custom Market Research Services
We Will Customise The Research For You, In Case The Report Listed Above Does Not Meet With Your Requirements
Get 10% Free CustomisationTESTIMONIALS


Growth opportunities and latent adjacency in AI Platform Market