2
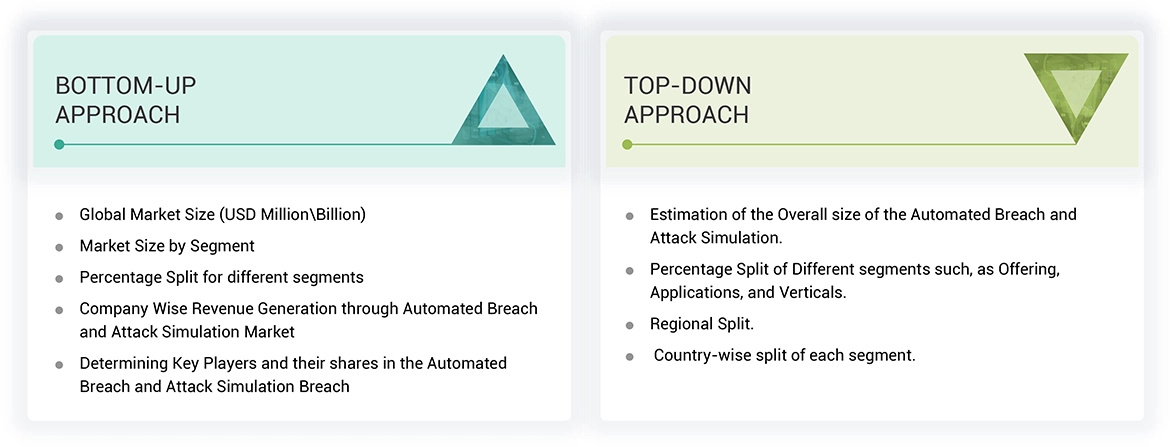
RESEARCH METHODOLOGY
43
5
MARKET OVERVIEW AND INDUSTRY TRENDS
Automated breach and attack simulation tools revolutionize cybersecurity amidst rising cyber threats and regulatory demands.
63
5.2.1.1
GROWING COMPLEXITY AND RISING THREATS OF CYBERATTACKS IN DIGITAL AGE
5.2.1.2
SURGING NEED FOR ADHERENCE TO STRINGENT REGULATIONS AND DATA PRIVACY LAWS
5.2.1.3
RISING NEED FOR CONTINUOUS SECURITY TESTING
5.2.1.4
INTEGRATION OF AUTOMATED BREACH AND ATTACK SIMULATION TOOLS WITH EXISTING SECURITY TOOLS
5.2.2.1
LACK OF SKILLED PROFESSIONALS
5.2.2.2
HIGH IMPLEMENTATION AND MAINTENANCE COSTS
5.2.3.1
INTEGRATION OF AUTOMATED BREACH AND ATTACK SIMULATION WITH ATTACK SURFACE MANAGEMENT
5.2.3.2
RAPID ADOPTION OF CLOUD-BASED SERVICES
5.2.3.3
INTEGRATION OF AI AND ML INTO BREACH AND ATTACK SIMULATION SOLUTIONS
5.2.3.4
DIGITAL TRANSFORMATION INITIATIVES
5.2.4.1
RESOURCE ALLOCATION AND INTEGRATION COMPLEXITY
5.2.4.2
ORGANIZATIONAL RESISTANCE AND MISCONCEPTIONS ABOUT AUTOMATED BREACH AND ATTACK SIMULATION SYSTEMS
5.3
IMPACT OF GENERATIVE AI (GENAI) ON AUTOMATED BREACH AND ATTACK SIMULATION MARKET
5.3.1
TOP USE CASES & MARKET POTENTIAL
5.3.2
TOP USE CASES AND MARKET POTENTIAL IN AUTOMATED BREACH AND ATTACK SIMULATION MARKET
5.3.3
IMPACT OF GEN AI ON INTERCONNECTED AND ADJACENT ECOSYSTEMS
5.3.3.1
ARTIFICIAL INTELLIGENCE AND MACHINE LEARNING
5.3.3.3
BIG DATA ANALYTICS
5.3.3.4
INTERNET OF THINGS (IOT)
5.3.3.5
QUANTUM COMPUTING
5.4.1
CASE STUDY 1: CYMULATE HELPED GLOBAL BANK CORP. STRENGTHEN CYBERSECURITY DEFENSES USING AUTOMATED BREACH AND ATTACK SIMULATION PLATFORM
5.4.2
CASE STUDY 2: XM CYBER ASSISTED HEALTHCARE SYSTEMS BY PROVIDING CONTINUOUS VISIBILITY INTO POTENTIAL ATTACK PATHS
5.4.3
CASE STUDY 3: SAFEBREACH SUPPORTED RETAIL GIANT IN ENHANCING CYBERSECURITY AND PROTECTING CUSTOMERS USING AUTOMATED BREACH AND ATTACK SIMULATION TOOL
5.4.4
CASE STUDY 4: ATTACKIQ ASSISTED NATIONAL SECURITY AGENCY IN STRENGTHENING CYBERSECURITY MEASURES AGAINST EMERGING THREATS
5.4.5
CASE STUDY 5: PENTERA SUPPORTED GLOBAL MANUFACTURING CORP. IN BOLSTERING OPERATIONAL TECHNOLOGY SECURITY AND PREVENTING DISRUPTIONS
5.4.6
CASE STUDY 6: QUALYS ASSISTED GLOBAL BANK CORP. IN STRENGTHENING CYBERSECURITY AND SAFEGUARDING SENSITIVE DATA
5.5.1
TECHNOLOGY INFRASTRUCTURE PROVIDERS
5.5.2
AUTOMATED BREACH AND ATTACK SIMULATION PROVIDERS
5.5.3
APPLICATION PROVIDERS
5.7
PORTER’S FIVE FORCES ANALYSIS
5.7.1
THREAT OF NEW ENTRANTS
5.7.2
BARGAINING POWER OF SUPPLIERS
5.7.3
BARGAINING POWER OF BUYERS
5.7.4
THREAT OF SUBSTITUTES
5.7.5
INTENSITY OF COMPETITIVE RIVALRY
5.8.1
AVERAGE SELLING PRICE TREND OF KEY PLAYERS, BY SOLUTION
5.8.2
INDICATIVE PRICING ANALYSIS, BY OFFERING
5.9.1.2
GRAPH-BASED SIMULATION TECHNOLOGY
5.9.1.3
BIG DATA ANALYTICS
5.9.1.5
BEHAVIORAL ANALYTICS
5.9.2
COMPLEMENTARY TECHNOLOGIES
5.9.2.2
VIRTUAL PRIVATE NETWORKS
5.9.2.3
BEHAVIORAL BIOMETRICS
5.9.2.4
NATURAL LANGUAGE PROCESSING
5.9.3
ADJACENT TECHNOLOGIES
5.9.3.1
QUANTUM COMPUTING
5.11
TRENDS AND DISRUPTIONS IMPACTING CUSTOMERS’ BUSINESSES
5.12
KEY STAKEHOLDERS AND BUYING CRITERIA
5.12.1
KEY STAKEHOLDERS IN BUYING PROCESS
5.13
REGULATORY LANDSCAPE
5.13.1
REGULATORY BODIES, GOVERNMENT AGENCIES, AND OTHER ORGANIZATIONS
5.14
KEY CONFERENCES & EVENTS, 2024–2025
5.15
INVESTMENT AND FUNDING SCENARIO
6
AUTOMATED BREACH AND ATTACK SIMULATION MARKET, BY OFFERING
Market Size & Growth Rate Forecast Analysis to 2029 in USD Thousand | 22 Data Tables
102
6.1.1
OFFERING: AUTOMATED BREACH AND ATTACK SIMULATION MARKET DRIVERS
6.2.1
INCREASING NEED FOR CONTINUOUS SECURITY AND SEAMLESS INTEGRATION TO DRIVE MARKET
6.2.2
STANDALONE PLATFORMS/SOFTWARE TOOLS
6.2.3
INTEGRATED SECURITY PLATFORMS/TOOLS
6.2.4
CLOUD-BASED SOLUTIONS
6.3.1
GROWING COMPLEXITY OF CYBER THREATS AND SURGING NEED FOR REGULATORY COMPLIANCE TO DRIVE MARKET
6.3.2
PROFESSIONAL SERVICES
6.3.2.1
EXPERTISE AND STRATEGIC GUIDANCE TO PROPEL DEMAND FOR PROFESSIONAL SERVICES
6.3.2.2
IMPLEMENTATION, INTEGRATION, AND CONSULTING
6.3.2.3
SECURITY POSTURE ASSESSMENT
6.3.2.4
TRAINING, COMPLIANCE REPORTING, AND AUDITING
6.3.2.5
SUPPORT & MAINTENANCE
6.3.3.1
INCREASING NEED FOR FOCUSING ON CORE BUSINESS OPERATIONS WHILE OUTSOURCING COMPLEX SECURITY FUNCTIONS TO ACCELERATE MARKET GROWTH
7
AUTOMATED BREACH AND ATTACK SIMULATION MARKET, BY DEPLOYMENT MODE
Market Size & Growth Rate Forecast Analysis to 2029 in USD Thousand | 6 Data Tables
115
7.1.1
DEPLOYMENT MODE: AUTOMATED BREACH AND ATTACK SIMULATION MARKET DRIVERS
7.2.1
PARAMOUNT NEED FOR STRICT REGULATORY COMPLIANCE AND DATA SECURITY TO DRIVE DEMAND FOR ON-PREMISES SOLUTIONS
7.3.1
SCALABILITY AND COST-EFFICIENCY TO DRIVE DEMAND FOR CLOUD-BASED BAS SOLUTIONS
8
AUTOMATED BREACH AND ATTACK SIMULATION MARKET, BY ORGANIZATION SIZE
Market Size & Growth Rate Forecast Analysis to 2029 in USD Thousand | 6 Data Tables
120
8.1.1
ORGANIZATION SIZE: AUTOMATED BREACH AND ATTACK SIMULATION MARKET DRIVERS
8.2.1
SCALABILITY AND AFFORDABILITY OF BAS SOLUTIONS TO DRIVE MARKET
8.3.1
SURGING NEED FOR PROTECTION OF VAST AMOUNTS OF SENSITIVE DATA TO FUEL MARKET GROWTH
9
AUTOMATED BREACH AND ATTACK SIMULATION MARKET, BY APPLICATION
Market Size & Growth Rate Forecast Analysis to 2029 in USD Thousand | 10 Data Tables
125
9.1.1
APPLICATION: AUTOMATED BREACH AND ATTACK SIMULATION MARKET DRIVERS
9.2
CONFIGURATION MANAGEMENT
9.2.1
SPIKE IN DEMAND FOR REAL-TIME CONFIGURATION VALIDATION AND COMPLIANCE MANAGEMENT TO BOLSTER MARKET GROWTH
9.3.1
GROWING COMPLEXITY OF IT INFRASTRUCTURES AND INCREASING VOLUME OF SOFTWARE VULNERABILITIES TO DRIVE MARKET
9.4.1
PROACTIVE RISK MANAGEMENT AND REAL-TIME THREAT DETECTION TO DRIVE DEMAND FOR BAS SOLUTIONS
10
AUTOMATED BREACH AND ATTACK SIMULATION MARKET, BY VERTICAL
Market Size & Growth Rate Forecast Analysis to 2029 in USD Thousand | 18 Data Tables
132
10.1.1
VERTICAL: AUTOMATED BREACH AND ATTACK SIMULATION MARKET DRIVERS
10.2.1
INCREASED NEED FOR ENHANCING CUSTOMER EXPERIENCES AND STREAMLINING OPERATIONS TO DRIVE MARKET
10.3.1
SPIKE IN DEMAND FOR SECURING SENSITIVE HEALTH DATA FROM POTENTIAL BREACHES TO BOOST MARKET GROWTH
10.4.1
SURGING NEED FOR ROBUST CYBERSECURITY MEASURES TO FOSTER MARKET GROWTH
10.5.1
SPIKE IN DEMAND FOR PROTECTION OF EXTENSIVE AND SENSITIVE COMMUNICATION INFRASTRUCTURES FROM RISING CYBER THREATS TO ACCELERATE MARKET GROWTH
10.6.1
INCREASING DEMAND FOR IDENTIFICATION OF VULNERABILITIES AND TEST SECURITY CONTROLS IN REAL TIME TO FOSTER MARKET GROWTH
10.7.1
INCREASED NEED FOR PROTECTION OF INTELLECTUAL PROPERTY AND COMBAT PIRACY TO DRIVE MARKET
10.8.1
RISING NEED FOR REDUCTION OF OPERATIONAL DISRUPTIONS CAUSED BY CYBER INCIDENTS TO PROPEL MARKET
11
AUTOMATED BREACH AND ATTACK SIMULATION MARKET, BY REGION
Comprehensive coverage of 8 Regions with country-level deep-dive of 14 Countries | 364 Data Tables.
145
11.2.1
NORTH AMERICA: MARKET DRIVERS
11.2.2
NORTH AMERICA: MACROECONOMIC OUTLOOK
11.2.3.1
RISING COMPLEXITY OF CYBER THREATS AND NEED FOR CONTINUOUS SECURITY TO ACCELERATE MARKET GROWTH
11.2.4.1
RISING CYBERSECURITY ATTACKS AND INCREASING DATA PROTECTION REQUIREMENTS ACROSS REGULATED INDUSTRIES TO DRIVE MARKET
11.3.1
EUROPE: MARKET DRIVERS
11.3.2
EUROPE: MACROECONOMIC OUTLOOK
11.3.3.1
INCREASING CYBER THREATS AND NEED FOR ROBUST SECURITY MEASURES TO ACCELERATE MARKET GROWTH
11.3.4.1
RISING CYBER THREATS, REGULATORY REQUIREMENTS, AND INCREASING COMPLEXITY OF CYBERATTACKS TO BOLSTER MARKET GROWTH
11.3.5.1
BURGEONING CYBERSECURITY THREATS AND DIGITAL TRANSFORMATION TO BOOST MARKET
11.3.6.1
RISING SIGNIFICANCE OF PROACTIVE SECURITY MEASURES TO FOSTER MARKET GROWTH
11.4.1
ASIA PACIFIC: MARKET DRIVERS
11.4.2
ASIA PACIFIC: MACROECONOMIC OUTLOOK
11.4.3.1
RAPID DIGITALIZATION AND RISING COLLABORATIONS WITH MANAGED SERVICE COMPANIES TO DRIVE MARKET
11.4.4.1
RISING DIGITAL TRANSFORMATION AND GROWING CYBERSECURITY DEMANDS TO FOSTER MARKET GROWTH
11.4.5.1
SUBSTANTIAL INTERNET PENETRATION, SKILLED IT WORKFORCE, AND GOVERNMENT SUPPORT TO AID MARKET GROWTH
11.4.6
REST OF ASIA PACIFIC
11.5
MIDDLE EAST & AFRICA
11.5.1
MIDDLE EAST & AFRICA: MARKET DRIVERS
11.5.2
MIDDLE EAST & AFRICA: MACROECONOMIC OUTLOOK
11.5.3.1
CLOUD ADOPTION AND INTEGRATION WITH OTHER SECURITY TOOLS TO BOOST MARKET
11.5.3.2.1
FUNDAMENTAL DIGITAL TRANSFORMATION AND RISING NEED FOR ROBUST DATA PROTECTION TO BOOST MARKET GROWTH
11.5.3.3.1
INCREASING CYBER THREATS, REGULATORY DEMANDS, AND GROWING CYBERSECURITY AWARENESS TO PROMOTE MARKET GROWTH
11.5.4.1
DRAMATIC INCREASE IN RANSOMWARE ATTACKS TO DRIVE MARKET
11.5.5
REST OF MIDDLE EAST & AFRICA
11.6.1
LATIN AMERICA: AUTOMATED BREACH AND ATTACK SIMULATION MARKET DRIVERS
11.6.2
LATIN AMERICA: MACROECONOMIC OUTLOOK
11.6.3.1
GOVERNMENT INITIATIVES AND EMERGENT TECHNOLOGIES TO PROPEL MARKET GROWTH
11.6.4.1
STRINGENT REGULATORY COMPLIANCE DEMANDS TO DRIVE MARKET
11.6.5
REST OF LATIN AMERICA
12
COMPETITIVE LANDSCAPE
Uncover key strategies and market dominance shaping today's competitive landscape.
265
12.1
KEY PLAYER STRATEGIES/RIGHT TO WIN
12.3
MARKET SHARE ANALYSIS, 2023
12.5
COMPANY VALUATION AND FINANCIAL METRICS
12.5.2
FINANCIAL METRICS USING EV/EBITDA
12.6
COMPANY EVALUATION MATRIX: KEY PLAYERS, 2023
12.6.5
COMPANY FOOTPRINT: KEY PLAYERS, 2023
12.6.5.1
COMPANY FOOTPRINT
12.6.5.2
REGIONAL FOOTPRINT
12.6.5.3
DEPLOYMENT MODE FOOTPRINT
12.6.5.4
VERTICAL FOOTPRINT
12.7
COMPANY EVALUATION MATRIX: STARTUPS/SMES, 2023
12.7.1
PROGRESSIVE COMPANIES
12.7.2
RESPONSIVE COMPANIES
12.7.5
COMPETITIVE BENCHMARKING: STARTUPS/SMES, 2023
12.7.5.1
DETAILED LIST OF KEY STARTUPS/SMES
12.7.5.2
COMPETITIVE BENCHMARKING OF KEY STARTUPS/SMES
12.8
COMPETITIVE SCENARIO
12.8.1
PRODUCT LAUNCHES & ENHANCEMENTS
13
COMPANY PROFILES
In-depth Company Profiles of Leading Market Players with detailed Business Overview, Product and Service Portfolio, Recent Developments, and Unique Analyst Perspective (MnM View)
290
13.1.1.1
BUSINESS OVERVIEW
13.1.1.2
PRODUCTS/SOLUTIONS/SERVICES OFFERED
13.1.1.3
RECENT DEVELOPMENTS
13.1.1.3.1
PRODUCT LAUNCHES & ENHANCEMENTS
13.1.1.3.3
OTHER DEVELOPMENTS
13.1.1.4.2
STRATEGIC CHOICES
13.1.1.4.3
WEAKNESSES AND COMPETITIVE THREATS
13.1.11
KEYSIGHT TECHNOLOGIES
14.3
PENETRATION-TESTING-AS-A-SERVICE MARKET
14.4
SECURITY AND VULNERABILITY MARKET
15.2
KNOWLEDGESTORE: MARKETSANDMARKETS' SUBSCRIPTION PORTAL
15.3
CUSTOMIZATION OPTIONS
TABLE 1
USD EXCHANGE RATES, 2020–2023
TABLE 3
AUTOMATED BREACH AND ATTACK SIMULATION MARKET SIZE AND GROWTH RATE, 2023–2029 (USD THOUSAND, Y-O-Y %)
TABLE 4
AUTOMATED BREACH AND ATTACK SIMULATION MARKET: ECOSYSTEM
TABLE 5
PORTER’S FIVE FORCES IMPACT ON AUTOMATED BREACH AND ATTACK SIMULATION MARKET
TABLE 6
AVERAGE SELLING PRICE TREND OF KEY PLAYERS, BY SOLUTION
TABLE 7
INDICATIVE PRICING ANALYSIS
TABLE 8
LIST OF PATENTS IN AUTOMATED BREACH AND ATTACK SIMULATION MARKET, 2024
TABLE 9
INFLUENCE OF STAKEHOLDERS ON BUYING PROCESS FOR TOP THREE VERTICALS
TABLE 10
KEY BUYING CRITERIA FOR TOP VERTICALS
TABLE 11
NORTH AMERICA: LIST OF REGULATORY BODIES, GOVERNMENT AGENCIES, AND OTHER ORGANIZATIONS
TABLE 12
EUROPE: LIST OF REGULATORY BODIES, GOVERNMENT AGENCIES, AND OTHER ORGANIZATIONS
TABLE 13
ASIA PACIFIC: LIST OF REGULATORY BODIES, GOVERNMENT AGENCIES, AND OTHER ORGANIZATIONS
TABLE 14
MIDDLE EAST & AFRICA: LIST OF REGULATORY BODIES, GOVERNMENT AGENCIES, AND OTHER ORGANIZATIONS
TABLE 15
LATIN AMERICA: LIST OF REGULATORY BODIES, GOVERNMENT AGENCIES, AND OTHER ORGANIZATIONS
TABLE 16
KEY CONFERENCES & EVENTS, 2024–2025
TABLE 17
AUTOMATED BREACH AND ATTACK SIMULATION MARKET, BY OFFERING, 2018–2023 (USD THOUSAND)
TABLE 18
AUTOMATED BREACH AND ATTACK SIMULATION MARKET, BY OFFERING, 2024–2029 (USD THOUSAND)
TABLE 19
PLATFORMS & TOOLS: AUTOMATED BREACH AND ATTACK SIMULATION MARKET, BY REGION, 2018–2023 (USD THOUSAND)
TABLE 20
PLATFORMS & TOOLS: AUTOMATED BREACH AND ATTACK SIMULATION MARKET, BY REGION, 2024–2029 (USD THOUSAND)
TABLE 21
AUTOMATED BREACH AND ATTACK SIMULATION MARKET, BY SERVICE, 2018–2023 (USD THOUSAND)
TABLE 22
AUTOMATED BREACH AND ATTACK SIMULATION MARKET, BY SERVICE, 2024–2029 (USD THOUSAND)
TABLE 23
SERVICES: AUTOMATED BREACH AND ATTACK SIMULATION MARKET, BY REGION, 2018–2023 (USD THOUSAND)
TABLE 24
SERVICES: AUTOMATED BREACH AND ATTACK SIMULATION MARKET, BY REGION, 2024–2029 (USD THOUSAND)
TABLE 25
AUTOMATED BREACH AND ATTACK SIMULATION MARKET, BY PROFESSIONAL SERVICE, 2018–2023 (USD THOUSAND)
TABLE 26
AUTOMATED BREACH AND ATTACK SIMULATION MARKET, BY PROFESSIONAL SERVICE, 2024–2029 (USD THOUSAND)
TABLE 27
PROFESSIONAL SERVICES: AUTOMATED BREACH AND ATTACK SIMULATION MARKET, BY REGION, 2018–2023 (USD THOUSAND)
TABLE 28
PROFESSIONAL SERVICES: AUTOMATED BREACH AND ATTACK SIMULATION MARKET, BY REGION, 2024–2029 (USD THOUSAND)
TABLE 29
IMPLEMENTATION, INTEGRATION, AND CONSULTING: AUTOMATED BREACH AND ATTACK SIMULATION MARKET, BY REGION, 2018–2023 (USD THOUSAND)
TABLE 30
IMPLEMENTATION, INTEGRATION, AND CONSULTING: AUTOMATED BREACH AND ATTACK SIMULATION MARKET, BY REGION, 2024–2029 (USD THOUSAND)
TABLE 31
SECURITY POSTURE ASSESSMENT: AUTOMATED BREACH AND ATTACK SIMULATION MARKET, BY REGION, 2018–2023 (USD THOUSAND)
TABLE 32
SECURITY POSTURE ASSESSMENT: AUTOMATED BREACH AND ATTACK SIMULATION MARKET, BY REGION, 2024–2029 (USD THOUSAND)
TABLE 33
TRAINING, COMPLIANCE REPORTING, AND AUDITING: AUTOMATED BREACH AND ATTACK SIMULATION MARKET, BY REGION, 2018–2023 (USD THOUSAND)
TABLE 34
TRAINING, COMPLIANCE REPORTING, AND AUDITING: AUTOMATED BREACH AND ATTACK SIMULATION MARKET, BY REGION, 2024–2029 (USD THOUSAND)
TABLE 35
SUPPORT & MAINTENANCE: AUTOMATED BREACH AND ATTACK SIMULATION MARKET, BY REGION, 2018–2023 (USD THOUSAND)
TABLE 36
SUPPORT & MAINTENANCE: AUTOMATED BREACH AND ATTACK SIMULATION MARKET, BY REGION, 2024–2029 (USD THOUSAND)
TABLE 37
MANAGED SERVICES: AUTOMATED BREACH AND ATTACK SIMULATION MARKET, BY REGION, 2018–2023 (USD THOUSAND)
TABLE 38
MANAGED SERVICES: AUTOMATED BREACH AND ATTACK SIMULATION MARKET, BY REGION, 2024–2029 (USD THOUSAND)
TABLE 39
AUTOMATED BREACH AND ATTACK SIMULATION MARKET, BY DEPLOYMENT MODE, 2018–2023 (USD THOUSAND)
TABLE 40
AUTOMATED BREACH AND ATTACK SIMULATION MARKET, BY DEPLOYMENT MODE, 2024–2029 (USD THOUSAND)
TABLE 41
ON-PREMISES: AUTOMATED BREACH AND ATTACK SIMULATION MARKET, BY REGION, 2018–2023 (USD THOUSAND)
TABLE 42
ON-PREMISES: AUTOMATED BREACH AND ATTACK SIMULATION MARKET, BY REGION, 2024–2029 (USD THOUSAND)
TABLE 43
CLOUD: AUTOMATED BREACH AND ATTACK SIMULATION MARKET, BY REGION, 2018–2023 (USD THOUSAND)
TABLE 44
CLOUD: AUTOMATED BREACH AND ATTACK SIMULATION MARKET, BY REGION, 2024–2029 (USD THOUSAND)
TABLE 45
AUTOMATED BREACH AND ATTACK SIMULATION MARKET, BY ORGANIZATION SIZE, 2018–2023 (USD THOUSAND)
TABLE 46
AUTOMATED BREACH AND ATTACK SIMULATION MARKET, BY ORGANIZATION SIZE, 2024–2029 (USD THOUSAND)
TABLE 47
SMES: AUTOMATED BREACH AND ATTACK SIMULATION MARKET, BY REGION, 2018–2023 (USD THOUSAND)
TABLE 48
SMES: AUTOMATED BREACH AND ATTACK SIMULATION MARKET, BY REGION, 2024–2029 (USD THOUSAND)
TABLE 49
LARGE ENTERPRISES: AUTOMATED BREACH AND ATTACK SIMULATION MARKET, BY REGION, 2018–2023 (USD THOUSAND)
TABLE 50
LARGE ENTERPRISES: AUTOMATED BREACH AND ATTACK SIMULATION MARKET, BY REGION, 2024–2029 (USD THOUSAND)
TABLE 51
AUTOMATED BREACH AND ATTACK SIMULATION MARKET, BY APPLICATION, 2018–2023 (USD THOUSAND)
TABLE 52
AUTOMATED BREACH AND ATTACK SIMULATION MARKET, BY APPLICATION, 2024–2029 (USD THOUSAND)
TABLE 53
CONFIGURATION MANAGEMENT: AUTOMATED BREACH AND ATTACK SIMULATION MARKET, BY REGION, 2018–2023 (USD THOUSAND)
TABLE 54
CONFIGURATION MANAGEMENT: AUTOMATED BREACH AND ATTACK SIMULATION MARKET, BY REGION, 2024–2029 (USD THOUSAND)
TABLE 55
PATCH MANAGEMENT: AUTOMATED BREACH AND ATTACK SIMULATION MARKET, BY REGION, 2018–2023 (USD THOUSAND)
TABLE 56
PATCH MANAGEMENT: AUTOMATED BREACH AND ATTACK SIMULATION MARKET, BY REGION, 2024–2029 (USD THOUSAND)
TABLE 57
THREAT INTELLIGENCE: AUTOMATED BREACH AND ATTACK SIMULATION MARKET, BY REGION, 2018–2023 (USD THOUSAND)
TABLE 58
THREAT INTELLIGENCE: AUTOMATED BREACH AND ATTACK SIMULATION MARKET, BY REGION, 2024–2029 (USD THOUSAND)
TABLE 59
OTHER APPLICATIONS: AUTOMATED BREACH AND ATTACK SIMULATION MARKET, BY REGION, 2018–2023 (USD THOUSAND)
TABLE 60
OTHER APPLICATIONS: AUTOMATED BREACH AND ATTACK SIMULATION MARKET, BY REGION, 2024–2029 (USD THOUSAND)
TABLE 61
AUTOMATED BREACH AND ATTACK SIMULATION MARKET, BY VERTICAL, 2018–2023 (USD THOUSAND)
TABLE 62
AUTOMATED BREACH AND ATTACK SIMULATION MARKET, BY VERTICAL, 2024–2029 (USD THOUSAND)
TABLE 63
BFSI: AUTOMATED BREACH AND ATTACK SIMULATION MARKET, BY REGION, 2018–2023 (USD THOUSAND)
TABLE 64
BFSI: AUTOMATED BREACH AND ATTACK SIMULATION MARKET, BY REGION, 2024–2029 (USD THOUSAND)
TABLE 65
HEALTHCARE: AUTOMATED BREACH AND ATTACK SIMULATION MARKET, BY REGION, 2018–2023 (USD THOUSAND)
TABLE 66
HEALTHCARE: AUTOMATED BREACH AND ATTACK SIMULATION MARKET, BY REGION, 2024–2029 (USD THOUSAND)
TABLE 67
IT & ITES: AUTOMATED BREACH AND ATTACK SIMULATION MARKET, BY REGION, 2018–2023 (USD THOUSAND)
TABLE 68
IT & ITES: AUTOMATED BREACH AND ATTACK SIMULATION MARKET, BY REGION, 2024–2029 (USD THOUSAND)
TABLE 69
TELECOMMUNICATIONS: AUTOMATED BREACH AND ATTACK SIMULATION MARKET, BY REGION, 2018–2023 (USD THOUSAND)
TABLE 70
TELECOMMUNICATIONS: AUTOMATED BREACH AND ATTACK SIMULATION MARKET, BY REGION, 2024–2029 (USD THOUSAND)
TABLE 71
RETAIL & ECOMMERCE: AUTOMATED BREACH AND ATTACK SIMULATION MARKET, BY REGION, 2018–2023 (USD THOUSAND)
TABLE 72
RETAIL & ECOMMERCE: AUTOMATED BREACH AND ATTACK SIMULATION MARKET, BY REGION, 2024–2029 (USD THOUSAND)
TABLE 73
MANUFACTURING: AUTOMATED BREACH AND ATTACK SIMULATION MARKET, BY REGION, 2018–2023 (USD THOUSAND)
TABLE 74
MANUFACTURING: AUTOMATED BREACH AND ATTACK SIMULATION MARKET, BY REGION, 2024–2029 (USD THOUSAND)
TABLE 75
EDUCATION: AUTOMATED BREACH AND ATTACK SIMULATION MARKET, BY REGION, 2018–2023 (USD THOUSAND)
TABLE 76
EDUCATION: AUTOMATED BREACH AND ATTACK SIMULATION MARKET, BY REGION, 2024–2029 (USD THOUSAND)
TABLE 77
OTHER VERTICALS: AUTOMATED BREACH AND ATTACK SIMULATION MARKET, BY REGION, 2018–2023 (USD THOUSAND)
TABLE 78
OTHER VERTICALS: AUTOMATED BREACH AND ATTACK SIMULATION MARKET, BY REGION, 2024–2029 (USD THOUSAND)
TABLE 79
AUTOMATED BREACH AND ATTACK SIMULATION MARKET, BY REGION, 2018–2023 (USD THOUSAND)
TABLE 80
AUTOMATED BREACH AND ATTACK SIMULATION MARKET, BY REGION, 2024–2029 (USD THOUSAND)
TABLE 81
NORTH AMERICA: AUTOMATED BREACH AND ATTACK SIMULATION MARKET, BY OFFERING, 2018–2023 (USD THOUSAND)
TABLE 82
NORTH AMERICA: AUTOMATED BREACH AND ATTACK SIMULATION MARKET, BY OFFERING, 2024–2029 (USD THOUSAND)
TABLE 83
NORTH AMERICA: AUTOMATED BREACH AND ATTACK SIMULATION MARKET, BY SERVICE, 2018–2023 (USD THOUSAND)
TABLE 84
NORTH AMERICA: AUTOMATED BREACH AND ATTACK SIMULATION MARKET, BY SERVICE, 2024–2029 (USD THOUSAND)
TABLE 85
NORTH AMERICA: AUTOMATED BREACH AND ATTACK SIMULATION MARKET, BY PROFESSIONAL SERVICE, 2018–2023 (USD THOUSAND)
TABLE 86
NORTH AMERICA: AUTOMATED BREACH AND ATTACK SIMULATION MARKET, BY PROFESSIONAL SERVICE, 2024–2029 (USD THOUSAND)
TABLE 87
NORTH AMERICA: AUTOMATED BREACH AND ATTACK SIMULATION MARKET, BY DEPLOYMENT MODE, 2018–2023 (USD THOUSAND)
TABLE 88
NORTH AMERICA: AUTOMATED BREACH AND ATTACK SIMULATION MARKET, BY DEPLOYMENT MODE, 2024–2029 (USD THOUSAND)
TABLE 89
NORTH AMERICA: AUTOMATED BREACH AND ATTACK SIMULATION MARKET, BY ORGANIZATION SIZE, 2018–2023 (USD THOUSAND)
TABLE 90
NORTH AMERICA: AUTOMATED BREACH AND ATTACK SIMULATION MARKET, BY ORGANIZATION SIZE, 2024–2029 (USD THOUSAND)
TABLE 91
NORTH AMERICA: AUTOMATED BREACH AND ATTACK SIMULATION MARKET, BY APPLICATION, 2018–2023 (USD THOUSAND)
TABLE 92
NORTH AMERICA: AUTOMATED BREACH AND ATTACK SIMULATION MARKET, BY APPLICATION, 2024–2029 (USD THOUSAND)
TABLE 93
NORTH AMERICA: AUTOMATED BREACH AND ATTACK SIMULATION MARKET, BY VERTICAL, 2018–2023 (USD THOUSAND)
TABLE 94
NORTH AMERICA: AUTOMATED BREACH AND ATTACK SIMULATION MARKET, BY APPLICATION, 2024–2029 (USD THOUSAND)
TABLE 95
NORTH AMERICA: AUTOMATED BREACH AND ATTACK SIMULATION MARKET, BY COUNTRY, 2018–2023 (USD THOUSAND)
TABLE 96
NORTH AMERICA: AUTOMATED BREACH AND ATTACK SIMULATION MARKET, BY COUNTRY, 2024–2029 (USD THOUSAND)
TABLE 97
US: AUTOMATED BREACH AND ATTACK SIMULATION MARKET, BY OFFERING, 2018–2023 (USD THOUSAND)
TABLE 98
US: AUTOMATED BREACH AND ATTACK SIMULATION MARKET, BY OFFERING, 2024–2029 (USD THOUSAND)
TABLE 99
US: AUTOMATED BREACH AND ATTACK SIMULATION MARKET, BY SERVICE, 2018–2023 (USD THOUSAND)
TABLE 100
US: AUTOMATED BREACH AND ATTACK SIMULATION MARKET, BY SERVICE, 2024–2029 (USD THOUSAND)
TABLE 101
US: AUTOMATED BREACH AND ATTACK SIMULATION MARKET, BY PROFESSIONAL SERVICE, 2018–2023 (USD THOUSAND)
TABLE 102
US: AUTOMATED BREACH AND ATTACK SIMULATION MARKET, BY PROFESSIONAL SERVICE, 2024–2029 (USD THOUSAND)
TABLE 103
US: AUTOMATED BREACH AND ATTACK SIMULATION MARKET, BY DEPLOYMENT MODE, 2018–2023 (USD THOUSAND)
TABLE 104
US: AUTOMATED BREACH AND ATTACK SIMULATION MARKET, BY DEPLOYMENT MODE, 2024–2029 (USD THOUSAND)
TABLE 105
US: AUTOMATED BREACH AND ATTACK SIMULATION MARKET, BY ORGANIZATION SIZE, 2018–2023 (USD THOUSAND)
TABLE 106
US: AUTOMATED BREACH AND ATTACK SIMULATION MARKET, BY ORGANIZATION SIZE, 2024–2029 (USD THOUSAND)
TABLE 107
US: AUTOMATED BREACH AND ATTACK SIMULATION MARKET, BY APPLICATION, 2018–2023 (USD THOUSAND)
TABLE 108
US: AUTOMATED BREACH AND ATTACK SIMULATION MARKET, BY APPLICATION, 2024–2029 (USD THOUSAND)
TABLE 109
US: AUTOMATED BREACH AND ATTACK SIMULATION MARKET, BY VERTICAL, 2018–2023 (USD THOUSAND)
TABLE 110
US: AUTOMATED BREACH AND ATTACK SIMULATION MARKET, BY VERTICAL, 2024–2029 (USD THOUSAND)
TABLE 111
CANADA: AUTOMATED BREACH AND ATTACK SIMULATION MARKET, BY OFFERING, 2018–2023 (USD THOUSAND)
TABLE 112
CANADA: AUTOMATED BREACH AND ATTACK SIMULATION MARKET, BY OFFERING, 2024–2029 (USD THOUSAND)
TABLE 113
CANADA: AUTOMATED BREACH AND ATTACK SIMULATION MARKET, BY SERVICE, 2018–2023 (USD THOUSAND)
TABLE 114
CANADA: AUTOMATED BREACH AND ATTACK SIMULATION MARKET, BY SERVICE, 2024–2029 (USD THOUSAND)
TABLE 115
CANADA: AUTOMATED BREACH AND ATTACK SIMULATION MARKET, BY PROFESSIONAL SERVICE, 2018–2023 (USD THOUSAND)
TABLE 116
CANADA: AUTOMATED BREACH AND ATTACK SIMULATION MARKET, BY PROFESSIONAL SERVICE, 2024–2029 (USD THOUSAND)
TABLE 117
CANADA: AUTOMATED BREACH AND ATTACK SIMULATION MARKET, BY DEPLOYMENT MODE, 2018–2023 (USD THOUSAND)
TABLE 118
CANADA: AUTOMATED BREACH AND ATTACK SIMULATION MARKET, BY DEPLOYMENT MODE, 2024–2029 (USD THOUSAND)
TABLE 119
CANADA: AUTOMATED BREACH AND ATTACK SIMULATION MARKET, BY ORGANIZATION SIZE, 2018–2023 (USD THOUSAND)
TABLE 120
CANADA: AUTOMATED BREACH AND ATTACK SIMULATION MARKET, BY ORGANIZATION SIZE, 2024–2029 (USD THOUSAND)
TABLE 121
CANADA: AUTOMATED BREACH AND ATTACK SIMULATION MARKET, BY APPLICATION, 2018–2023 (USD THOUSAND)
TABLE 122
CANADA: AUTOMATED BREACH AND ATTACK SIMULATION MARKET, BY APPLICATION, 2024–2029 (USD THOUSAND)
TABLE 123
CANADA: AUTOMATED BREACH AND ATTACK SIMULATION MARKET, BY VERTICAL, 2018–2023 (USD THOUSAND)
TABLE 124
CANADA: AUTOMATED BREACH AND ATTACK SIMULATION MARKET, BY VERTICAL, 2024–2029 (USD THOUSAND)
TABLE 125
EUROPE: AUTOMATED BREACH AND ATTACK SIMULATION MARKET, BY OFFERING, 2018–2023 (USD THOUSAND)
TABLE 126
EUROPE: AUTOMATED BREACH AND ATTACK SIMULATION MARKET, BY OFFERING, 2024–2029 (USD THOUSAND)
TABLE 127
EUROPE: AUTOMATED BREACH AND ATTACK SIMULATION MARKET, BY SERVICE, 2018–2023 (USD THOUSAND)
TABLE 128
EUROPE: AUTOMATED BREACH AND ATTACK SIMULATION MARKET, BY SERVICE, 2024–2029 (USD THOUSAND)
TABLE 129
EUROPE: AUTOMATED BREACH AND ATTACK SIMULATION MARKET, BY PROFESSIONAL SERVICE, 2018–2023 (USD THOUSAND)
TABLE 130
EUROPE: AUTOMATED BREACH AND ATTACK SIMULATION MARKET, BY PROFESSIONAL SERVICE, 2024–2029 (USD THOUSAND)
TABLE 131
EUROPE: AUTOMATED BREACH AND ATTACK SIMULATION MARKET, BY DEPLOYMENT MODE, 2018–2023 (USD THOUSAND)
TABLE 132
EUROPE: AUTOMATED BREACH AND ATTACK SIMULATION MARKET, BY DEPLOYMENT MODE, 2024–2029 (USD THOUSAND)
TABLE 133
EUROPE: AUTOMATED BREACH AND ATTACK SIMULATION MARKET, BY ORGANIZATION SIZE, 2018–2023 (USD THOUSAND)
TABLE 134
EUROPE: AUTOMATED BREACH AND ATTACK SIMULATION MARKET, BY ORGANIZATION SIZE, 2024–2029 (USD THOUSAND)
TABLE 135
EUROPE: AUTOMATED BREACH AND ATTACK SIMULATION MARKET, BY APPLICATION, 2018–2023 (USD THOUSAND)
TABLE 136
EUROPE: AUTOMATED BREACH AND ATTACK SIMULATION MARKET, BY APPLICATION, 2024–2029 (USD THOUSAND)
TABLE 137
EUROPE: AUTOMATED BREACH AND ATTACK SIMULATION MARKET, BY VERTICAL, 2018–2023 (USD THOUSAND)
TABLE 138
EUROPE: AUTOMATED BREACH AND ATTACK SIMULATION MARKET, BY VERTICAL, 2024–2029 (USD THOUSAND)
TABLE 139
EUROPE: AUTOMATED BREACH AND ATTACK SIMULATION MARKET, BY COUNTRY, 2018–2023 (USD THOUSAND)
TABLE 140
EUROPE: AUTOMATED BREACH AND ATTACK SIMULATION MARKET, BY COUNTRY, 2024–2029 (USD THOUSAND)
TABLE 141
UK: AUTOMATED BREACH AND ATTACK SIMULATION MARKET, BY OFFERING, 2018–2023 (USD THOUSAND)
TABLE 142
UK: AUTOMATED BREACH AND ATTACK SIMULATION MARKET, BY OFFERING, 2024–2029 (USD THOUSAND)
TABLE 143
UK: AUTOMATED BREACH AND ATTACK SIMULATION MARKET, BY SERVICE, 2018–2023 (USD THOUSAND)
TABLE 144
UK: AUTOMATED BREACH AND ATTACK SIMULATION MARKET, BY SERVICE, 2024–2029 (USD THOUSAND)
TABLE 145
UK: AUTOMATED BREACH AND ATTACK SIMULATION MARKET, BY PROFESSIONAL SERVICE, 2018–2023 (USD THOUSAND)
TABLE 146
UK: AUTOMATED BREACH AND ATTACK SIMULATION MARKET, BY PROFESSIONAL SERVICE, 2024–2029 (USD THOUSAND)
TABLE 147
UK: AUTOMATED BREACH AND ATTACK SIMULATION MARKET, BY DEPLOYMENT MODE, 2018–2023 (USD THOUSAND)
TABLE 148
UK: AUTOMATED BREACH AND ATTACK SIMULATION MARKET, BY DEPLOYMENT MODE, 2024–2029 (USD THOUSAND)
TABLE 149
UK: AUTOMATED BREACH AND ATTACK SIMULATION MARKET, BY ORGANIZATION SIZE, 2018–2023 (USD THOUSAND)
TABLE 150
UK: AUTOMATED BREACH AND ATTACK SIMULATION MARKET, BY ORGANIZATION SIZE, 2024–2029 (USD THOUSAND)
TABLE 151
UK: AUTOMATED BREACH AND ATTACK SIMULATION MARKET, BY APPLICATION, 2018–2023 (USD THOUSAND)
TABLE 152
UK: AUTOMATED BREACH AND ATTACK SIMULATION MARKET, BY APPLICATION, 2024–2029 (USD THOUSAND)
TABLE 153
UK: AUTOMATED BREACH AND ATTACK SIMULATION MARKET, BY VERTICAL, 2018–2023 (USD THOUSAND)
TABLE 154
UK: AUTOMATED BREACH AND ATTACK SIMULATION MARKET, BY VERTICAL, 2024–2029 (USD THOUSAND)
TABLE 155
GERMANY: AUTOMATED BREACH AND ATTACK SIMULATION MARKET, BY OFFERING, 2018–2023 (USD THOUSAND)
TABLE 156
GERMANY: AUTOMATED BREACH AND ATTACK SIMULATION MARKET, BY OFFERING, 2024–2029 (USD THOUSAND)
TABLE 157
GERMANY: AUTOMATED BREACH AND ATTACK SIMULATION MARKET, BY SERVICE, 2018–2023 (USD THOUSAND)
TABLE 158
GERMANY: AUTOMATED BREACH AND ATTACK SIMULATION MARKET, BY SERVICE, 2024–2029 (USD THOUSAND)
TABLE 159
GERMANY: AUTOMATED BREACH AND ATTACK SIMULATION MARKET, BY PROFESSIONAL SERVICE, 2018–2023 (USD THOUSAND)
TABLE 160
GERMANY: AUTOMATED BREACH AND ATTACK SIMULATION MARKET, BY PROFESSIONAL SERVICE, 2024–2029 (USD THOUSAND)
TABLE 161
GERMANY: AUTOMATED BREACH AND ATTACK SIMULATION MARKET, BY DEPLOYMENT MODE, 2018–2023 (USD THOUSAND)
TABLE 162
GERMANY: AUTOMATED BREACH AND ATTACK SIMULATION MARKET, BY DEPLOYMENT MODE, 2024–2029 (USD THOUSAND)
TABLE 163
GERMANY: AUTOMATED BREACH AND ATTACK SIMULATION MARKET, BY ORGANIZATION SIZE, 2018–2023 (USD THOUSAND)
TABLE 164
GERMANY: AUTOMATED BREACH AND ATTACK SIMULATION MARKET, BY ORGANIZATION SIZE, 2024–2029 (USD THOUSAND)
TABLE 165
GERMANY: AUTOMATED BREACH AND ATTACK SIMULATION MARKET, BY APPLICATION, 2018–2023 (USD THOUSAND)
TABLE 166
GERMANY: AUTOMATED BREACH AND ATTACK SIMULATION MARKET, BY APPLICATION, 2024–2029 (USD THOUSAND)
TABLE 167
GERMANY: AUTOMATED BREACH AND ATTACK SIMULATION MARKET, BY VERTICAL, 2018–2023 (USD THOUSAND)
TABLE 168
GERMANY: AUTOMATED BREACH AND ATTACK SIMULATION MARKET, BY VERTICAL, 2024–2029 (USD THOUSAND)
TABLE 169
FRANCE: AUTOMATED BREACH AND ATTACK SIMULATION MARKET, BY OFFERING, 2018–2023 (USD THOUSAND)
TABLE 170
FRANCE: AUTOMATED BREACH AND ATTACK SIMULATION MARKET, BY OFFERING, 2024–2029 (USD THOUSAND)
TABLE 171
FRANCE: AUTOMATED BREACH AND ATTACK SIMULATION MARKET, BY SERVICE, 2018–2023 (USD THOUSAND)
TABLE 172
FRANCE: AUTOMATED BREACH AND ATTACK SIMULATION MARKET, BY SERVICE, 2024–2029 (USD THOUSAND)
TABLE 173
FRANCE: AUTOMATED BREACH AND ATTACK SIMULATION MARKET, BY PROFESSIONAL SERVICE, 2018–2023 (USD THOUSAND)
TABLE 174
FRANCE: AUTOMATED BREACH AND ATTACK SIMULATION MARKET, BY PROFESSIONAL SERVICE, 2024–2029 (USD THOUSAND)
TABLE 175
FRANCE: AUTOMATED BREACH AND ATTACK SIMULATION MARKET, BY DEPLOYMENT MODE, 2018–2023 (USD THOUSAND)
TABLE 176
FRANCE: AUTOMATED BREACH AND ATTACK SIMULATION MARKET, BY DEPLOYMENT MODE, 2024–2029 (USD THOUSAND)
TABLE 177
FRANCE: AUTOMATED BREACH AND ATTACK SIMULATION MARKET, BY ORGANIZATION SIZE, 2018–2023 (USD THOUSAND)
TABLE 178
FRANCE: AUTOMATED BREACH AND ATTACK SIMULATION MARKET, BY ORGANIZATION SIZE, 2024–2029 (USD THOUSAND)
TABLE 179
FRANCE: AUTOMATED BREACH AND ATTACK SIMULATION MARKET, BY APPLICATION, 2018–2023 (USD THOUSAND)
TABLE 180
FRANCE: AUTOMATED BREACH AND ATTACK SIMULATION MARKET, BY APPLICATION, 2024–2029 (USD THOUSAND)
TABLE 181
FRANCE: AUTOMATED BREACH AND ATTACK SIMULATION MARKET, BY VERTICAL, 2018–2023 (USD THOUSAND)
TABLE 182
FRANCE: AUTOMATED BREACH AND ATTACK SIMULATION MARKET, BY VERTICAL, 2024–2029 (USD THOUSAND)
TABLE 183
ITALY: AUTOMATED BREACH AND ATTACK SIMULATION MARKET, BY OFFERING, 2018–2023 (USD THOUSAND)
TABLE 184
ITALY: AUTOMATED BREACH AND ATTACK SIMULATION MARKET, BY OFFERING, 2024–2029 (USD THOUSAND)
TABLE 185
ITALY: AUTOMATED BREACH AND ATTACK SIMULATION MARKET, BY SERVICE, 2018–2023 (USD THOUSAND)
TABLE 186
ITALY: AUTOMATED BREACH AND ATTACK SIMULATION MARKET, BY SERVICE, 2024–2029 (USD THOUSAND)
TABLE 187
ITALY: AUTOMATED BREACH AND ATTACK SIMULATION MARKET, BY PROFESSIONAL SERVICE, 2018–2023 (USD THOUSAND)
TABLE 188
ITALY: AUTOMATED BREACH AND ATTACK SIMULATION MARKET, BY PROFESSIONAL SERVICE, 2024–2029 (USD THOUSAND)
TABLE 189
ITALY: AUTOMATED BREACH AND ATTACK SIMULATION MARKET, BY DEPLOYMENT MODE, 2018–2023 (USD THOUSAND)
TABLE 190
ITALY: AUTOMATED BREACH AND ATTACK SIMULATION MARKET, BY DEPLOYMENT MODE, 2024–2029 (USD THOUSAND)
TABLE 191
ITALY: AUTOMATED BREACH AND ATTACK SIMULATION MARKET, BY ORGANIZATION SIZE, 2018–2023 (USD THOUSAND)
TABLE 192
ITALY: AUTOMATED BREACH AND ATTACK SIMULATION MARKET, BY ORGANIZATION SIZE, 2024–2029 (USD THOUSAND)
TABLE 193
ITALY: AUTOMATED BREACH AND ATTACK SIMULATION MARKET, BY APPLICATION, 2018–2023 (USD THOUSAND)
TABLE 194
ITALY: AUTOMATED BREACH AND ATTACK SIMULATION MARKET, BY APPLICATION, 2024–2029 (USD THOUSAND)
TABLE 195
ITALY: AUTOMATED BREACH AND ATTACK SIMULATION MARKET, BY VERTICAL, 2018–2023 (USD THOUSAND)
TABLE 196
ITALY: AUTOMATED BREACH AND ATTACK SIMULATION MARKET, BY VERTICAL, 2024–2029 (USD THOUSAND)
TABLE 197
REST OF EUROPE: AUTOMATED BREACH AND ATTACK SIMULATION MARKET, BY OFFERING, 2018–2023 (USD THOUSAND)
TABLE 198
REST OF EUROPE: AUTOMATED BREACH AND ATTACK SIMULATION MARKET, BY OFFERING, 2024–2029 (USD THOUSAND)
TABLE 199
REST OF EUROPE: AUTOMATED BREACH AND ATTACK SIMULATION MARKET, BY SERVICE, 2018–2023 (USD THOUSAND)
TABLE 200
REST OF EUROPE: AUTOMATED BREACH AND ATTACK SIMULATION MARKET, BY SERVICE, 2024–2029 (USD THOUSAND)
TABLE 201
REST OF EUROPE: AUTOMATED BREACH AND ATTACK SIMULATION MARKET, BY PROFESSIONAL SERVICE, 2018–2023 (USD THOUSAND)
TABLE 202
REST OF EUROPE: AUTOMATED BREACH AND ATTACK SIMULATION MARKET, BY PROFESSIONAL SERVICE, 2024–2029 (USD THOUSAND)
TABLE 203
REST OF EUROPE: AUTOMATED BREACH AND ATTACK SIMULATION MARKET, BY DEPLOYMENT MODE, 2018–2023 (USD THOUSAND)
TABLE 204
REST OF EUROPE: AUTOMATED BREACH AND ATTACK SIMULATION MARKET, BY DEPLOYMENT MODE, 2024–2029 (USD THOUSAND)
TABLE 205
REST OF EUROPE: AUTOMATED BREACH AND ATTACK SIMULATION MARKET, BY ORGANIZATION SIZE, 2018–2023 (USD THOUSAND)
TABLE 206
REST OF EUROPE: AUTOMATED BREACH AND ATTACK SIMULATION MARKET, BY ORGANIZATION SIZE, 2024–2029 (USD THOUSAND)
TABLE 207
REST OF EUROPE: AUTOMATED BREACH AND ATTACK SIMULATION MARKET, BY APPLICATION, 2018–2023 (USD THOUSAND)
TABLE 208
REST OF EUROPE: AUTOMATED BREACH AND ATTACK SIMULATION MARKET, BY APPLICATION, 2024–2029 (USD THOUSAND)
TABLE 209
REST OF EUROPE: AUTOMATED BREACH AND ATTACK SIMULATION MARKET, BY VERTICAL, 2018–2023 (USD THOUSAND)
TABLE 210
REST OF EUROPE: AUTOMATED BREACH AND ATTACK SIMULATION MARKET, BY VERTICAL, 2024–2029 (USD THOUSAND)
TABLE 211
ASIA PACIFIC: AUTOMATED BREACH AND ATTACK SIMULATION MARKET, BY OFFERING, 2018–2023 (USD THOUSAND)
TABLE 212
ASIA PACIFIC: AUTOMATED BREACH AND ATTACK SIMULATION MARKET, BY OFFERING, 2024–2029 (USD THOUSAND)
TABLE 213
ASIA PACIFIC: AUTOMATED BREACH AND ATTACK SIMULATION MARKET, BY SERVICE, 2018–2023 (USD THOUSAND)
TABLE 214
ASIA PACIFIC: AUTOMATED BREACH AND ATTACK SIMULATION MARKET, BY SERVICE, 2024–2029 (USD THOUSAND)
TABLE 215
ASIA PACIFIC: AUTOMATED BREACH AND ATTACK SIMULATION MARKET, BY PROFESSIONAL SERVICE, 2018–2023 (USD THOUSAND)
TABLE 216
ASIA PACIFIC: AUTOMATED BREACH AND ATTACK SIMULATION MARKET, BY PROFESSIONAL SERVICE, 2024–2029 (USD THOUSAND)
TABLE 217
ASIA PACIFIC: AUTOMATED BREACH AND ATTACK SIMULATION MARKET, BY DEPLOYMENT MODE, 2018–2023 (USD THOUSAND)
TABLE 218
ASIA PACIFIC: AUTOMATED BREACH AND ATTACK SIMULATION MARKET, BY DEPLOYMENT MODE, 2024–2029 (USD THOUSAND)
TABLE 219
ASIA PACIFIC: AUTOMATED BREACH AND ATTACK SIMULATION MARKET, BY ORGANIZATION SIZE, 2018–2023 (USD THOUSAND)
TABLE 220
ASIA PACIFIC: AUTOMATED BREACH AND ATTACK SIMULATION MARKET, BY ORGANIZATION SIZE, 2024–2029 (USD THOUSAND)
TABLE 221
ASIA PACIFIC: AUTOMATED BREACH AND ATTACK SIMULATION MARKET, BY APPLICATION, 2018–2023 (USD THOUSAND)
TABLE 222
ASIA PACIFIC: AUTOMATED BREACH AND ATTACK SIMULATION MARKET, BY APPLICATION, 2024–2029 (USD THOUSAND)
TABLE 223
ASIA PACIFIC: AUTOMATED BREACH AND ATTACK SIMULATION MARKET, BY VERTICAL, 2018–2023 (USD THOUSAND)
TABLE 224
ASIA PACIFIC: AUTOMATED BREACH AND ATTACK SIMULATION MARKET, BY VERTICAL, 2024–2029 (USD THOUSAND)
TABLE 225
ASIA PACIFIC: AUTOMATED BREACH AND ATTACK SIMULATION MARKET, BY COUNTRY, 2018–2023 (USD THOUSAND)
TABLE 226
ASIA PACIFIC: AUTOMATED BREACH AND ATTACK SIMULATION MARKET, BY COUNTRY, 2024–2029 (USD THOUSAND)
TABLE 227
CHINA: AUTOMATED BREACH AND ATTACK SIMULATION MARKET, BY OFFERING, 2018–2023 (USD THOUSAND)
TABLE 228
CHINA: AUTOMATED BREACH AND ATTACK SIMULATION MARKET, BY OFFERING, 2024–2029 (USD THOUSAND)
TABLE 229
CHINA: AUTOMATED BREACH AND ATTACK SIMULATION MARKET, BY SERVICE, 2018–2023 (USD THOUSAND)
TABLE 230
CHINA: AUTOMATED BREACH AND ATTACK SIMULATION MARKET, BY SERVICE, 2024–2029 (USD THOUSAND)
TABLE 231
CHINA: AUTOMATED BREACH AND ATTACK SIMULATION MARKET, BY PROFESSIONAL SERVICE, 2018–2023 (USD THOUSAND)
TABLE 232
CHINA: AUTOMATED BREACH AND ATTACK SIMULATION MARKET, BY PROFESSIONAL SERVICE, 2024–2029 (USD THOUSAND)
TABLE 233
CHINA: AUTOMATED BREACH AND ATTACK SIMULATION MARKET, BY DEPLOYMENT MODE, 2018–2023 (USD THOUSAND)
TABLE 234
CHINA: AUTOMATED BREACH AND ATTACK SIMULATION MARKET, BY DEPLOYMENT MODE, 2024–2029 (USD THOUSAND)
TABLE 235
CHINA: AUTOMATED BREACH AND ATTACK SIMULATION MARKET, BY ORGANIZATION SIZE, 2018–2023 (USD THOUSAND)
TABLE 236
CHINA: AUTOMATED BREACH AND ATTACK SIMULATION MARKET, BY ORGANIZATION SIZE, 2024–2029 (USD THOUSAND)
TABLE 237
CHINA: AUTOMATED BREACH AND ATTACK SIMULATION MARKET, BY APPLICATION, 2018–2023 (USD THOUSAND)
TABLE 238
CHINA: AUTOMATED BREACH AND ATTACK SIMULATION MARKET, BY APPLICATION, 2024–2029 (USD THOUSAND)
TABLE 239
CHINA: AUTOMATED BREACH AND ATTACK SIMULATION MARKET, BY VERTICAL, 2018–2023 (USD THOUSAND)
TABLE 240
CHINA: AUTOMATED BREACH AND ATTACK SIMULATION MARKET, BY VERTICAL, 2024–2029 (USD THOUSAND)
TABLE 241
JAPAN: AUTOMATED BREACH AND ATTACK SIMULATION MARKET, BY OFFERING, 2018–2023 (USD THOUSAND)
TABLE 242
JAPAN: AUTOMATED BREACH AND ATTACK SIMULATION MARKET, BY OFFERING, 2024–2029 (USD THOUSAND)
TABLE 243
JAPAN: AUTOMATED BREACH AND ATTACK SIMULATION MARKET, BY SERVICE, 2018–2023 (USD THOUSAND)
TABLE 244
JAPAN: AUTOMATED BREACH AND ATTACK SIMULATION MARKET, BY SERVICE, 2024–2029 (USD THOUSAND)
TABLE 245
JAPAN: AUTOMATED BREACH AND ATTACK SIMULATION MARKET, BY PROFESSIONAL SERVICE, 2018–2023 (USD THOUSAND)
TABLE 246
JAPAN: AUTOMATED BREACH AND ATTACK SIMULATION MARKET, BY PROFESSIONAL SERVICE, 2024–2029 (USD THOUSAND)
TABLE 247
JAPAN: AUTOMATED BREACH AND ATTACK SIMULATION MARKET, BY DEPLOYMENT MODE, 2018–2023 (USD THOUSAND)
TABLE 248
JAPAN: AUTOMATED BREACH AND ATTACK SIMULATION MARKET, BY DEPLOYMENT MODE, 2024–2029 (USD THOUSAND)
TABLE 249
JAPAN: AUTOMATED BREACH AND ATTACK SIMULATION MARKET, BY ORGANIZATION SIZE, 2018–2023 (USD THOUSAND)
TABLE 250
JAPAN: AUTOMATED BREACH AND ATTACK SIMULATION MARKET, BY ORGANIZATION SIZE, 2024–2029 (USD THOUSAND)
TABLE 251
JAPAN: AUTOMATED BREACH AND ATTACK SIMULATION MARKET, BY APPLICATION, 2018–2023 (USD THOUSAND)
TABLE 252
JAPAN: AUTOMATED BREACH AND ATTACK SIMULATION MARKET, BY APPLICATION, 2024–2029 (USD THOUSAND)
TABLE 253
JAPAN: AUTOMATED BREACH AND ATTACK SIMULATION MARKET, BY VERTICAL, 2018–2023 (USD THOUSAND)
TABLE 254
JAPAN: AUTOMATED BREACH AND ATTACK SIMULATION MARKET, BY VERTICAL, 2024–2029 (USD THOUSAND)
TABLE 255
INDIA: AUTOMATED BREACH AND ATTACK SIMULATION MARKET, BY OFFERING, 2018–2023 (USD THOUSAND)
TABLE 256
INDIA: AUTOMATED BREACH AND ATTACK SIMULATION MARKET, BY OFFERING, 2024–2029 (USD THOUSAND)
TABLE 257
INDIA: AUTOMATED BREACH AND ATTACK SIMULATION MARKET, BY SERVICE, 2018–2023 (USD THOUSAND)
TABLE 258
INDIA: AUTOMATED BREACH AND ATTACK SIMULATION MARKET, BY SERVICE, 2024–2029 (USD THOUSAND)
TABLE 259
INDIA: AUTOMATED BREACH AND ATTACK SIMULATION MARKET, BY PROFESSIONAL SERVICE, 2018–2023 (USD THOUSAND)
TABLE 260
INDIA: AUTOMATED BREACH AND ATTACK SIMULATION MARKET, BY PROFESSIONAL SERVICE, 2024–2029 (USD THOUSAND)
TABLE 261
INDIA: AUTOMATED BREACH AND ATTACK SIMULATION MARKET, BY DEPLOYMENT MODE, 2018–2023 (USD THOUSAND)
TABLE 262
INDIA: AUTOMATED BREACH AND ATTACK SIMULATION MARKET, BY DEPLOYMENT MODE, 2024–2029 (USD THOUSAND)
TABLE 263
INDIA: AUTOMATED BREACH AND ATTACK SIMULATION MARKET, BY ORGANIZATION SIZE, 2018–2023 (USD THOUSAND)
TABLE 264
INDIA: AUTOMATED BREACH AND ATTACK SIMULATION MARKET, BY ORGANIZATION SIZE, 2024–2029 (USD THOUSAND)
TABLE 265
INDIA: AUTOMATED BREACH AND ATTACK SIMULATION MARKET, BY APPLICATION, 2018–2023 (USD THOUSAND)
TABLE 266
INDIA: AUTOMATED BREACH AND ATTACK SIMULATION MARKET, BY APPLICATION, 2024–2029 (USD THOUSAND)
TABLE 267
INDIA: AUTOMATED BREACH AND ATTACK SIMULATION MARKET, BY VERTICAL, 2018–2023 (USD THOUSAND)
TABLE 268
INDIA: BREACH AND ATTACK SIMULATION MARKET, BY VERTICAL, 2024–2029 (USD THOUSAND)
TABLE 269
REST OF ASIA PACIFIC: AUTOMATED BREACH AND ATTACK SIMULATION MARKET, BY OFFERING, 2018–2023 (USD THOUSAND)
TABLE 270
REST OF ASIA PACIFIC: AUTOMATED BREACH AND ATTACK SIMULATION MARKET, BY OFFERING, 2024–2029 (USD THOUSAND)
TABLE 271
REST OF ASIA PACIFIC: AUTOMATED BREACH AND ATTACK SIMULATION MARKET, BY SERVICE, 2018–2023 (USD THOUSAND)
TABLE 272
REST OF ASIA PACIFIC: AUTOMATED BREACH AND ATTACK SIMULATION MARKET, BY SERVICE, 2024–2029 (USD THOUSAND)
TABLE 273
REST OF ASIA PACIFIC: AUTOMATED BREACH AND ATTACK SIMULATION MARKET, BY PROFESSIONAL SERVICE, 2018–2023 (USD THOUSAND)
TABLE 274
REST OF ASIA PACIFIC: AUTOMATED BREACH AND ATTACK SIMULATION MARKET, BY PROFESSIONAL SERVICE, 2024–2029 (USD THOUSAND)
TABLE 275
REST OF ASIA PACIFIC: AUTOMATED BREACH AND ATTACK SIMULATION MARKET, BY DEPLOYMENT MODE, 2018–2023 (USD THOUSAND)
TABLE 276
REST OF ASIA PACIFIC: AUTOMATED BREACH AND ATTACK SIMULATION MARKET, BY DEPLOYMENT MODE, 2024–2029 (USD THOUSAND)
TABLE 277
REST OF ASIA PACIFIC: AUTOMATED BREACH AND ATTACK SIMULATION MARKET, BY ORGANIZATION SIZE, 2018–2023 (USD THOUSAND)
TABLE 278
REST OF ASIA PACIFIC: AUTOMATED BREACH AND ATTACK SIMULATION MARKET, BY ORGANIZATION SIZE, 2024–2029 (USD THOUSAND)
TABLE 279
REST OF ASIA PACIFIC: AUTOMATED BREACH AND ATTACK SIMULATION MARKET, BY APPLICATION, 2018–2023 (USD THOUSAND)
TABLE 280
REST OF ASIA PACIFIC: AUTOMATED BREACH AND ATTACK SIMULATION MARKET, BY APPLICATION, 2024–2029 (USD THOUSAND)
TABLE 281
REST OF ASIA PACIFIC: AUTOMATED BREACH AND ATTACK SIMULATION MARKET, BY VERTICAL, 2018–2023 (USD THOUSAND)
TABLE 282
REST OF ASIA PACIFIC: BREACH AND ATTACK SIMULATION MARKET, BY VERTICAL, 2024–2029 (USD THOUSAND)
TABLE 283
MIDDLE EAST & AFRICA: AUTOMATED BREACH AND ATTACK SIMULATION MARKET, BY OFFERING, 2018–2023 (USD THOUSAND)
TABLE 284
MIDDLE EAST & AFRICA: AUTOMATED BREACH AND ATTACK SIMULATION MARKET, BY OFFERING, 2024–2029 (USD THOUSAND)
TABLE 285
MIDDLE EAST & AFRICA: AUTOMATED BREACH AND ATTACK SIMULATION MARKET, BY SERVICE, 2018–2023 (USD THOUSAND)
TABLE 286
MIDDLE EAST & AFRICA: AUTOMATED BREACH AND ATTACK SIMULATION MARKET, BY SERVICE, 2024–2029 (USD THOUSAND)
TABLE 287
MIDDLE EAST & AFRICA: AUTOMATED BREACH AND ATTACK SIMULATION MARKET, BY PROFESSIONAL SERVICE, 2018–2023 (USD THOUSAND)
TABLE 288
MIDDLE EAST & AFRICA: AUTOMATED BREACH AND ATTACK SIMULATION MARKET, BY PROFESSIONAL SERVICE, 2024–2029 (USD THOUSAND)
TABLE 289
MIDDLE EAST & AFRICA: AUTOMATED BREACH AND ATTACK SIMULATION MARKET, BY DEPLOYMENT MODE, 2018–2023 (USD THOUSAND)
TABLE 290
MIDDLE EAST & AFRICA: AUTOMATED BREACH AND ATTACK SIMULATION MARKET, BY DEPLOYMENT MODE, 2024–2029 (USD THOUSAND)
TABLE 291
MIDDLE EAST & AFRICA: AUTOMATED BREACH AND ATTACK SIMULATION MARKET, BY ORGANIZATION SIZE, 2018–2023 (USD THOUSAND)
TABLE 292
MIDDLE EAST & AFRICA: AUTOMATED BREACH AND ATTACK SIMULATION MARKET, BY ORGANIZATION SIZE, 2024–2029 (USD THOUSAND)
TABLE 293
MIDDLE EAST & AFRICA: AUTOMATED BREACH AND ATTACK SIMULATION MARKET, BY APPLICATION, 2018–2023 (USD THOUSAND)
TABLE 294
MIDDLE EAST & AFRICA: AUTOMATED BREACH AND ATTACK SIMULATION MARKET, BY APPLICATION, 2024–2029 (USD THOUSAND)
TABLE 295
MIDDLE EAST & AFRICA: AUTOMATED BREACH AND ATTACK SIMULATION MARKET, BY VERTICAL, 2018–2023 (USD THOUSAND)
TABLE 296
MIDDLE EAST & AFRICA: BREACH AND ATTACK SIMULATION MARKET, BY VERTICAL, 2024–2029 (USD THOUSAND)
TABLE 297
MIDDLE EAST & AFRICA: AUTOMATED BREACH AND ATTACK SIMULATION MARKET BY COUNTRY, 2018–2023 (USD THOUSAND)
TABLE 298
MIDDLE EAST & AFRICA: AUTOMATED BREACH AND ATTACK SIMULATION MARKET BY COUNTRY, 2024–2029 (USD THOUSAND)
TABLE 299
GCC: AUTOMATED BREACH AND ATTACK SIMULATION MARKET, BY OFFERING, 2018–2023 (USD THOUSAND)
TABLE 300
GCC: AUTOMATED BREACH AND ATTACK SIMULATION MARKET, BY OFFERING, 2024–2029 (USD THOUSAND)
TABLE 301
GCC: AUTOMATED BREACH AND ATTACK SIMULATION MARKET, BY SERVICE, 2018–2023 (USD THOUSAND)
TABLE 302
GCC: AUTOMATED BREACH AND ATTACK SIMULATION MARKET, BY SERVICE, 2024–2029 (USD THOUSAND)
TABLE 303
GCC: AUTOMATED BREACH AND ATTACK SIMULATION MARKET, BY PROFESSIONAL SERVICE, 2018–2023 (USD THOUSAND)
TABLE 304
GCC: AUTOMATED BREACH AND ATTACK SIMULATION MARKET, BY PROFESSIONAL SERVICE, 2024–2029 (USD THOUSAND)
TABLE 305
GCC: AUTOMATED BREACH AND ATTACK SIMULATION MARKET, BY DEPLOYMENT MODE, 2018–2023 (USD THOUSAND)
TABLE 306
GCC: AUTOMATED BREACH AND ATTACK SIMULATION MARKET, BY DEPLOYMENT MODE, 2024–2029 (USD THOUSAND)
TABLE 307
GCC: AUTOMATED BREACH AND ATTACK SIMULATION MARKET, BY ORGANIZATION SIZE, 2018–2023 (USD THOUSAND)
TABLE 308
GCC: AUTOMATED BREACH AND ATTACK SIMULATION MARKET, BY ORGANIZATION SIZE, 2024–2029 (USD THOUSAND)
TABLE 309
GCC: AUTOMATED BREACH AND ATTACK SIMULATION MARKET, BY APPLICATION, 2018–2023 (USD THOUSAND)
TABLE 310
GCC: AUTOMATED BREACH AND ATTACK SIMULATION MARKET, BY APPLICATION, 2024–2029 (USD THOUSAND)
TABLE 311
GCC: AUTOMATED BREACH AND ATTACK SIMULATION MARKET, BY VERTICAL, 2018–2023 (USD THOUSAND)
TABLE 312
GCC: BREACH AND ATTACK SIMULATION MARKET, BY VERTICAL, 2024–2029 (USD THOUSAND)
TABLE 313
GCC: AUTOMATED BREACH AND ATTACK SIMULATION MARKET, BY COUNTRY, 2018–2023 (USD THOUSAND)
TABLE 314
GCC: AUTOMATED BREACH AND ATTACK SIMULATION MARKET, BY COUNTRY, 2024–2029 (USD THOUSAND)
TABLE 315
KSA: AUTOMATED BREACH AND ATTACK SIMULATION MARKET, BY OFFERING, 2018–2023 (USD THOUSAND)
TABLE 316
KSA: AUTOMATED BREACH AND ATTACK SIMULATION MARKET, BY OFFERING, 2024–2029 (USD THOUSAND)
TABLE 317
KSA: AUTOMATED BREACH AND ATTACK SIMULATION MARKET, BY SERVICE, 2018–2023 (USD THOUSAND)
TABLE 318
KSA: AUTOMATED BREACH AND ATTACK SIMULATION MARKET, BY SERVICE, 2024–2029 (USD THOUSAND)
TABLE 319
KSA: AUTOMATED BREACH AND ATTACK SIMULATION MARKET, BY PROFESSIONAL SERVICE, 2018–2023 (USD THOUSAND)
TABLE 320
KSA: AUTOMATED BREACH AND ATTACK SIMULATION MARKET, BY PROFESSIONAL SERVICE, 2024–2029 (USD THOUSAND)
TABLE 321
KSA: AUTOMATED BREACH AND ATTACK SIMULATION MARKET, BY DEPLOYMENT MODE, 2018–2023 (USD THOUSAND)
TABLE 322
KSA: AUTOMATED BREACH AND ATTACK SIMULATION MARKET, BY DEPLOYMENT MODE, 2024–2029 (USD THOUSAND)
TABLE 323
KSA: AUTOMATED BREACH AND ATTACK SIMULATION MARKET, BY ORGANIZATION SIZE, 2018–2023 (USD THOUSAND)
TABLE 324
KSA: AUTOMATED BREACH AND ATTACK SIMULATION MARKET, BY ORGANIZATION SIZE, 2024–2029 (USD THOUSAND)
TABLE 325
KSA: AUTOMATED BREACH AND ATTACK SIMULATION MARKET, BY APPLICATION, 2018–2023 (USD THOUSAND)
TABLE 326
KSA: AUTOMATED BREACH AND ATTACK SIMULATION MARKET, BY APPLICATION, 2024–2029 (USD THOUSAND)
TABLE 327
KSA: AUTOMATED BREACH AND ATTACK SIMULATION MARKET, BY VERTICAL, 2018–2023 (USD THOUSAND)
TABLE 328
KSA: BREACH AND ATTACK SIMULATION MARKET, BY VERTICAL, 2024–2029 (USD THOUSAND)
TABLE 329
UAE: AUTOMATED BREACH AND ATTACK SIMULATION MARKET, BY OFFERING, 2018–2023 (USD THOUSAND)
TABLE 330
UAE: AUTOMATED BREACH AND ATTACK SIMULATION MARKET, BY OFFERING, 2024–2029 (USD THOUSAND)
TABLE 331
UAE: AUTOMATED BREACH AND ATTACK SIMULATION MARKET, BY SERVICE, 2018–2023 (USD THOUSAND)
TABLE 332
UAE: AUTOMATED BREACH AND ATTACK SIMULATION MARKET, BY SERVICE, 2024–2029 (USD THOUSAND)
TABLE 333
UAE: AUTOMATED BREACH AND ATTACK SIMULATION MARKET, BY PROFESSIONAL SERVICE, 2018–2023 (USD THOUSAND)
TABLE 334
UAE: AUTOMATED BREACH AND ATTACK SIMULATION MARKET, BY PROFESSIONAL SERVICE, 2024–2029 (USD THOUSAND)
TABLE 335
UAE: AUTOMATED BREACH AND ATTACK SIMULATION MARKET, BY DEPLOYMENT MODE, 2018–2023 (USD THOUSAND)
TABLE 336
UAE: AUTOMATED BREACH AND ATTACK SIMULATION MARKET, BY DEPLOYMENT MODE, 2024–2029 (USD THOUSAND)
TABLE 337
UAE: AUTOMATED BREACH AND ATTACK SIMULATION MARKET, BY ORGANIZATION SIZE, 2018–2023 (USD THOUSAND)
TABLE 338
UAE: AUTOMATED BREACH AND ATTACK SIMULATION MARKET, BY ORGANIZATION SIZE, 2024–2029 (USD THOUSAND)
TABLE 339
UAE: AUTOMATED BREACH AND ATTACK SIMULATION MARKET, BY APPLICATION, 2018–2023 (USD THOUSAND)
TABLE 340
UAE: AUTOMATED BREACH AND ATTACK SIMULATION MARKET, BY APPLICATION, 2024–2029 (USD THOUSAND)
TABLE 341
UAE: AUTOMATED BREACH AND ATTACK SIMULATION MARKET, BY VERTICAL, 2018–2023 (USD THOUSAND)
TABLE 342
UAE: BREACH AND ATTACK SIMULATION MARKET, BY VERTICAL, 2024–2029 (USD THOUSAND)
TABLE 343
REST OF GCC: AUTOMATED BREACH AND ATTACK SIMULATION MARKET, BY OFFERING, 2018–2023 (USD THOUSAND)
TABLE 344
REST OF GCC: AUTOMATED BREACH AND ATTACK SIMULATION MARKET, BY OFFERING, 2024–2029 (USD THOUSAND)
TABLE 345
REST OF GCC: AUTOMATED BREACH AND ATTACK SIMULATION MARKET, BY SERVICE, 2018–2023 (USD THOUSAND)
TABLE 346
REST OF GCC: AUTOMATED BREACH AND ATTACK SIMULATION MARKET, BY SERVICE, 2024–2029 (USD THOUSAND)
TABLE 347
REST OF GCC: AUTOMATED BREACH AND ATTACK SIMULATION MARKET, BY PROFESSIONAL SERVICE, 2018–2023 (USD THOUSAND)
TABLE 348
REST OF GCC: AUTOMATED BREACH AND ATTACK SIMULATION MARKET, BY PROFESSIONAL SERVICE, 2024–2029 (USD THOUSAND)
TABLE 349
REST OF GCC: AUTOMATED BREACH AND ATTACK SIMULATION MARKET, BY DEPLOYMENT MODE, 2018–2023 (USD THOUSAND)
TABLE 350
REST OF GCC: AUTOMATED BREACH AND ATTACK SIMULATION MARKET, BY DEPLOYMENT MODE, 2024–2029 (USD THOUSAND)
TABLE 351
REST OF GCC: AUTOMATED BREACH AND ATTACK SIMULATION MARKET, BY ORGANIZATION SIZE, 2018–2023 (USD THOUSAND)
TABLE 352
REST OF GCC: AUTOMATED BREACH AND ATTACK SIMULATION MARKET, BY ORGANIZATION SIZE, 2024–2029 (USD THOUSAND)
TABLE 353
REST OF GCC: AUTOMATED BREACH AND ATTACK SIMULATION MARKET, BY APPLICATION, 2018–2023 (USD THOUSAND)
TABLE 354
REST OF GCC: AUTOMATED BREACH AND ATTACK SIMULATION MARKET, BY APPLICATION, 2024–2029 (USD THOUSAND)
TABLE 355
REST OF GCC: AUTOMATED BREACH AND ATTACK SIMULATION MARKET, BY VERTICAL, 2018–2023 (USD THOUSAND)
TABLE 356
REST OF GCC: BREACH AND ATTACK SIMULATION MARKET, BY VERTICAL, 2024–2029 (USD THOUSAND)
TABLE 357
SOUTH AFRICA: AUTOMATED BREACH AND ATTACK SIMULATION MARKET, BY OFFERING, 2018–2023 (USD THOUSAND)
TABLE 358
SOUTH AFRICA: AUTOMATED BREACH AND ATTACK SIMULATION MARKET, BY OFFERING, 2024–2029 (USD THOUSAND)
TABLE 359
SOUTH AFRICA: AUTOMATED BREACH AND ATTACK SIMULATION MARKET, BY SERVICE, 2018–2023 (USD THOUSAND)
TABLE 360
SOUTH AFRICA: AUTOMATED BREACH AND ATTACK SIMULATION MARKET, BY SERVICE, 2024–2029 (USD THOUSAND)
TABLE 361
SOUTH AFRICA: AUTOMATED BREACH AND ATTACK SIMULATION MARKET, BY PROFESSIONAL SERVICE, 2018–2023 (USD THOUSAND)
TABLE 362
SOUTH AFRICA: AUTOMATED BREACH AND ATTACK SIMULATION MARKET, BY PROFESSIONAL SERVICE, 2024–2029 (USD THOUSAND)
TABLE 363
SOUTH AFRICA: AUTOMATED BREACH AND ATTACK SIMULATION MARKET, BY DEPLOYMENT MODE, 2018–2023 (USD THOUSAND)
TABLE 364
SOUTH AFRICA: AUTOMATED BREACH AND ATTACK SIMULATION MARKET, BY DEPLOYMENT MODE, 2024–2029 (USD THOUSAND)
TABLE 365
SOUTH AFRICA: AUTOMATED BREACH AND ATTACK SIMULATION MARKET, BY ORGANIZATION SIZE, 2018–2023 (USD THOUSAND)
TABLE 366
SOUTH AFRICA: AUTOMATED BREACH AND ATTACK SIMULATION MARKET, BY ORGANIZATION SIZE, 2024–2029 (USD THOUSAND)
TABLE 367
SOUTH AFRICA: AUTOMATED BREACH AND ATTACK SIMULATION MARKET, BY APPLICATION, 2018–2023 (USD THOUSAND)
TABLE 368
SOUTH AFRICA: AUTOMATED BREACH AND ATTACK SIMULATION MARKET, BY APPLICATION, 2024–2029 (USD THOUSAND)
TABLE 369
SOUTH AFRICA: AUTOMATED BREACH AND ATTACK SIMULATION MARKET, BY VERTICAL, 2018–2023 (USD THOUSAND)
TABLE 370
SOUTH AFRICA: BREACH AND ATTACK SIMULATION MARKET, BY VERTICAL, 2024–2029 (USD THOUSAND)
TABLE 371
REST OF MIDDLE EAST & AFRICA: AUTOMATED BREACH AND ATTACK SIMULATION MARKET, BY OFFERING, 2018–2023 (USD THOUSAND)
TABLE 372
REST OF MIDDLE EAST & AFRICA: AUTOMATED BREACH AND ATTACK SIMULATION MARKET, BY OFFERING, 2024–2029 (USD THOUSAND)
TABLE 373
REST OF MIDDLE EAST & AFRICA: AUTOMATED BREACH AND ATTACK SIMULATION MARKET, BY SERVICE, 2018–2023 (USD THOUSAND)
TABLE 374
REST OF MIDDLE EAST & AFRICA: AUTOMATED BREACH AND ATTACK SIMULATION MARKET, BY SERVICE, 2024–2029 (USD THOUSAND)
TABLE 375
REST OF MIDDLE EAST & AFRICA: AUTOMATED BREACH AND ATTACK SIMULATION MARKET, BY PROFESSIONAL SERVICE, 2018–2023 (USD THOUSAND)
TABLE 376
REST OF MIDDLE EAST & AFRICA: AUTOMATED BREACH AND ATTACK SIMULATION MARKET, BY PROFESSIONAL SERVICE, 2024–2029 (USD THOUSAND)
TABLE 377
REST OF MIDDLE EAST & AFRICA: AUTOMATED BREACH AND ATTACK SIMULATION MARKET, BY DEPLOYMENT MODE, 2018–2023 (USD THOUSAND)
TABLE 378
REST OF MIDDLE EAST & AFRICA: AUTOMATED BREACH AND ATTACK SIMULATION MARKET, BY DEPLOYMENT MODE, 2024–2029 (USD THOUSAND)
TABLE 379
REST OF MIDDLE EAST & AFRICA: AUTOMATED BREACH AND ATTACK SIMULATION MARKET, BY ORGANIZATION SIZE, 2018–2023 (USD THOUSAND)
TABLE 380
REST OF MIDDLE EAST & AFRICA: AUTOMATED BREACH AND ATTACK SIMULATION MARKET, BY ORGANIZATION SIZE, 2024–2029 (USD THOUSAND)
TABLE 381
REST OF MIDDLE EAST & AFRICA: AUTOMATED BREACH AND ATTACK SIMULATION MARKET, BY APPLICATION, 2018–2023 (USD THOUSAND)
TABLE 382
REST OF MIDDLE EAST & AFRICA: AUTOMATED BREACH AND ATTACK SIMULATION MARKET, BY APPLICATION, 2024–2029 (USD THOUSAND)
TABLE 383
REST OF MIDDLE EAST & AFRICA: AUTOMATED BREACH AND ATTACK SIMULATION MARKET, BY VERTICAL, 2018–2023 (USD THOUSAND)
TABLE 384
REST OF MIDDLE EAST & AFRICA: AUTOMATED BREACH AND ATTACK SIMULATION MARKET, BY VERTICAL, 2024–2029 (USD THOUSAND)
TABLE 385
LATIN AMERICA: AUTOMATED BREACH AND ATTACK SIMULATION MARKET, BY OFFERING, 2018–2023 (USD THOUSAND)
TABLE 386
LATIN AMERICA: AUTOMATED BREACH AND ATTACK SIMULATION MARKET, BY OFFERING, 2024–2029 (USD THOUSAND)
TABLE 387
LATIN AMERICA: AUTOMATED BREACH AND ATTACK SIMULATION MARKET, BY SERVICE, 2018–2023 (USD THOUSAND)
TABLE 388
LATIN AMERICA: AUTOMATED BREACH AND ATTACK SIMULATION MARKET, BY SERVICE, 2024–2029 (USD THOUSAND)
TABLE 389
LATIN AMERICA: AUTOMATED BREACH AND ATTACK SIMULATION MARKET, BY PROFESSIONAL SERVICE, 2018–2023 (USD THOUSAND)
TABLE 390
LATIN AMERICA: AUTOMATED BREACH AND ATTACK SIMULATION MARKET, BY PROFESSIONAL SERVICE, 2024–2029 (USD THOUSAND)
TABLE 391
LATIN AMERICA: AUTOMATED BREACH AND ATTACK SIMULATION MARKET, BY DEPLOYMENT MODE, 2018–2023 (USD THOUSAND)
TABLE 392
LATIN AMERICA: AUTOMATED BREACH AND ATTACK SIMULATION MARKET, BY DEPLOYMENT MODE, 2024–2029 (USD THOUSAND)
TABLE 393
LATIN AMERICA: AUTOMATED BREACH AND ATTACK SIMULATION MARKET, BY ORGANIZATION SIZE, 2018–2023 (USD THOUSAND)
TABLE 394
LATIN AMERICA: AUTOMATED BREACH AND ATTACK SIMULATION MARKET, BY ORGANIZATION SIZE, 2024–2029 (USD THOUSAND)
TABLE 395
LATIN AMERICA: AUTOMATED BREACH AND ATTACK SIMULATION MARKET, BY APPLICATION, 2018–2023 (USD THOUSAND)
TABLE 396
LATIN AMERICA: AUTOMATED BREACH AND ATTACK SIMULATION MARKET, BY APPLICATION, 2024–2029 (USD THOUSAND)
TABLE 397
LATIN AMERICA: AUTOMATED BREACH AND ATTACK SIMULATION MARKET, BY VERTICAL, 2018–2023 (USD THOUSAND)
TABLE 398
LATIN AMERICA: AUTOMATED BREACH AND ATTACK SIMULATION MARKET, BY VERTICAL, 2024–2029 (USD THOUSAND)
TABLE 399
LATIN AMERICA: AUTOMATED BREACH AND ATTACK SIMULATION MARKET, BY COUNTRY, 2018–2023 (USD THOUSAND)
TABLE 400
LATIN AMERICA: AUTOMATED BREACH AND ATTACK SIMULATION MARKET, BY COUNTRY, 2024–2029 (USD THOUSAND)
TABLE 401
BRAZIL: AUTOMATED BREACH AND ATTACK SIMULATION MARKET, BY OFFERING, 2018–2023 (USD THOUSAND)
TABLE 402
BRAZIL: AUTOMATED BREACH AND ATTACK SIMULATION MARKET, BY OFFERING, 2024–2029 (USD THOUSAND)
TABLE 403
BRAZIL: AUTOMATED BREACH AND ATTACK SIMULATION MARKET, BY SERVICE, 2018–2023 (USD THOUSAND)
TABLE 404
BRAZIL: AUTOMATED BREACH AND ATTACK SIMULATION MARKET, BY SERVICE, 2024–2029 (USD THOUSAND)
TABLE 405
BRAZIL: AUTOMATED BREACH AND ATTACK SIMULATION MARKET, BY PROFESSIONAL SERVICE, 2018–2023 (USD THOUSAND)
TABLE 406
BRAZIL: AUTOMATED BREACH AND ATTACK SIMULATION MARKET, BY PROFESSIONAL SERVICE, 2024–2029 (USD THOUSAND)
TABLE 407
BRAZIL: AUTOMATED BREACH AND ATTACK SIMULATION MARKET, BY DEPLOYMENT MODE, 2018–2023 (USD THOUSAND)
TABLE 408
BRAZIL: AUTOMATED BREACH AND ATTACK SIMULATION MARKET, BY DEPLOYMENT MODE, 2024–2029 (USD THOUSAND)
TABLE 409
BRAZIL: AUTOMATED BREACH AND ATTACK SIMULATION MARKET, BY ORGANIZATION SIZE, 2018–2023 (USD THOUSAND)
TABLE 410
BRAZIL: AUTOMATED BREACH AND ATTACK SIMULATION MARKET, BY ORGANIZATION SIZE, 2024–2029 (USD THOUSAND)
TABLE 411
BRAZIL: AUTOMATED BREACH AND ATTACK SIMULATION MARKET, BY APPLICATION, 2018–2023 (USD THOUSAND)
TABLE 412
BRAZIL: AUTOMATED BREACH AND ATTACK SIMULATION MARKET, BY APPLICATION, 2024–2029 (USD THOUSAND)
TABLE 413
BRAZIL: AUTOMATED BREACH AND ATTACK SIMULATION MARKET, BY VERTICAL, 2018–2023 (USD THOUSAND)
TABLE 414
BRAZIL: AUTOMATED BREACH AND ATTACK SIMULATION MARKET, BY VERTICAL, 2024–2029 (USD THOUSAND)
TABLE 415
MEXICO: AUTOMATED BREACH AND ATTACK SIMULATION MARKET, BY OFFERING, 2018–2023 (USD THOUSAND)
TABLE 416
MEXICO: AUTOMATED BREACH AND ATTACK SIMULATION MARKET, BY OFFERING, 2024–2029 (USD THOUSAND)
TABLE 417
MEXICO: AUTOMATED BREACH AND ATTACK SIMULATION MARKET, BY SERVICE, 2018–2023 (USD THOUSAND)
TABLE 418
MEXICO: AUTOMATED BREACH AND ATTACK SIMULATION MARKET, BY SERVICE, 2024–2029 (USD THOUSAND)
TABLE 419
MEXICO: AUTOMATED BREACH AND ATTACK SIMULATION MARKET, BY PROFESSIONAL SERVICE, 2018–2023 (USD THOUSAND)
TABLE 420
MEXICO: AUTOMATED BREACH AND ATTACK SIMULATION MARKET, BY PROFESSIONAL SERVICE, 2024–2029 (USD THOUSAND)
TABLE 421
MEXICO: AUTOMATED BREACH AND ATTACK SIMULATION MARKET, BY DEPLOYMENT MODE, 2018–2023 (USD THOUSAND)
TABLE 422
MEXICO: AUTOMATED BREACH AND ATTACK SIMULATION MARKET, BY DEPLOYMENT MODE, 2024–2029 (USD THOUSAND)
TABLE 423
MEXICO: AUTOMATED BREACH AND ATTACK SIMULATION MARKET, BY ORGANIZATION SIZE, 2018–2023 (USD THOUSAND)
TABLE 424
MEXICO: AUTOMATED BREACH AND ATTACK SIMULATION MARKET, BY ORGANIZATION SIZE, 2024–2029 (USD THOUSAND)
TABLE 425
MEXICO: AUTOMATED BREACH AND ATTACK SIMULATION MARKET, BY APPLICATION, 2018–2023 (USD THOUSAND)
TABLE 426
MEXICO: AUTOMATED BREACH AND ATTACK SIMULATION MARKET, BY APPLICATION, 2024–2029 (USD THOUSAND)
TABLE 427
MEXICO: AUTOMATED BREACH AND ATTACK SIMULATION MARKET, BY VERTICAL, 2018–2023 (USD THOUSAND)
TABLE 428
MEXICO: AUTOMATED BREACH AND ATTACK SIMULATION MARKET, BY VERTICAL, 2024–2029 (USD THOUSAND)
TABLE 429
REST OF LATIN AMERICA: AUTOMATED BREACH AND ATTACK SIMULATION MARKET, BY OFFERING, 2018–2023 (USD THOUSAND)
TABLE 430
REST OF LATIN AMERICA: AUTOMATED BREACH AND ATTACK SIMULATION MARKET, BY OFFERING, 2024–2029 (USD THOUSAND)
TABLE 431
REST OF LATIN AMERICA: AUTOMATED BREACH AND ATTACK SIMULATION MARKET, BY SERVICE, 2018–2023 (USD THOUSAND)
TABLE 432
REST OF LATIN AMERICA: AUTOMATED BREACH AND ATTACK SIMULATION MARKET, BY SERVICE, 2024–2029 (USD THOUSAND)
TABLE 433
REST OF LATIN AMERICA: AUTOMATED BREACH AND ATTACK SIMULATION MARKET, BY PROFESSIONAL SERVICE, 2018–2023 (USD THOUSAND)
TABLE 434
REST OF LATIN AMERICA: AUTOMATED BREACH AND ATTACK SIMULATION MARKET, BY PROFESSIONAL SERVICE, 2024–2029 (USD THOUSAND)
TABLE 435
REST OF LATIN AMERICA: AUTOMATED BREACH AND ATTACK SIMULATION MARKET, BY DEPLOYMENT MODE, 2018–2023 (USD THOUSAND)
TABLE 436
REST OF LATIN AMERICA: AUTOMATED BREACH AND ATTACK SIMULATION MARKET, BY DEPLOYMENT MODE, 2024–2029 (USD THOUSAND)
TABLE 437
REST OF LATIN AMERICA: AUTOMATED BREACH AND ATTACK SIMULATION MARKET, BY ORGANIZATION SIZE, 2018–2023 (USD THOUSAND)
TABLE 438
REST OF LATIN AMERICA: AUTOMATED BREACH AND ATTACK SIMULATION MARKET, BY ORGANIZATION SIZE, 2024–2029 (USD THOUSAND)
TABLE 439
REST OF LATIN AMERICA: AUTOMATED BREACH AND ATTACK SIMULATION MARKET, BY APPLICATION, 2018–2023 (USD THOUSAND)
TABLE 440
REST OF LATIN AMERICA: AUTOMATED BREACH AND ATTACK SIMULATION MARKET, BY APPLICATION, 2024–2029 (USD THOUSAND)
TABLE 441
REST OF LATIN AMERICA: AUTOMATED BREACH AND ATTACK SIMULATION MARKET, BY VERTICAL, 2018–2023 (USD THOUSAND)
TABLE 442
REST OF LATIN AMERICA: AUTOMATED BREACH AND ATTACK SIMULATION MARKET, BY VERTICAL, 2024–2029 (USD THOUSAND)
TABLE 443
OVERVIEW OF STRATEGIES ADOPTED BY KEY AUTOMATED BREACH AND ATTACK SIMULATION VENDORS
TABLE 444
AUTOMATED BREACH AND ATTACK SIMULATION MARKET: DEGREE OF COMPETITION
TABLE 445
AUTOMATED BREACH AND ATTACK SIMULATION MARKET: REGIONAL FOOTPRINT
TABLE 446
AUTOMATED BREACH AND ATTACK SIMULATION MARKET: DEPLOYMENT MODE FOOTPRINT
TABLE 447
AUTOMATED BREACH AND ATTACK SIMULATION MARKET: VERTICAL FOOTPRINT
TABLE 448
AUTOMATED BREACH AND ATTACK SIMULATION MARKET: KEY STARTUPS/SMES
TABLE 449
AUTOMATED BREACH AND ATTACK SIMULATION MARKET: COMPETITIVE BENCHMARKING OF KEY STARTUPS/SMES, BY VERTICAL
TABLE 450
AUTOMATED BREACH AND ATTACK SIMULATION MARKET: COMPETITIVE BENCHMARKING OF KEY STARTUPS/SMES, BY REGION
TABLE 451
AUTOMATED BREACH AND ATTACK SIMULATION MARKET: PRODUCT LAUNCHES & ENHANCEMENTS, 2022–2024
TABLE 452
AUTOMATED BREACH AND ATTACK SIMULATION MARKET: DEALS, 2022–2024
TABLE 453
CYMULATE: COMPANY OVERVIEW
TABLE 454
CYMULATE: PRODUCTS/SOLUTIONS/SERVICES OFFERED
TABLE 455
CYMULATE: PRODUCT LAUNCHES & ENHANCEMENTS
TABLE 456
CYMULATE: DEALS
TABLE 457
CYMULATE: OTHER DEVELOPMENTS
TABLE 458
ATTACKIQ: COMPANY OVERVIEW
TABLE 459
ATTACKIQ: PRODUCTS/SOLUTIONS/SERVICES OFFERED
TABLE 460
ATTACKIQ: PRODUCT LAUNCHES & ENHANCEMENTS
TABLE 461
ATTACKIQ: DEALS
TABLE 462
XM CYBER: COMPANY OVERVIEW
TABLE 463
XM CYBER: PRODUCTS/SOLUTIONS/SERVICES OFFERED
TABLE 464
SAFEBREACH: COMPANY OVERVIEW
TABLE 465
SAFEBREACH: PRODUCTS/SOLUTIONS/SERVICES OFFERED
TABLE 466
SAFEBREACH: PRODUCT LAUNCHES & ENHANCEMENTS
TABLE 467
SAFEBREACH: DEALS
TABLE 468
PICUS SECURITY: COMPANY OVERVIEW
TABLE 469
PICUS SECURITY: PRODUCTS/SOLUTIONS/SERVICES OFFERED
TABLE 470
PICUS SECURITY: PRODUCT LAUNCHES & ENHANCEMENTS
TABLE 471
QUALYS: COMPANY OVERVIEW
TABLE 472
QUALYS: PRODUCTS/SOLUTIONS/SERVICES OFFERED
TABLE 473
QUALYS: PRODUCT LAUNCHES & ENHANCEMENTS
TABLE 475
RAPID7: COMPANY OVERVIEW
TABLE 476
RAPID7: PRODUCTS/SOLUTIONS/SERVICES OFFERED
TABLE 477
RAPID7: PRODUCT LAUNCHES & ENHANCEMENTS
TABLE 479
IBM: COMPANY OVERVIEW
TABLE 480
IBM: PRODUCTS/SOLUTIONS/SERVICES OFFERED
TABLE 481
IBM: PRODUCT LAUNCHES & ENHANCEMENTS
TABLE 483
IBM: OTHER DEVELOPMENTS
TABLE 484
FORTINET: COMPANY OVERVIEW
TABLE 485
FORTINET: PRODUCTS/SOLUTIONS/SERVICES OFFERED
TABLE 486
FORTINET: PRODUCT LAUNCHES & ENHANCEMENTS
TABLE 487
MANDIANT: COMPANY OVERVIEW
TABLE 488
MANDIANT: PRODUCTS/SOLUTIONS/SERVICES OFFERED
TABLE 489
KEYSIGHT TECHNOLOGIES: COMPANY OVERVIEW
TABLE 490
KEYSIGHT TECHNOLOGIES: PRODUCTS/SOLUTIONS/SERVICES OFFERED
TABLE 491
KEYSIGHT TECHNOLOGIES: PRODUCT LAUNCHES & ENHANCEMENTS
TABLE 492
KEYSIGHT TECHNOLOGIES: DEALS
TABLE 493
AUJAS: COMPANY OVERVIEW
TABLE 494
AUJAS: PRODUCTS/SOLUTIONS/SERVICES OFFERED
TABLE 495
ADJACENT MARKETS AND FORECASTS
TABLE 496
PENETRATION-TESTING-AS-A-SERVICE MARKET, BY OFFERING, 2019–2023 (USD MILLION)
TABLE 497
PENETRATION-TESTING-AS-A-SERVICE MARKET, BY OFFERING, 2024–2029 (USD MILLION)
TABLE 498
PENETRATION-TESTING-AS-A-SERVICE MARKET, BY ORGANIZATION SIZE, 2019–2023 (USD MILLION)
TABLE 499
PENETRATION-TESTING-AS-A-SERVICE MARKET, BY ORGANIZATION SIZE, 2024–2029 (USD MILLION)
TABLE 500
PENETRATION-TESTING-AS-A-SERVICE MARKET, BY TESTING TYPE, 2019–2023 (USD MILLION)
TABLE 501
PENETRATION-TESTING-AS-A-SERVICE MARKET, BY TESTING TYPE, 2024–2029 (USD MILLION)
TABLE 502
PENETRATION-TESTING-AS-A-SERVICE MARKET, BY VERTICAL, 2019–2023 (USD MILLION)
TABLE 503
PENETRATION-TESTING-AS-A-SERVICE MARKET, BY VERTICAL, 2024–2029 (USD MILLION)
TABLE 504
SECURITY AND VULNERABILITY MANAGEMENT MARKET, BY COMPONENT, 2016–2020 (USD MILLION)
TABLE 505
SECURITY AND VULNERABILITY MANAGEMENT MARKET, BY COMPONENT, 2021–2026 (USD MILLION)
TABLE 506
SECURITY AND VULNERABILITY MANAGEMENT MARKET SIZE, BY TARGET, 2016–2020 (USD MILLION)
TABLE 507
SECURITY AND VULNERABILITY MANAGEMENT MARKET, BY TARGET, 2021–2026 (USD MILLION)
TABLE 508
SECURITY AND VULNERABILITY MANAGEMENT MARKET, BY DEPLOYMENT MODE, 2016–2020 (USD MILLION)
TABLE 509
SECURITY AND VULNERABILITY MANAGEMENT MARKET, BY DEPLOYMENT MODE, 2021–2026 (USD MILLION)
TABLE 510
SECURITY AND VULNERABILITY MANAGEMENT MARKET, BY ORGANIZATION SIZE, 2016–2020 (USD MILLION)
TABLE 511
SECURITY AND VULNERABILITY MANAGEMENT MARKET, BY ORGANIZATION SIZE, 2021–2026 (USD MILLION)
TABLE 512
SECURITY AND VULNERABILITY MANAGEMENT MARKET, BY VERTICAL, 2016–2020 (USD MILLION)
TABLE 513
SECURITY AND VULNERABILITY MANAGEMENT MARKET, BY VERTICAL, 2021–2026 (USD MILLION)
FIGURE 1
AUTOMATED BREACH AND ATTACK SIMULATION MARKET: RESEARCH DESIGN
FIGURE 2
AUTOMATED BREACH AND ATTACK SIMULATION MARKET: DATA TRIANGULATION
FIGURE 3
AUTOMATED BREACH AND ATTACK SIMULATION MARKET ESTIMATION: RESEARCH FLOW
FIGURE 4
APPROACH 1 (SUPPLY SIDE): REVENUE FROM PLATFORMS/SERVICES OF AUTOMATED BREACH AND ATTACK SIMULATION VENDORS
FIGURE 5
APPROACH 1 - SUPPLY-SIDE ANALYSIS
FIGURE 6
APPROACH 2 - BOTTOM-UP (DEMAND SIDE): PLATFORMS/ SERVICES
FIGURE 7
GLOBAL AUTOMATED BREACH AND ATTACK SIMULATION MARKET SIZE AND Y-O-Y GROWTH RATE
FIGURE 8
NORTH AMERICA TO ACCOUNT FOR LARGEST SHARE IN 2024
FIGURE 9
GROWING INSTANCES OF RANSOMWARE THREATS TARGETING SMALL ENTERPRISES TO FUEL MARKET GROWTH
FIGURE 10
PLATFORMS & TOOLS SEGMENT TO HOLD LARGER MARKET SHARE DURING FORECAST PERIOD
FIGURE 11
ON-PREMISES SEGMENT TO ACCOUNT FOR LARGER MARKET SHARE DURING FORECAST PERIOD
FIGURE 12
SMES SEGMENT TO ACCOUNT FOR HIGHER CAGR DURING FORECAST PERIOD
FIGURE 13
PATCH MANAGEMENT AND NORTH AMERICA TO ACCOUNT FOR LARGEST MARKET SHARE IN 2024
FIGURE 14
EUROPE TO EMERGE AS BEST MARKET FOR INVESTMENTS IN NEXT FIVE YEARS
FIGURE 15
AUTOMATED BREACH AND ATTACK SIMULATION MARKET: DRIVERS, RESTRAINTS, OPPORTUNITIES, AND CHALLENGES
FIGURE 16
MARKET POTENTIAL OF GENERATIVE AI IN ENHANCING AUTOMATED BREACH AND ATTACK SIMULATION ACROSS INDUSTRIES
FIGURE 17
IMPACT OF GEN AI ON INTERCONNECTED AND ADJACENT ECOSYSTEMS
FIGURE 18
VALUE CHAIN ANALYSIS
FIGURE 19
AUTOMATED BREACH AND ATTACK SIMULATION MARKET: ECOSYSTEM ANALYSIS
FIGURE 20
PORTER’S FIVE FORCES ANALYSIS: AUTOMATED BREACH AND ATTACK SIMULATION MARKET
FIGURE 21
AVERAGE SELLING PRICE TREND OF KEY PLAYERS, BY SOLUTION
FIGURE 22
NUMBER OF PATENTS GRANTED FOR AUTOMATED BREACH AND ATTACK SIMULATION MARKET, 2014–2024
FIGURE 23
REGIONAL ANALYSIS OF PATENTS GRANTED FOR AUTOMATED BREACH AND ATTACK SIMULATION MARKET, 2014–2024
FIGURE 24
REVENUE SHIFT OF AUTOMATED BREACH AND ATTACK SIMULATION MARKET VENDORS
FIGURE 25
INFLUENCE OF STAKEHOLDERS ON BUYING PROCESS FOR TOP THREE VERTICALS
FIGURE 26
KEY BUYING CRITERIA FOR TOP THREE VERTICALS
FIGURE 27
LEADING GLOBAL AUTOMATED BREACH AND ATTACK SIMULATION STARTUPS AND SMES, BY NUMBER OF INVESTORS AND FUNDING AMOUNT, 2024
FIGURE 28
SERVICES SEGMENT TO REGISTER HIGHEST CAGR DURING FORECAST PERIOD
FIGURE 29
ON-PREMISES SEGMENT TO DOMINATE MARKET DURING FORECAST PERIOD
FIGURE 30
SMES SEGMENT TO REGISTER HIGHER CAGR DURING FORECAST PERIOD
FIGURE 31
PATCH MANAGEMENT SEGMENT TO ACCOUNT FOR LARGEST MARKET DURING FORECAST PERIOD
FIGURE 32
HEALTHCARE SEGMENT TO LEAD MARKET DURING FORECAST PERIOD
FIGURE 33
NORTH AMERICA EXPECTED TO ACCOUNT FOR LARGEST MARKET DURING FORECAST PERIOD
FIGURE 34
NORTH AMERICA: MARKET SNAPSHOT
FIGURE 35
ASIA PACIFIC: MARKET SNAPSHOT
FIGURE 36
SEGMENTAL REVENUE ANALYSIS OF TOP FIVE MARKET PLAYERS, 2019–2023 (USD MILLION)
FIGURE 37
SHARE OF LEADING COMPANIES IN AUTOMATED BREACH AND ATTACK SIMULATION MARKET, 2023
FIGURE 38
AUTOMATED BREACH AND ATTACK SIMULATION MARKET: COMPARISON OF VENDORS’ BRANDS
FIGURE 39
AUTOMATED BREACH AND ATTACK SIMULATION MARKET: COMPANY VALUATION OF KEY VENDORS (USD BILLION)
FIGURE 40
AUTOMATED BREACH AND ATTACK SIMULATION MARKET: FINANCIAL METRICS OF KEY VENDORS
FIGURE 41
COMPANY EVALUATION MATRIX: KEY PLAYERS, 2023
FIGURE 42
AUTOMATED BREACH AND ATTACK SIMULATION MARKET: OVERALL COMPANY FOOTPRINT
FIGURE 43
COMPANY EVALUATION MATRIX: STARTUPS/SMES, 2023
FIGURE 44
QUALYS: COMPANY SNAPSHOT
FIGURE 45
RAPID7: COMPANY SNAPSHOT
FIGURE 46
IBM: COMPANY SNAPSHOT
FIGURE 47
FORTINET: COMPANY SNAPSHOT
FIGURE 48
KEYSIGHT TECHNOLOGIES: COMPANY SNAPSHOT


 Exclusive indicates content/data unique to MarketsandMarkets and not available with any competitors.


Growth opportunities and latent adjacency in Automated Breach and Attack Simulation Market